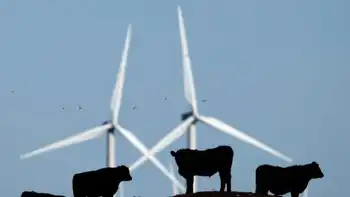
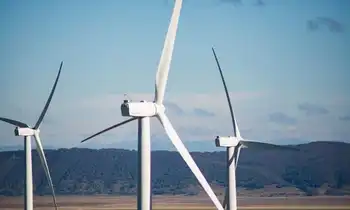
Japanese utilities buy into vast offshore wind farm in UK
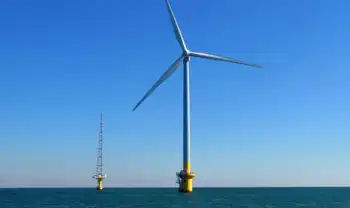

japanese wind farm

NFPA 70e Training

Our customized live online or in‑person group training can be delivered to your staff at your location.

  • Live Online
  • 6 hours Instructor-led
  • Group Training Available
Regular Price:
$199
Coupon Price:
$149
Reserve Your Seat Today

Japan Offshore Wind Investment signals Japanese utilities entering UK offshore wind, as J-Power and Kansai Electric buy into Innogy's Triton Knoll, leveraging North Sea expertise, 9.5MW turbines, and 15-year fixed-rate contracts.


Key Points

Japanese utilities buying UK offshore wind stakes to import expertise, as J-Power and Kansai join Innogy's Triton Knoll.

✅ $900M deal: J-Power 25%, Kansai Electric ~16% in Innogy unit

✅ Triton Knoll: 860MW, up to 90 9.5MW turbines, 15-year fixed PPA

✅ Goal: Transfer North Sea expertise to develop Japan offshore wind


Two of Japan's biggest power companies will buy around 40% of a German-owned developer of offshore wind farms in the U.K., seeking to learn from Britain's lead in this sector, as highlighted by a UK offshore wind milestone this week, and bring the know-how back home.

Tokyo-based Electric Power Development, better known as J-Power, will join Osaka regional utility Kansai Electric Power in investing in a unit of Germany's Innogy.

The deal, estimated to be worth around $900 million, will give J-Power a 25% stake and Kansai Electric a roughly 16% share. It will mark the first investment in an offshore wind project by Japanese power companies, as other markets shift strategies, with Poland backing wind over nuclear signaling broader momentum.

Innogy plans to start up the 860-megawatt Triton Knoll offshore wind project -- one of the biggest of its kind in the world -- in the North Sea in 2021. The vast installation will have up to 90 9.5MW turbines and sell its output to local utilities under a 15-year fixed-rate contract.

J-Power, which supplies mainly fossil-fuel-based electricity to Japanese regional utilities, will set up a subsidiary backed by the government-run Development Bank of Japan to participate in the Innogy project. Engineers will study firsthand construction and maintenance methods.

While land-based wind turbines are proliferating worldwide, offshore wind farms have progressed mainly in Europe, though U.S. offshore wind competitiveness is improving in key markets. Installed capacity totaled more than 18,000MW at the end of 2017, which at maximum capacity can produce as much power as 18 nuclear reactors.

Japan has hardly any offshore wind farms in commercial operation, and has little in the way of engineering know-how in this field or infrastructure for linking such installations to the land power grid, with a recent Japan grid blackout analysis underscoring these challenges. But there are plans for a total of 4,000MW of offshore wind power capacity, including projects under feasibility studies.

J-Power set up a renewable energy division in June to look for opportunities to expand into wind and geothermal energy in Japan, and efforts like a Japan hydrogen energy system are emerging to support decarbonization. Kansai Electric also seeks know-how for increasing its reliance on renewable energy, even as it hurries to restart idled nuclear reactors.

They are not the only Japanese investors is in this field. In Asia, trading house Marubeni will invest in a Taiwanese venture with plans for a 600MW offshore wind farm.


Related News

Related News

From smart meters to big batteries, co-ops emerge as clean grid laboratories

Minnesota Electric Cooperatives are driving grid innovation with smart meters, time-of-use pricing, demand response, and energy storage, including iron-air batteries, to manage peak loads, integrate wind and solar, and cut costs for rural members.


Key Points

Member-owned utilities piloting load management, meters, and storage to integrate wind and solar, cutting peak demand.

✅ Time-of-use pricing pilots lower bills and shift peak load.

✅ Iron-air battery tests add multi-day, low-cost energy storage.

✅ Smart meters enable demand response across rural co-ops.


Minnesota electric cooperatives have quietly emerged as laboratories for clean grid innovation, outpacing investor-owned utilities on smart meter installations, time-based pricing pilots, and experimental battery storage solutions.

“Co-ops have innovation in their DNA,” said David Ranallo, a spokesperson for Great River Energy, a generation and distribution cooperative that supplies power to 28 member utilities — making it one of the state’s largest co-op players.

Minnesota farmers helped pioneer the electric co-op model more than a century ago, similar to modern community-generated green electricity initiatives, pooling resources to build power lines, transformers and other equipment to deliver power to rural parts of the state. Today, 44 member-owned electric co-ops serve about 1.7 million rural and suburban customers and supply almost a quarter of the state’s electricity.

Co-op utilities have by many measures lagged on clean energy. Many still rely on electricity from coal-fired power plants. They’ve used political clout with rural lawmakers to oppose new pollution regulations and climate legislation, and some have tried to levy steep fees on customers who install solar panels.

Where they are emerging as innovators is with new models and technology for managing electric grid loads — from load-shifting water heaters to a giant experimental battery made of iron. The programs are saving customers money by delaying the need for expensive new infrastructure, and also showing ways to unlock more value from cheap but variable wind and solar power.

Unlike investor-owned utilities, “we have no incentive to invest in new generation,” said Darrick Moe, executive director of the Minnesota Rural Electric Association. Curbing peak energy demand has a direct financial benefit for members.

Minnesota electric cooperatives have launched dozens of programs, such as the South Metro solar project, in recent years aimed at reducing energy use and peak loads, in particular. They include:

Cost calculations are the primary driver for electric cooperatives’ recent experimentation, and a lighter regulatory structure and evolving electricity market reforms have allowed them to act more quickly than for-profit utilities.

“Co-ops and [municipal utilities] can act a lot more nimbly compared to investor-owned utilities … which have to go through years of proceedings and discussions about cost-recovery,” said Gabe Chan, a University of Minnesota associate professor who has researched electric co-ops extensively. Often, approval from a local board is all that’s required to launch a venture.

Great River Energy’s programs, which are rebranded and sold through member co-ops, yielded more than 101 million kilowatt-hours of savings last year — enough to power 9,500 homes for a year.

Beyond lowering costs for participants and customers at large, the energy-saving and behavior-changing programs sometimes end up being cited as case studies by larger utilities considering similar offerings. Advocates supporting a proposal by the city of Minneapolis and CenterPoint Energy to allow residents to pay for energy efficiency improvements on their utility bills through distributed energy rebates used several examples from cooperatives.

Despite the pace of innovation on load management, electric cooperatives have been relatively slow to transition from coal-fired power. More than half of Great River Energy’s electricity came from coal last year, and Dairyland Power, another major power wholesaler for Minnesota co-ops, generated 70% of its energy from coal. Meanwhile, Xcel Energy, the state’s largest investor-owned utility, has already reduced coal to about 20% of its energy mix.

The transition to cleaner power for some co-ops has been slowed by long-term contracts with power suppliers that have locked them into dirty power. Others have also been stalled by management or boards that have been resistant to change. John Farrell, director of the Institute for Local Self-Reliance’s Energy Democracy program, said generalizing co-ops is difficult. 

“We’ve seen some co-ops that have got 75-year contracts for coal, that are invested in coal mines and using their newsletter to deny climate change,” he said. “Then you see a lot of them doing really amazing things like creating energy storage systems … and load balancing [programs], because they are unique and locally managed and can have that freedom to experiment without having to go through a regulatory process.”

Great River Energy, for its part, says it intends to reach 54% renewable generation by 2025, while some communities, like Frisco, Colorado, are targeting 100% clean electricity by specific dates. Its members recently voted to sell North Dakota’s largest coal plant, but the arrangement involves members continuing to buy power from the new owners for another decade.

The cooperative’s path to clean power could become clearer if its experimental iron-air battery project is successful. The project, the first of its kind in the country, is expected to be completed by 2023.


Related News

View more

Solar + Wind = 10% of US Electricity Generation in 1st Half of 2018

US Electricity Generation H1 2018 saw wind and solar gains but hydro declines, as natural gas led the grid mix and coal fell; renewables' share, GWh, emissions, and capacity additions shaped the power sector.


Key Points

It is the H1 2018 US power mix, where natural gas led, coal declined, and wind and solar grew while hydro fell.

✅ Natural gas reached 32% of generation, highest share

✅ Coal fell; renewables roughly tied nuclear at ~20%

✅ Wind and solar up; hydro output down vs 2017


To complement our revival of US electricity capacity reports, here’s a revival of our reports on US electricity generation.

As with the fresh new capacity report, things are not looking too bright when it comes to electricity generation. There’s still a lot of grey — in the bar charts below, in the skies near fossil fuel power plants, and in the human and planetary outlook based on how slowly we are cutting fossil fuel electricity generation.

As you can see in the charts above, wind and solar energy generation increased notably from the first half of 2017 to the first half of 2018, and the EIA expected larger summer solar and wind generation in subsequent months, reinforcing that momentum.

A large positive when it comes to the environment and human health is that coal generation dropped a great deal year over year — by even more than renewables increased, though the EIA later noted an increase in coal-fired generation in a subsequent year, complicating the trend. However, on the down side, natural gas soared as it became the #1 source of electricity generation in the United States (32% of US electricity). Furthermore, coal was still solidly in the #2 position (27% of US electricity). Renewables and nuclear were essentially in a tie at 19.8% of generation, with renewables just a tad above nuclear.

Actually, combined with an increase in nuclear power generation, natural gas electricity production increased so much that the renewable energy share of electricity generation actually dropped in the first half of 2018 versus the first half of 2017, even amid declining electricity use in some periods. It was 19.8% this year and 20% last year.

Again, solar and wind saw a significant growth in its market share, from 9% to 9.9%, but hydro brought the whole category down due to a decrease from 9% to 8%.

The visuals above are probably the best way to examine it all. The H1 2018 chart was still dominated by fossil fuels, which together accounted for approximately 60% of electricity generation, even though by 2021 non-fossil sources supplied about 40% of U.S. electricity, highlighting the longer-term shift. In H1 2017, the figure was 59.7%. Furthermore, if you switch to the “Change H1 2018 vs H1 2017 (GWh)” chart, you can watch a giant grey bar representing natural gas take over the top of the chart. It almost looks like it’s part of the border of the chart. The biggest glimmer of positivity in that chart is seeing the decline in coal at the bottom.

What will the second half of the year bring? Well, the gigantic US electricity generation market shifts slowly, even as monthly figures can swing, as January generation jumped 9.3% year over year according to the EIA, reminding us about volatility. There is so much base capacity, and power plants last so long, that it takes a special kind of magic to create a rapid transition to renewable energy. As you know from reading this quarter’s US renewable energy capacity report, only 43% of new US power capacity in the first half of the year was from renewables. The majority of it was from natural gas. Along with other portions of the calculation, that means that electricity generation from natural gas is likely to increase more than electricity generation from renewables.

Jump into the numbers below and let us know if you have any more thoughts.


Related News

View more

Global CO2 emissions 'flatlined' in 2019, says IEA

2019 Global CO2 Emissions stayed flat, IEA reports, as renewable energy growth, wind and solar deployment, nuclear output, and coal-to-gas switching in advanced economies offset increases elsewhere, supporting climate goals and clean energy transitions.


Key Points

33 gigatonnes, unchanged YoY, as advanced economies cut power emissions via renewables, gas, and nuclear.

✅ IEA reports emissions flat at 33 Gt despite 2.9% GDP growth

✅ Advanced economies cut power-sector CO2 via wind, solar, gas

✅ Nuclear restarts and mild weather aided reductions


Despite widespread expectations of another increase, global energy-related CO2 emissions stopped growing in 2019, according to International Energy Agency (IEA) data released today. After two years of growth, global emissions were unchanged at 33 gigatonnes in 2019, a notable marker in the global energy transition narrative even as the world economy expanded by 2.9%.

This was primarily due to declining emissions from electricity generation in advanced economies, thanks to the expanding role of renewable sources (mainly wind and solar across many markets), fuel switching from coal to natural gas, and higher nuclear power generation, the Paris-based organisation says in the report.

"We now need to work hard to make sure that 2019 is remembered as a definitive peak in global emissions, not just another pause in growth," said Fatih Birol, the IEA's executive director. "We have the energy technologies to do this, and we have to make use of them all."

Higher nuclear power generation in advanced economies, particularly in Japan and South Korea, avoided over 50 Mt of CO2 emissions. Other factors included milder weather in several countries, and slower economic growth in some emerging markets. In China, emissions rose but were tempered by slower economic growth and higher output from low-carbon sources of electricity. Renewables continued to expand in China, and 2019 was also the first full year of operation for seven large-scale nuclear reactors in the country.

A significant decrease in emissions in advanced economies in 2019 offset continued growth elsewhere. The USA recorded the largest emissions decline on a country basis, with a fall of 140 million tonnes, or 2.9%. US emissions are now down by almost 1 gigatonne from their peak in 2000. Emissions in the European Union fell by 160 million tonnes, or 5%, in 2019 driven by reductions in the power sector as electricity producers move away from coal in the generation mix. Japan’s emissions fell by 45 million tonnes, or around 4%, the fastest pace of decline since 2009, as output from recently restarted nuclear reactors increased.

Emissions in the rest of the world grew by close to 400 million tonnes in 2019, with almost 80% of the increase coming from countries in Asia where coal-fired power generation continued to rise, and in Australia emissions rose 2% due to electricity and transport. Coal-fired power generation in advanced economies declined by nearly 15%, reflecting a sharp fall in coal-fired electricity across multiple markets, as a result of growth in renewables, coal-to-gas switching, a rise in nuclear power and weaker electricity demand.

The IEA will publish a World Energy Outlook Special Report in June that will map out how to cut global energy-related carbon emissions by one-third by 2030 and put the world on track for longer-term climate goals, a pathway that, in Canada, will require more electricity to hit net-zero. It will also hold an IEA Clean Energy Transitions Summit in Paris on 9 July, bringing together key government ministers, CEOs, investors and other major stakeholders.

Birol will discuss the results published today tomorrow at an IEA Speaker Series event at its headquarters with energy and climate ministers from Poland, which hosted COP24 in Katowice; Spain, which hosted COP25 in Madrid; and the UK, which will host COP26 in Glasgow this year, as greenhouse gas concentrations continue to break records worldwide.


Related News

View more

Daimler Details Gigantic Scope of Its Electrification Plan

Daimler Electric Strategy drives EV adoption with global battery factories, Mercedes-Benz electrified models, battery cells procurement, and major investments spanning vans, buses, trucks, and production capacity across Europe, Asia, and the USA.


Key Points

Daimler Electric Strategy is a multi-billion EV roadmap for batteries, factories, and 130 electrified Mercedes models.

✅ Eight battery factories across three continents

✅ EUR 10B for EV lineup; EUR 20B for battery cells

✅ 130 electrified variants plus vans, buses, trucks


Throughout 2018, we all witnessed the unprecedented volume of promises for a better future made by the giants of the auto industry. All say they've committed billions so that, within a decade, combustion engines will be on their way out.

The most active of all companies when talking about promises is Volkswagen, which, amid German plant closures, time and time again has said it will do this or that and completely change the meaning of car in the coming years. But there are other planning the same thing, possibly with even vaster resources.

Planning to end the year on a high note, Daimler detailed its plan for the electric future once again on Tuesday, this time making no secret of its gigantic size and scope.

As announced before, Daimler plans to build electric cars, but also manufacture electric batteries for its own and others’ use, and has launched a US energy storage company to support this strategy. These batteries will eventually be produced by Daimler in eight factories on three continents.

Batteries are already rolling off the lines in Kamenz, and a second facility will begin doing so next year. Two more factories will be built in Stuttgart-Untertürkheim, one at the company’s Sindelfingen site, and one each at the sites in Beijing (China), Bangkok (Thailand) and Tuscaloosa (USA).

In all, one billion EUR will be invested in the expansion of the global battery production network, but that is nothing compared to the 10 billion to be poured into the expansion of the Mercedes-Benz car fleet.

On top of that, 20 billion EUR will go towards the purchase of battery cells from producers all around the world, echoing other automakers' battery sourcing strategies worldwide over the next 12 years.

“After investing billions of euros in the development of the electric fleet and the expansion of our global battery network, we are now taking the next step,” said in a statement Dieter Zetsche, Daimler chairman of the board.

“With the purchase of battery cells for more than 20 billion euros, we are systematically pushing forward with the transformation into the electric future of our company.”

By 2022, the carmaker plans to launch 130 electrified variants of its cars, as cheaper, more powerful batteries become available, adding to them electric vans, buses and trucks. That pretty much means all the models and variants sold by Daimler globally will be at least partially powered by electricity.


Related News

View more

Power grab: 5 arrested after Hydro-Québec busts electricity theft ring

Hydro-Qubec Electricity Theft Ring exposed after a utility investigation into identity theft, rental property fraud, and conspiracies using stolen customer data; arrests, charges, and a tip line highlight ongoing enforcement.


Key Points

A five-year identity-theft scheme defrauding Hydro-Qubec through utility accounts leading to arrests and fraud charges.

✅ Five arrests; 25 counts: fraud, conspiracy, identity theft

✅ Losses up to $300,000 in electricity, 2014-2019

✅ Tip line: 1-877-816-1212 for suspected Hydro-Qubec fraud


Five people have been arrested in connection with an electricity theft ring alleged to have operated for five years, a pattern seen in India electricity theft arrests as well.

The thefts were allegedly committed by the owners of rental properties who used stolen personal information to create accounts with Hydro-Québec, which also recently dealt with a manhole fire outage affecting thousands.

The utility alleges that between 2014 and 2019, Mario Brousseau, Simon Brousseau-Ouellette and their accomplices defrauded Hydro-Québec of up to $300,000 worth of electricity, highlighting concerns about consumption trends as residential electricity use rose during the pandemic. It was impossible for Hydro-Québec’s customer service section to detect the fraud because the information on the accounts, while stolen, was also genuine, even as the utility reported pandemic-related losses later on.

The suspects are expected to face 25 counts of fraud, conspiracy and identity theft, issues that Ontario utilities warn about regularly.

Hydro-Québec noted the thefts were detected through an investigation by the utility into 10 fraud cases, a process that can lead to retroactive charges for affected accounts.

Anyone concerned that a fraud is being committed against Hydro-Québec, or wary of scammers threatening shutoffs, is urged to call 1-877-816-1212.


Related News

View more

Potent greenhouse gas declines in the US, confirming success of control efforts

US SF6 Emissions Decline as NOAA analysis and EPA mitigation show progress, with atmospheric measurements and Greenhouse Gas Reporting verifying reductions from the electric power grid; sulfur hexafluoride's extreme global warming potential underscores inventory improvements.


Key Points

A documented drop in US sulfur hexafluoride emissions, confirmed by NOAA atmospheric data and EPA reporting reforms.

✅ NOAA towers and aircraft show 2007-2018 decline

✅ EPA reporting and utility mitigation narrowed inventory gaps

✅ Winter leaks and servicing signal further reduction options


A new NOAA analysis shows U.S. emissions of the super-potent greenhouse gas sulfur hexafluoride (SF6) have declined between 2007-2018, likely due to successful mitigation efforts by the Environmental Protection Agency (EPA) and the electric power industry, with attention to SF6 in the power industry across global markets. 

At the same time, significant disparities that existed previously between NOAA’s estimates, which are based on atmospheric measurements, and EPA’s estimates, which are based on a combination of reported emissions and industrial activity, have narrowed following the establishment of the EPA's Greenhouse Gas Reporting Program. The findings, published in the journal Atmospheric Chemistry and Physics, also suggest how additional emissions reductions might be achieved. 

SF6 is most commonly used as an electrical insulator in high-voltage equipment that transmits and distributes electricity, and its emissions have been increasing worldwide as electric power systems expand, even as regions hit milestones like California clean energy surpluses in recent years. Smaller amounts of SF6 are used in semiconductor manufacturing and in magnesium production. 

SF6 traps 25,000 times more heat than carbon dioxide over a 100-year time scale for equal amounts of emissions, and while CO2 emissions flatlined in 2019 globally, that comparison underscores the potency of SF6. That means a relatively small amount of the gas can have a significant impact on climate warming. Because of its extremely large global warming potential and long atmospheric lifetime, SF6 emissions will influence Earth’s climate for thousands of years.

In this study, researchers from NOAA’s Global Monitoring Laboratory, as record greenhouse gas concentrations drive demand for better data, working with colleagues at EPA, CIRES, and the University of Maryland, estimated U.S. SF6 emissions for the first time from atmospheric measurements collected at a network of tall towers and aircraft in NOAA’s Global Greenhouse Gas Reference Network. The researchers provided an estimate of SF6 emissions independent from the EPA’s estimate, which is based on reported SF6 emissions for some industrial facilities and on estimated SF6 emissions for others.

“We observed differences between our atmospheric estimates and the EPA’s activity-based estimates,” said study lead author Lei Hu, a Global Monitoring Laboratory researcher who was a CIRES scientist at the time of the study. “But by closely collaborating with the EPA, we were able to identify processes potentially responsible for a significant portion of this difference, highlighting ways to improve emission inventories and suggesting additional emission mitigation opportunities, such as forthcoming EPA carbon capture rules for power plants, in the future.” 

In the 1990s, the EPA launched voluntary partnerships with the electric power, where power-sector carbon emissions are falling as generation shifts, magnesium, and semiconductor industries to reduce SF6 emissions after the United States recognized that its emissions were significant. In 2011, large SF6 -emitting facilities were required to begin tracking and reporting their emissions under the EPA Greenhouse Gas Reporting Program. 

Hu and her colleagues documented a decline of about 60 percent in U.S. SF6 emissions between 2007-2018, amid global declines in coal-fired power in some years—equivalent to a reduction of between 6 and 20 million metric tons of CO2 emissions during that time period—likely due in part to the voluntary emission reduction partnerships and the EPA reporting requirement. A more modest declining trend has also been reported in the EPA’s national inventories submitted annually under the United Nations Framework Convention on Climate Change. 

Examining the differences between the NOAA and EPA independent estimates, the researchers found that the EPA’s past inventory analyses likely underestimated SF6 emissions from electrical power transmission and distribution facilities, and from a single SF6 production plant in Illinois. According to Hu, the research collaboration has likely improved the accuracy of the EPA inventories. The 2023 draft of the EPA’s U.S. Greenhouse Gas Emissions and Sinks: 1990-2021 used the results of this study to support revisions to its estimates of SF6 emissions from electrical transmission and distribution. 

The collaboration may also lead to improvements in the atmosphere-based estimates, helping NOAA identify how to expand or rework its network to better capture emitting industries or areas with significant emissions, according to Steve Montzka, senior scientist at GML and one of the paper’s authors.

Hu and her colleagues also found a seasonal variation in SF6 emissions from the atmosphere-based analysis, with higher emissions in winter than in summer. Industry representatives identified increased servicing of electrical power equipment in the southern states and leakage from aging brittle sealing materials in the equipment in northern states during winter as likely explanations for the enhanced wintertime emissions—findings that suggest opportunities for further emissions reductions.

“This is a great example of the future of greenhouse gas emission tracking, where inventory compilers and atmospheric scientists work together to better understand emissions and shed light on ways to further reduce them,” said Montzka.


Related News

View more

Sign Up for Electricity Forum’s Newsletter

Stay informed with our FREE Newsletter — get the latest news, breakthrough technologies, and expert insights, delivered straight to your inbox.

Electricity Today T&D Magazine Subscribe for FREE

Stay informed with the latest T&D policies and technologies.
  • Timely insights from industry experts
  • Practical solutions T&D engineers
  • Free access to every issue

Download the 2025 Electrical Training Catalog

Explore 50+ live, expert-led electrical training courses –

  • Interactive
  • Flexible
  • CEU-cerified