Nuclear island excavation begins for foundation

By Industrial Info Resources


Protective Relay Training - Basic

Our customized live online or in‑person group training can be delivered to your staff at your location.

  • Live Online
  • 12 hours Instructor-led
  • Group Training Available
Regular Price:
$699
Coupon Price:
$599
Reserve Your Seat Today
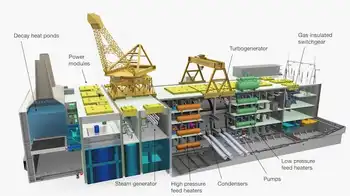
Foundation excavation of the nuclear island for the Tianwan Nuclear Power Plant expansion project kicked off recently, following the consent of the National Development and Reform Commission in July to begin pre-stage preparation for the Phase III expansion project on units 5 and 6.

Foundation excavation is an important node in nuclear island construction. The foundation excavation for the expansion project is performed by China Nuclear Industry Nanjing Construction Group Company Limited. As reported, foundation excavation takes place before the Primary Schedule for units 5 and 6 of Tianwan Nuclear Power Expansion Project, which paves a firm foundation to proceed as scheduled.

Tianwan Nuclear Power Plant has a total planned capacity of eight units of 1,000 megawatts (MW) each to be built in four phases, with two units in each phase. As the project owner, Jiangsu Nuclear Power Company Limited (JNPC), jointly invested by China National Nuclear Corporation (40%), China Power Investment Nuclear Power Company Limited (30%) and Jiangsu Guoxin Assets Management Corporation Limited (20%), is responsible for the construction and operation of the power plant.

Units 1 and 2 (Phase I), which are located at Tianwan Town in Lianyun District, Lianyungang City of East China's Jiangsu province, are furnished with two AES-91 pressurized water reactor-based nuclear power units imported from Russia. Both units were put into commercial operation in May and August 2007, respectively, through joint efforts from the Chinese and Russian counterparts.

In November 2007, China and Russia signed the cooperation agreement for the two units in Phase II. According to the agreement, Russia's AtomStroyExport (ASE) will submit the technical and commercial proposal on equipment supply and service for the Phase II project. Construction of the Phase II project was kicked off in October 2009.

On November 6, JNPC and ASE signed the Framework Agreement on Cooperation Construction of Tianwan Nuclear Power Plant Expansion Project again. The Phase III project is located northwest of Phase I, and is scheduled to begin construction in October 2010.

Related News

Potent greenhouse gas declines in the US, confirming success of control efforts

US SF6 Emissions Decline as NOAA analysis and EPA mitigation show progress, with atmospheric measurements and Greenhouse Gas Reporting verifying reductions from the electric power grid; sulfur hexafluoride's extreme global warming potential underscores inventory improvements.


Key Points

A documented drop in US sulfur hexafluoride emissions, confirmed by NOAA atmospheric data and EPA reporting reforms.

✅ NOAA towers and aircraft show 2007-2018 decline

✅ EPA reporting and utility mitigation narrowed inventory gaps

✅ Winter leaks and servicing signal further reduction options


A new NOAA analysis shows U.S. emissions of the super-potent greenhouse gas sulfur hexafluoride (SF6) have declined between 2007-2018, likely due to successful mitigation efforts by the Environmental Protection Agency (EPA) and the electric power industry, with attention to SF6 in the power industry across global markets. 

At the same time, significant disparities that existed previously between NOAA’s estimates, which are based on atmospheric measurements, and EPA’s estimates, which are based on a combination of reported emissions and industrial activity, have narrowed following the establishment of the EPA's Greenhouse Gas Reporting Program. The findings, published in the journal Atmospheric Chemistry and Physics, also suggest how additional emissions reductions might be achieved. 

SF6 is most commonly used as an electrical insulator in high-voltage equipment that transmits and distributes electricity, and its emissions have been increasing worldwide as electric power systems expand, even as regions hit milestones like California clean energy surpluses in recent years. Smaller amounts of SF6 are used in semiconductor manufacturing and in magnesium production. 

SF6 traps 25,000 times more heat than carbon dioxide over a 100-year time scale for equal amounts of emissions, and while CO2 emissions flatlined in 2019 globally, that comparison underscores the potency of SF6. That means a relatively small amount of the gas can have a significant impact on climate warming. Because of its extremely large global warming potential and long atmospheric lifetime, SF6 emissions will influence Earth’s climate for thousands of years.

In this study, researchers from NOAA’s Global Monitoring Laboratory, as record greenhouse gas concentrations drive demand for better data, working with colleagues at EPA, CIRES, and the University of Maryland, estimated U.S. SF6 emissions for the first time from atmospheric measurements collected at a network of tall towers and aircraft in NOAA’s Global Greenhouse Gas Reference Network. The researchers provided an estimate of SF6 emissions independent from the EPA’s estimate, which is based on reported SF6 emissions for some industrial facilities and on estimated SF6 emissions for others.

“We observed differences between our atmospheric estimates and the EPA’s activity-based estimates,” said study lead author Lei Hu, a Global Monitoring Laboratory researcher who was a CIRES scientist at the time of the study. “But by closely collaborating with the EPA, we were able to identify processes potentially responsible for a significant portion of this difference, highlighting ways to improve emission inventories and suggesting additional emission mitigation opportunities, such as forthcoming EPA carbon capture rules for power plants, in the future.” 

In the 1990s, the EPA launched voluntary partnerships with the electric power, where power-sector carbon emissions are falling as generation shifts, magnesium, and semiconductor industries to reduce SF6 emissions after the United States recognized that its emissions were significant. In 2011, large SF6 -emitting facilities were required to begin tracking and reporting their emissions under the EPA Greenhouse Gas Reporting Program. 

Hu and her colleagues documented a decline of about 60 percent in U.S. SF6 emissions between 2007-2018, amid global declines in coal-fired power in some years—equivalent to a reduction of between 6 and 20 million metric tons of CO2 emissions during that time period—likely due in part to the voluntary emission reduction partnerships and the EPA reporting requirement. A more modest declining trend has also been reported in the EPA’s national inventories submitted annually under the United Nations Framework Convention on Climate Change. 

Examining the differences between the NOAA and EPA independent estimates, the researchers found that the EPA’s past inventory analyses likely underestimated SF6 emissions from electrical power transmission and distribution facilities, and from a single SF6 production plant in Illinois. According to Hu, the research collaboration has likely improved the accuracy of the EPA inventories. The 2023 draft of the EPA’s U.S. Greenhouse Gas Emissions and Sinks: 1990-2021 used the results of this study to support revisions to its estimates of SF6 emissions from electrical transmission and distribution. 

The collaboration may also lead to improvements in the atmosphere-based estimates, helping NOAA identify how to expand or rework its network to better capture emitting industries or areas with significant emissions, according to Steve Montzka, senior scientist at GML and one of the paper’s authors.

Hu and her colleagues also found a seasonal variation in SF6 emissions from the atmosphere-based analysis, with higher emissions in winter than in summer. Industry representatives identified increased servicing of electrical power equipment in the southern states and leakage from aging brittle sealing materials in the equipment in northern states during winter as likely explanations for the enhanced wintertime emissions—findings that suggest opportunities for further emissions reductions.

“This is a great example of the future of greenhouse gas emission tracking, where inventory compilers and atmospheric scientists work together to better understand emissions and shed light on ways to further reduce them,” said Montzka.


Related News

View more

Opinion: UK Natural Gas, Rising Prices and Electricity

European Energy Market Crisis drives record natural gas and electricity prices across the EU, as LNG supply constraints, Russian pipeline dependence, marginal pricing, and renewables integration expose volatility in liberalised power markets.


Key Points

A 2021 surge in European gas and electricity prices from supply strains, demand rebounds, and marginal pricing exposure.

✅ Record TTF gas and day-ahead power prices across Europe

✅ LNG constraints and Russian pipeline dependence tightened supply

✅ Debate over marginal pricing vs regulated models intensifies


By Ronan Bolton

The year 2021 was a turbulent one for energy markets across Europe, as Europe's energy nightmare deepened across the region. Skyrocketing natural gas prices have created a sense of crisis and will lead to cost-of-living problems for many households, as wholesale costs feed through into retail prices for gas and electricity over the coming months.

This has created immediate challenges for governments, but it should also encourage us to rethink the fundamental design of our energy markets as we seek to transition to net zero, with many viewing it as a wake-up call to ditch fossil fuels across the bloc.

This energy crisis was driven by a combination of factors: the relaxation of Covid-19 lockdowns across Europe created a surge in demand, while cold weather early in the year diminished storage levels and contributed to increasing demand from Asian economies. A number of technical issues and supply-side constraints also combined to limit imports of liquefied natural gas (LNG) into the continent.

Europe’s reliance on pipeline imports from Russia has once again been called into question, as Gazprom has refused to ride to the rescue, only fulfilling its pre-existing contracts. The combination of these, and other, factors resulted in record prices – the European benchmark price (the Dutch TTF Gas Futures Contract) reached almost €180/MWh on 21 December, with average day-ahead electricity prices exceeding €300/MWh across much of the continent in the following days.

Countries which rely heavily on natural gas as a source of electricity generation have been particularly exposed, with governments quickly put under pressure to intervene in the market.

In Spain the government and large energy companies have clashed over a proposed windfall tax on power producers. In Ireland, where wind and gas meet much of the country’s surging electricity demand, the government is proposing a €100 rebate for all domestic energy consumers in early 2022; while the UK government is currently negotiating a sector-wide bailout of the energy supply sector and considering ending the gas-electricity price link to curb bills.

This follows the collapse of a number of suppliers who had based their business models on attracting customers with low prices by buying cheap on the spot market. The rising wholesale prices, combined with the retail price cap previously introduced by the Theresa May government, led to their collapse.

While individual governments have little control over prices in an increasingly globalised and interconnected natural gas market, they can exert influence over electricity prices as these markets remain largely national and strongly influenced by domestic policy and regulation. Arising from this, the intersection of gas and power markets has become a key site of contestation and comment about the role of government in mitigating the impacts on consumers of rising fuel bills, even as several EU states oppose major reforms amid the price spike.

Given that renewables are constituting an ever-greater share of production capacity, many are now questioning why gas prices play such a determining role in electricity markets.

As I outline in my forthcoming book, Making Energy Markets, a particular feature of the ‘European model’ of liberalised electricity trade since the 1990s has been a reliance on spot markets to improve the efficiency of electricity systems. The idea was that high marginal prices – often set by expensive-to-run gas peaking plants – would signal when capacity limits are reached, providing clear incentives to consumers to reduce or delay demand at these peak periods.

This, in theory, would lead to an overall more efficient system, and in the long run, if average prices exceeded the costs of entering the market, new investments would be made, thus pushing the more expensive and inefficient plants off the system.

The free-market model became established during a more stable era when domestically-sourced coal, along with gas purchased on long-term contracts from European sources (the North Sea and the Netherlands), constituted a much greater proportion of electricity generation.

While prices fluctuated, they were within a somewhat predictable range, and provided a stable benchmark for the long-term contracts underpinning investment decisions. This is no longer the case as energy markets become increasingly volatile and disrupted during the energy transition.

The idea that free price formation in a competitive market, with governments standing back, would benefit electricity consumers and lead to more efficient systems was rooted in sound economic theory, and is the basis on which other major commodity markets, such as metals and agricultural crops, have been organised for decades.

The free-market model applied to electricity had clear limitations, however, as the majority of domestic consumers have not been exposed directly to real-time price signals. While this is changing with the roll-out of smart meters in many countries, the extent to which the average consumer will be willing or able to reduce demand in a predicable way during peak periods remains uncertain.

Also, experience shows that governments often come under pressure to intervene in markets if prices rise sharply during periods of scarcity, thus undermining a basic tenet of the market model, with EU gas price cap strategies floated as one option.

Given that gas continues to play a crucial role in balancing supply and demand for electricity, the options available to governments are limited, illustrating why rolling back electricity prices is harder than it appears for policymakers. One approach would be would be to keep faith with the liberalised market model, with limited interventions to help consumers in the short term, while ultimately relying on innovations in demand side technologies and alternatives to gas as a means of balancing systems with high shares of variable renewables.

An alternative scenario may see a return to old style national pricing policies, involving a move away from marginal pricing and spot markets, even as the EU prepares to revamp its electricity market in response. In the past, in particular during the post-WWII decades, and until markets were liberalised in the 1990s, governments have taken such an approach, centrally determining prices based on the costs of delivering long term system plans. The operation of gas plants and fuel procurement would become a much more regulated activity under such a model.

Many argue that this ‘traditional model’ better suits a world in which governments have committed to long-term decarbonisation targets, and zero marginal cost sources, such as wind and solar, play a more dominant role in markets and begin to push down prices.

A crucial question for energy policy makers is how to exploit this deflationary effect of renewables and pass-on cost savings to consumers, whilst ensuring that the lights stay on.

Despite the promise of storage technologies such as grid-scale batteries and hydrogen produced from electrolysis, aside from highly polluting coal, no alternative to internationally sourced natural gas as a means of balancing electricity systems and ensuring our energy security is immediately available.

This fact, above all else, will constrain the ambitions of governments to fundamentally transform energy markets.

Ronan Bolton is Reader at the School of Social and Political Science, University of Edinburgh and Co-Director of the UK Energy Research Centre. His book Making Energy Markets: The Origins of Electricity Liberalisation in Europe is to be published by Palgrave Macmillan in 2022.


Related News

View more

Emissions rise 2% in Australia amid increased pollution from electricity and transport

Australia's greenhouse gas emissions rose in Q2 as electricity and transport pollution increased, despite renewable energy growth. Net zero targets, carbon dioxide equivalent metrics, and land use changes underscore mixed trends in decarbonisation.


Key Points

About 499-500 Mt CO2-e annually, with a 2% quarterly rise led by electricity and transport.

✅ Q2 emissions rose to 127 Mt from 124.4 Mt seasonally adjusted

✅ Electricity sector up to 41.6 Mt; transport added nearly 1 Mt

✅ Land use remains a net sink; renewables expanded capacity


Australia’s greenhouse gas emissions rose in the June quarter by about 2% as pollution from the electricity sector and transport increased.

Figures released on Tuesday by the Morrison government showed that on a year to year basis, emissions for the 12 months to last June totalled 498.9m tonnes of carbon dioxide equivalent. That tally was down 2.1%, or 10.8m tonnes compared with the same period a year earlier.

However, on a seasonally adjusted quarterly basis, emissions increased to 127m tonnes, or just over 2%, from the 124.4m tonnes reported in the March quarter. For the year to March, emissions totalled 494.2m tonnes, underscoring the pickup in pollution in the more recent quarter even as global coal power declines worldwide.

A stable pollution rate, if not a rising one, is also implied by the government’s release of preliminary figures for the September quarter. They point to 125m tonnes of emissions in trend terms for the July-September months, bringing the year to September total to about 500m tonnes, the latest report said.

The government has made much of Australia “meeting and beating” climate targets. However, the latest statistics show mostly emissions are not in decline despite its pledge ahead of the Glasgow climate summit that the country would hit net zero by 2050, and AEMO says supply can remain uninterrupted as coal phases out over the next three decades.

“Nothing’s happening except for the electricity sector,” said Hugh Saddler, an honorary associate professor at the Australian National University. Once Covid curbs on the economy eased, such as during the current quarter, emission sources such as from transport will show a rise, he predicted.

Falling costs for new wind and solar farms, with the IEA naming solar the cheapest in history worldwide, are pushing coal and gas out of electricity generation, as well as pushing down power prices. In seasonally adjusted terms, though, emissions for that sector rose from 39.7m tonnes the March quarter to 41.6m in the June one.

Most other sectors were steady, with pollution from transport adding almost 1m tonnes in the June quarter.

On an annual basis, a 500m tonnes tally is the lowest since records began in the 1990s, and IEA reported global emissions flatlined in 2019 for context. That lower trajectory, though, is lower due much to the land sector remaining a net sink even as some experts raise questions about the true trends when it comes to land clearing.

According to the government, this sector – known as land use, land-use change and forestry – amounted to a net reduction of emissions of 24.4m tonnes, or almost negative 5% of the national total, in the year to June.

Sign up to receive an email with the top stories from Guardian Australia every morning

“The magnitude of this net sink has decreased by 0.6% (0.2 Mt CO2-e) on the previous 12 months due to an increase in emissions from agricultural soils, partially offset by a continuing decline in land clearing emissions,” the latest report said.

For its part, the government also touted the increase of renewable energy, as seen in Canada's electricity progress too, as central to driving emissions lower.

“Since 2017, Australia’s consumption of renewable energy has grown at a compound annual rate of 4.6%, with more than $40bn invested in Australia’s renewable energy sector,” Angus Taylor, the federal energy minister said, while UK net zero policy changes show a different approach. “Last year, Australia deployed new solar and wind at eight times the global per capita average.”

ANU’s Saddler said the main driver had been the 2020 Renewable Energy Target that the Coalition government had cut, and had anyway been implemented “a very considerable time ago”.

Tim Baxter, the Climate Council’s senior researcher, said “the time for leaning on the achievements of others is long since past”.

“We need a federal government willing to step up on emissions reductions and take charge with real policy, not wishlists,” he said, referring to the government’s net zero plan to rely on technologies to cut pollution in pursuit of a sustainable electric planet in practice, some of which don’t exist now.


Related News

View more

Let’s make post-COVID Canada a manufacturing hub again

Canada Manufacturing Policy prioritizes affordable energy, trims carbon taxes, aligns with Buy America, and supports the resource sector, PPE and plastics supply, nearshoring, and resilient supply chains amid COVID-19, correcting costly green energy policies.


Key Points

A policy to boost industry with affordable energy, lower carbon taxes, resource ties, and aligned U.S. trade.

✅ Cuts energy costs and carbon tax burdens for competitiveness

✅ Rebuilds resource-sector linkages and domestic supply chains

✅ Seeks Buy America relief and clarity on plastics regulation


By Jocelyn Bamford

Since its inception in 2017, the Coalition of Concerned Manufacturers and Businesses has warned all levels of government that there would be catastrophic effects if policies that drove both the manufacturing and natural resources sectors out of the country were adopted.

The very origins of our coalition was in the fight for a competitive landscape in Ontario, a cornerstone of which is affordable energy and sounding the alarm that the Green Energy Policy in Ontario pushed many manufacturers out of the province.


The Green Energy Policy made electricity in Ontario four times the average North American rate. These unjust prices were largely there to subsidize the construction of expensive and inefficient wind and solar energy infrastructure, even as cleaning up Canada's grid is cited as critical to meeting climate pledges.

My company’s November hydro bill was $55,000 and $36,500 of that was the so-called global adjustment charge, the name given to these green energy costs.

Unaffordable electricity, illustrated by higher Alberta power costs in recent years, coupled with ever-more burdensome carbon taxes, have pushed Canadian manufacturing into the open arms of other countries that see the importance of affordable energy to attract business.

One can’t help but ask the question: If Canada had policies that attracted and maintained a robust manufacturing sector, would we be in the same situation with a lack of personal protective equipment and medical supplies for our front-line medical workers and our patients during this pandemic?  If our manufacturing sector wasn’t crippled by taxes and regulation, would it be more nimble and able to respond to a national emergency?

It seems that the federal government’s policies are designed to push manufacturing out, stifle our resource sector, and kill the very plastics industry that is so essential to keeping our front-line medical staff, patients, and citizens safe, even as the net-zero race accelerates federally.

As the federal government chased its obsession with a new green economy – a strange obsession given our country’s small contribution to global GHGs – including proposals for a fully renewable grid by 2030 advocated by some leaders, it has been blinded from the real threats to our country, threats that became very, very real with COVID-19.

After the pandemic has passed, the federal government must work to make Canada manufacturing and resource friendly again, recognizing that the IEA net-zero electricity report projects the need for more power. COVID-19 proves that Canada relies on a robust resource economy and manufacturing sector to survive. We need to ensure that we are prepared for future crises like the one we are facing now.

Here are five things our government can do now to meet that end:

1. End all carbon taxes immediately.

2. Create a mandate to bring manufacturing back to Canada through competitive offerings and favourable tax regimes.

3. Recognize the interconnections between the resource sector and manufacturing, including how fossil-fuel workers support the transition across supply chains. Many manufacturers supply parts and pieces to the resource sector, and they rely on affordable energy to compete globally.

4. Stop the current federal government initiative to label plastic as toxic. At a time when the government is appealing to manufacturers to re-tool and produce needed plastic products for the health care sector, labelling plastics as toxic is counterproductive.

5. Work to secure a Canadian exemption to Buy America. This crisis has clearly shown us that dependency on China is dangerous. We must forge closer ties with America and work as a trading block in order to be more self-sufficient.

These are troubling times. Many businesses will not survive.

We need to take back our manufacturing sector.  We need to take back our resource sector.

We need to understand the interconnected nature of these two important segments of our gross domestic production, and opportunities like an Alberta–B.C. grid link to strengthen reliability.
If we do not, in the next pandemic we may find ourselves not only without ventilators, masks and gowns but also without energy to operate our hospitals.

Jocelyn Bamford is a Toronto business executive and President of the Coalition of Concerned Manufacturers and Businesses of Canada


Related News

View more

Portsmouth residents voice concerns over noise, flicker generated by turbine

Portsmouth Wind Turbine Complaints highlight noise, shadow flicker, resident impacts, Town Council hearings, and Green Development mitigation plans near Portsmouth High School, covering renewable energy output, PPAs, and community compliance.


Key Points

Resident reports of noise and shadow flicker near Portsmouth High School, prompting review and mitigation efforts.

✅ Noise exceeds ambient levels seasonally, residents report fatigue.

✅ Shadow flicker lasts up to 90 minutes on affected homes.

✅ Town tasks developer to meet neighbors and propose mitigation.


The combination of the noise and shadows generated by the town’s wind turbine has rankled some neighbors who voiced their frustration to the Town Council during its meeting Monday.

Mark DePasquale, the founder and chairman of the company that owns the turbine, tried to reassure them with promises to address the bothersome conditions.

David Souza, a lifelong town resident who lives on Lowell Drive, showed videos of the repeated, flashing shadows cast on his home by the three blades spinning.

“I am a firefighter. I need to get my sleep,” he said. “And now it’s starting to affect my job. I’m tired.”

Town Council President Keith Hamilton tasked DePasquale with meeting with the neighbors and returning with an update in a month. “What I do need you to do, Mr. DePasquale, is to follow through with all these people.”

DePasquale said he was unaware of the flurry of complaints lodged by the residents Monday. His company had only heard of one complaint. “If I knew there was an issue before tonight, we would have responded,” he said.

His company, Green Development LLC, formerly Wind Energy Development LLC, installed the 279-foot-tall turbine near Portsmouth High School that started running in August 2016, as offshore developers like Deepwater Wind in Massachusetts plan major construction nearby. It replaced another turbine installed by a separate company that broke down in 2012.

In November 2014, the town signed an agreement with Wind Energy Development to take down the existing turbine, pay off the remaining $1.45 million of the bond the town took out to install it and put up a new turbine, amid broader legal debates like the Cornwall wind farm ruling that can affect project timelines.

In exchange, Wind Energy Development sells a portion of the energy generated by the turbine to the town at a rate of 15.5 cents per kilowatt hour for 25 years. Some of the energy generated is sold to the town of Coventry.

“We took down (the old turbine) and paid off the debt,” DePasquale said, noting that cancellations can carry high costs as seen in Ontario wind project penalties for scrapping projects. “I have no problem doing whatever the council wants … There was an economic decision made to pay off the bond and build something better.”

The turbine was on pace to produce 4 million-plus kilowatt hours per year, Michelle Carpenter, the chief operating officer of Wind Energy Development, said last April. It generates enough energy to power all municipal and school buildings in town, she said, while places like Summerside’s wind power show similarly strong output.

The constant stream of shadows cast on certain homes in the area can last for as long as an hour-and-a-half, according to Souza. “We shouldn’t have to put up with this,” he said.

Sprague Street resident John Vegas said the turbine’s noise, especially in late August, is louder than the neighborhood’s ambient noise.

“Throughout the summer, there’s almost no flicker, but this time of year it’s very prominent,” Vegas added. “It can be every day.”

He mentioned neighbors needed to be better organized to get results.

“When the residents purchased our properties we did not have this wind turbine in our backyard,” Souza said in a memo. “Due to the wind turbine … our quality of life has suffered.”

After the discussion, the council unanimously voted to allow Green Development to sublease excess energy to the Rhode Island Convention Center Authority, a similar agreement to the one the company struck with Coventry, as regional New England solar growth adds pressure on grid upgrade planning.

“This has to be a sustainable solution,” DePasquale said. “We will work together with the town on a solution.”


Related News

View more

This kite could harness more of the world's wind energy

Autonomous Energy Kites harness offshore wind on floating platforms, using carbon fiber wings, tethers, and rotors to generate grid electricity; an airborne wind energy solution backed by Alphabet's Makani to cut turbine costs.


Key Points

Autonomous Energy Kites are tethered craft that capture winds with rotors, generating grid power from floating platforms.

✅ Flies circles on tethers; rotors drive generators to feed the grid.

✅ Operates over deep-sea winds where fixed turbines are impractical.

✅ Lighter, less visual impact, and lower installation costs offshore.


One company's self-flying energy kite may be the answer to increasing wind power around the world, alongside emerging wave power solutions as well.

California-based Makani -- which is owned by Google's parent company, Alphabet -- is using power from the strongest winds found out in the middle of the ocean, where the offshore wind sector has huge potential, typically in spots where it's a challenge to install traditional wind turbines. Makani hopes to create electricity to power communities across the world.

Despite a growing number of wind farms in the United States and the potential of this energy source, lessons from the U.K. underscore how to scale, yet only 6% of the world's electricity comes from wind due to the the difficulty of setting up and maintaining turbines, according to the World Wind Energy Association.

When the company's co-founders, who were fond of kiteboarding, realized deep-sea winds were largely untapped, they sought to make that energy more accessible. So they built an autonomous kite, which looks like an airplane tethered to a base, to install on a floating platform in water, as part of broader efforts to harness oceans and rivers for power across regions. Tests are currently underway off the coast of Norway.

"There are many areas around the world that really don't have a good resource for renewable power but do have offshore wind resources," Makani CEO Fort Felker told Rachel Crane, CNN's innovation correspondent. "Our lightweight kites create the possibility that we could tap that resource very economically and bring renewable power to hundreds of millions of people."

This technology is more cost-efficient than a traditional wind turbine, which is a lot more labor intensive and would require lots of machinery and installation.

The lightweight kite, which is made of carbon fiber, has an 85-foot wingspan. The kite launches from a base station and is constrained by a 1,400-foot tether as it flies autonomously in circles with guidance from computers. Crosswinds spin the kite's eight rotors to move a generator that produces electricity that's sent back to the grid through the tether.

The kites are still in the prototype phase and aren't flown constantly right now as researchers continue to develop the technology. But Makani hopes the kites will one day fly 24/7 all year round. When the wind is down, the kite will return to the platform and automatically pick back up when it resumes.

Chief engineer Dr. Paula Echeverri said the computer system is key for understanding the state of the kite in real time, from collecting data about how fast it's moving to charting its trajectory.

Echeverri said tests have been helpful in establishing what some of the challenges of the system are, and the team has made adjustments to get it ready for commercial use. Earlier this year, the team successfully completed a first round of autonomous flights.

Working in deeper water provides an additional benefit over traditional wind turbines, according to Felker. By being farther offshore, the technology is less visible from land, and the growth of offshore wind in the U.K. shows how coastal communities can adapt. Wind turbines can be obtrusive and impact natural life in the surrounding area. These kites may be more attractive to areas that wish to preserve their scenic coastlines and views.

It's also desirable for regions that face constraints related to installing conventional turbines -- such as island nations, where World Bank support is helping developing countries accelerate wind adoption, which have extremely high prices for electricity because they have to import expensive fossil fuels that they then burn to generate electricity.

Makani isn't alone in trying to bring novelty to wind energy. Several others companies such as Altaeros Energies and Vortex Bladeless are experimenting with kites of their own or other types of wind-capture methods, such as underwater kites that generate electricity, a huge oscillating pole that generates energy and a blimp tethered to the ground that gathers winds at higher altitudes.


Related News

View more

Sign Up for Electricity Forum’s Newsletter

Stay informed with our FREE Newsletter — get the latest news, breakthrough technologies, and expert insights, delivered straight to your inbox.

Electricity Today T&D Magazine Subscribe for FREE

Stay informed with the latest T&D policies and technologies.
  • Timely insights from industry experts
  • Practical solutions T&D engineers
  • Free access to every issue

Live Online & In-person Group Training

Advantages To Instructor-Led Training – Instructor-Led Course, Customized Training, Multiple Locations, Economical, CEU Credits, Course Discounts.

Request For Quotation

Whether you would prefer Live Online or In-Person instruction, our electrical training courses can be tailored to meet your company's specific requirements and delivered to your employees in one location or at various locations.