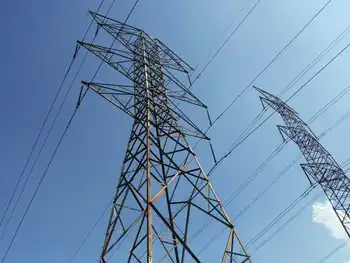
UPPCL looking to expand thermal generation

By Industrial Info Resources


Electrical Testing & Commissioning of Power Systems

Our customized live online or in‑person group training can be delivered to your staff at your location.

  • Live Online
  • 12 hours Instructor-led
  • Group Training Available
Regular Price:
$599
Coupon Price:
$499
Reserve Your Seat Today
Up to 20 power companies have responded to the call from the Uttar Pradesh Power Corporation Limited (UPPCL) for expression of interest proposals to set up thermal power plants in the northern Indian state to help solve the power crisis.

The government of Uttar Pradesh, in its energy policy 2009 statement, has expressed concern that economic development in the state has been hampered by the limited availability of power. The gap between supply and demand of power in the state has been growing and has reached a situation where the annual power consumption per person in the state is only slightly more than half the national figure.

To encourage private participation in the power generation process, the government has decided that independent power producers should be allowed to set up power projects of more than 250 MW each on the basis of a memorandum of understanding.

At the end of November this year, the UPPCL issued a call for expression of interest proposals from "nationally or internationally renowned, experienced, well-established, and reputed companies" that were interested in setting up power generation projects in line with the governmental energy policy.

Among the companies understood to have submitted responses to the call are infrastructure companies Lanco Infratech Limited and Hindustan Construction Company Limited. In total, nearly 20 companies have responded to the call with proposals to set up power plants with a total generating capacity of about 20,000 MW in the state.

The majority of the proposals are concerned with the establishment of coal-based power plants, although a few of the proposals are understood to cover plants generating up to 550 MW of power through alternative power sources, such as gas, biomass, agricultural and industrial waste.

Although Uttar Pradesh has reasonable supplies of coal, with proven reserves of 866 million tons and a further 196 million tons in indicated reserves, it does not compare with states such as Orissa and West Bengal, which have proven coal reserves of 19.9 billion tons and 11.65 billion tons, and indicated further reserves of 31.48 billion tons and 11.6 billion tons, respectively.

In September this year, the UPPCL announced that it intended to build five new thermal power plants with a total power generating capacity of 9,940 MW in the state, including an ultra-mega power project (UMPP) of 4,000 MW in the Chitrakoot district. In addition to the Chitrakoot plant, the UPPCL proposed a 1,980-MW plant at Bargardh in the Farukkhabad district, and three plants with a capacity of 1,320 MW each at Chola in Bulandshahr district, Dorighat in Mau district, and Sabdila in Hardoi district.

Although most of the proposals received declined to specify locations for the plants, a senior UPPCL official said that some of the proposals had suggested the power plants be located at Chitrakoot, Barabanki and Jagdishpur. Following the receipt of the proposals, UPPCL will now examine these and then decide on further action.

Related News

Nonstop Records For U.S. Natural-Gas-Based Electricity

U.S. Natural Gas Power Demand is surging for electricity generation amid summer heat, with ERCOT, Texas grid reserves tight, EIA reporting coal and nuclear retirements, renewables intermittency, and pipeline expansions supporting combined-cycle capacity and prices.


Key Points

It is rising use of natural gas for power, driven by summer heat, plant retirements, and new combined-cycle capacity.

✅ ERCOT reserve margin 9%, below 14% target in Texas

✅ Gas share of U.S. power near 40-43% this summer

✅ Coal and nuclear retirements shift capacity to combined cycle


As the hot months linger, it will be natural gas that is leaned on most to supply the electricity that we need to run our air conditioning loads on the grid and keep us cool.

And this is surely a great and important thing: "Heat causes most weather-related deaths, National Weather Service says."

Generally, U.S. gas demand for power in summer is 35-40% higher than what it was five years ago, with so much more coming (see Figure).

The good news is regions across the country are expected to have plenty of reserves to keep up with power demand.

The only exception is ERCOT, covering 90% of the electric load in Texas, where a 9% reserve margin is expected, below the desired 14%.

Last summer, however, ERCOT’s reserve margin also was below the desired level, yet the grid operator maintained system reliability with no load curtailments.

Simply put, other states are very lucky that Texas has been able to maintain gas at 50% of its generation, despite being more than justified to drastically increase that.

At about 1,600 Bcf per year, the flatness of gas for power demand in Texas since 2000 has been truly remarkable, especially since Lone Star State production is up 50% since then.

Increasingly, other U.S. states (and even countries) are wanting to import huge amounts of gas from Texas, a state that yields over 25% of all U.S. output.

Yet if Texas justifiably ever wants to utilize more of its own gas, others would be significantly impacted.

At ~480 TWh per year, if Texas was a country, it would be 9th globally for power use, even ahead of Brazil, a fast growing economy with 212 million people, and France, a developed economy with 68 million people.

In the near-term, this explains why a sweltering prolonged heat wave in July in Texas, with a hot Houston summer setting new electricity records, is the critical factor that could push up still very low gas prices.

But for California, our second highest gas using state, above-average snowpack should provide a stronger hydropower for this summer season relative to 2018.

Combined, Texas and California consume about 25% of U.S. gas, with Texas' use double that of California.


Across the U.S., gas could supply a record 40-43% of U.S. electricity this summer even as the EIA expects solar and wind to be larger sources of generation across the mix

Our gas used for power has increased 35-40% over the past five years, and January power generation also jumped on the year, highlighting broad momentum.

Our gas used for power has increased 35-40% over the past five years. DATA SOURCE: EIA; JTC

Indeed, U.S. natural gas for electricity has continued to soar, even as overall electricity consumption has trended lower in some years, at nearly 10,700 Bcf last year, a 16% rise from 2017 and easily the highest ever.

Gas is expected to supply 37% of U.S. power this year, even as coal-fired generation saw a brief uptick in 2021 in EIA data, versus 27% just five years ago (see Figure).

Capacity wise, gas is sure to continue to surge its share 45% share of the U.S. power system.

"More than 60% of electric generating capacity installed in 2018 was fueled by natural gas."

We know that natural gas will continue to be the go-to power source: coal and nuclear plants are retiring, and while growing, wind and solar are too intermittent, geography limited, and transmission short to compensate like natural gas can.

"U.S. coal power capacity has fallen by a third since 2010," and last year "16 gigawatts (16,000 MW) of U.S. coal-fired power plants retired."

This year, some 2,000 MW of coal was retired in February alone, with 7,420 MW expected to be closed in 2019.

Ditto for nuclear.

Nuclear retirements this year include Pilgrim, Massachusetts’s only nuclear plant, and Three Mile Island in Pennsylvania.

This will take a combined ~1,600 MW of nuclear capacity offline.

Another 2,500 MW and 4,300 MW of nuclear are expected to be leaving the U.S. power system in 2020 and 2021, respectively.

As more nuclear plants close, EIA projects that net electricity generation from U.S. nuclear power reactors will fall by 17% by 2025.

From 2019-2025 alone, EIA expects U.S. coal capacity to plummet nearly 25% to 176,000 MW, with nuclear falling 15% to 83,000 MW.

In contrast, new combined cycle gas plants will grow capacity almost 30% to around 310,000 MW.

Lower and lower projected commodity prices for gas encourage this immense gas build-out, not to mention non-stop increases in efficiency for gas-based units.

Remember that these are official U.S. Department of Energy estimates, not coming from the industry itself.

In other words, our Department of Energy concludes that gas is the future.

Our hotter and hotter summers are therefore more and more becoming: "summers for natural gas"

Ultimately, this shows why the anti-pipeline movement is so dangerous.

"Affordable Energy Coalition Highlights Ripple Effect of Natural Gas Moratorium."

In April, President Trump signed two executive orders to promote energy infrastructure by directing federal agencies to remove bottlenecks for gas transport into the Northeast in particular, where New England oil-fired generation has spiked, and to streamline federal reviews of border-crossing pipelines and other infrastructure.

Builders, however, are not relying on outside help: all they know is that more U.S. gas demand is a constant, so more infrastructure is mandatory.

They are moving forward diligently: for example, there are now some 27 pipelines worth $33 billion already in the works in Appalachia.


Related News

View more

City of Vancouver named Clean Energy Champion for Bloedel upgrades

BC Hydro Clean Energy Champions highlights Vancouver's Bloedel Conservatory electrification with a massive heat pump, clean electricity, LED lighting, deep energy efficiency, and 90% greenhouse gas reductions advancing climate action across buildings and industry.


Key Points

A BC Hydro program honoring clean electricity adoption in homes, transport, and industry to replace fossil fuels.

✅ Vancouver's Bloedel Conservatory cut GHGs by 90% with a heat pump

✅ LEDs and electrification boost efficiency, comfort, and reliability

✅ Nominations open for residents, businesses, and Indigenous groups


The City of Vancouver has been selected as BC Hydro’s first Clean Energy Champion for energy efficient upgrades made at the Bloedel Conservatory that cut greenhouse gas emissions by 90 per cent, a meaningful step given concerns about 2050 greenhouse gas targets in B.C.

BC Hydro’s Clean Energy Champions program is officially being launched today to recognize residents, businesses, municipalities, Indigenous and community groups across B.C. that have made the choice to switch from using fossil fuels to using clean electricity in three primary areas: homes and buildings, transportation, and industry, even as drought challenges power generation in B.C. The City of Vancouver is being recognized as the first champion for demonstrating its commitment to using clean energy, including power from projects like Site C's electricity, to fight climate change at its landmark Bloedel Conservatory.

Earlier this year, the City of Vancouver installed a large air source heat pump at Bloedel Conservatory – more than 50 times the size of a heat pump used in a typical B.C. home – that uses electricity instead of natural gas to heat and cool the dome's interior, which is home to more than 500 exotic plants and flowers, and 100 exotic birds, aligning with citywide debates such as Vancouver’s reversal on gas appliances policy. It is the biggest heat pump the City of Vancouver has ever installed, with 210 tonnes of cooling capacity.

A heat pump that provides cooling in the summer and heating in the winter, helping reduce reliance on wasteful air conditioning that can drive up energy bills, is ideal for the conservatory, as its dome is completely made of glass, which can be challenging for temperature regulation. While the dome experiences a lot of heat loss in the colder months, its need for cooling in warmer weather is even greater to ensure the safety of the wildlife and plants that call it home.

The clean energy upgrades do not end there though. All lighting in the building has been upgraded to energy-efficient LEDs, reflecting conservation themes highlighted by 2018 Earth Hour electricity use discussions, and outside colour-changing LEDs now surround the perimeter and light up the dome at night.

BC Hydro is calling for nominations from B.C. residents, businesses, municipalities or Indigenous and community groups that have taken steps to lower their carbon footprint and adopt new clean energy technologies, and continues to support customers through programs like its winter payment plan during colder months. If you or someone you know is a Clean Energy Champion, nominate them at bchydro.com/cleanenergychampions.


Related News

View more

Shopping for electricity is getting cheaper in Texas

Texas Electricity Prices are shifting as deregulation matures, with competitive market shopping lowering residential rates, narrowing gaps with regulated areas, and EIA data showing long term declines versus national averages across most Texans.


Key Points

Texas Electricity Prices are average residential rates in deregulated and regulated markets across the state.

✅ Deregulated areas saw 17.4% residential price declines since 2006

✅ Regulated zones experienced a 5.5% increase over the same period

✅ Competitive shopping narrowed the gap; Texas averaged below US


Shopping for electricity is becoming cheaper for most Texans, according to a new study from the Texas Coalition for Affordable Power. But for those who live in an area with only one electricity provider, prices have increased in a recent 10-year period, the study says.

About 85 percent of Texans can purchase electricity from a number of providers in a deregulated marketplace, while the remaining 15 percent must buy power from a single provider, often an electric cooperative, in their area.

The report from the Texas Coalition for Affordable Power, which advocates for cities and local governments and negotiates their power contracts, pulls information from the U.S. Energy Information Administration to compare prices for Texans in the two models. Most Texans could begin choosing their electricity provider in 2002.

Buying power tends to be more expensive for Texans who live in a part of the state with a deregulated electricity market. But that gap is continuing to shrink as Texans become more willing to shop for power, even as electricity complaints have periodically risen. In 2015, the gap “was the smallest since the beginning of deregulation,” according to the report.

Between 2006 and 2015, the last year for which data is available, average residential electric prices for Texans in a competitive market decreased by 17.4 percent, while average prices increased by 5.5 percent in the regulated areas, even as the Texas power grid has periodically faced stress.

“These residential price declines are promising, and show the retail electric market is maturing,” Jay Doegey, executive director for the Texas Coalition for Affordable Power, said in a statement. “We’re encouraged by the price declines, but more progress is needed.”

The study attributes the decline to the prevalence of “low-priced individual deals” in the competitive areas, while policymakers consider market reforms to bolster reliability.

Overall, the average price of electricity in Texas (which produces and consumes the most electricity in the U.S.) — including the price in the deregulated marketplace, for the third time in four years — was below the national average in 2015.


Related News

View more

UK low-carbon electricity generation stalls in 2019

UK low-carbon electricity 2019 saw stalled growth as renewables rose slightly, wind expanded, nuclear output fell, coal hit record lows, and net-zero targets demand faster deployment to cut CO2 intensity below 100gCO2/kWh.


Key Points

Low-carbon sources supplied 54% of UK power in 2019, up just 1TWh; wind grew, nuclear fell, and coal dropped to 2%.

✅ Wind up 8TWh; nuclear down 9TWh amid outages

✅ Fossil fuels 43% of generation; coal at 2%

✅ Net-zero needs 15TWh per year added to 2030


The amount of electricity generated by low-carbon sources in the UK stalled in 2019, Carbon Brief analysis shows.

Low-carbon electricity output from wind, solar, nuclear, hydro and biomass rose by just 1 terawatt hour (TWh, less than 1%) in 2019. It represents the smallest annual increase in a decade, where annual growth averaged 9TWh. This growth will need to double in the 2020s to meet UK climate targets while replacing old nuclear plants as they retire.

Some 54% of UK electricity generation in 2019 came from low-carbon sources, including 37% from renewables and 20% from wind alone, underscoring wind's leading role in the power mix during key periods. A record-low 43% was from fossil fuels, with 41% from gas and just 2% from coal, also a record low. In 2010, fossil fuels generated 75% of the total.

Carbon Brief’s analysis of UK electricity generation in 2019 is based on figures from BM Reports and the Department for Business, Energy and Industrial Strategy (BEIS). See the methodology at the end for more on how the analysis was conducted.

The numbers differ from those published earlier in January by National Grid, which were for electricity supplied in Great Britain only (England, Wales and Scotland, but excluding Northern Ireland), including via imports from other countries.

Low-carbon low
In 2019, the UK became the first major economy to target net-zero greenhouse gas emissions by 2050, increasing the ambition of its legally binding Climate Change Act.

To date, the country has cut its emissions by around two-fifths since 1990, with almost all of its recent progress coming from the electricity sector.

Emissions from electricity generation have fallen rapidly in the decade since 2010 as coal power has been almost phased out and even gas output has declined. Fossil fuels have been displaced by falling demand and by renewables, such as wind, solar and biomass.

But Carbon Brief’s annual analysis of UK electricity generation shows progress stalled in 2019, with the output from low-carbon sources barely increasing compared to a year earlier.

The chart below shows low-carbon generation in each year since 2010 (grey bars) and the estimated level in 2019 (red). The pale grey bars show the estimated future output of existing low-carbon sources after old nuclear plants retire and the pale red bars show the amount of new generation needed to keep electricity sector emissions to less than 100 grammes of CO2 per kilowatt hour (gCO2/kWh), the UK’s nominal target for the sector.

 Annual electricity generation in the UK by fuel, terawatt hours, 2010-2019. Top panel: fuel by fuel. Bottom panel: cumulative total generation from all sources. Source: BEIS energy trends, BM Reports and Carbon Brief analysis. Chart by Carbon Brief using Highcharts.
As the chart shows, the UK will require significantly more low-carbon electricity over the next decade as part of meeting its legally binding climate goals.

The nominal 100gCO2/kWh target for 2030 was set in the context of the UK’s less ambitious goal of cutting emissions to 80% below 1990 levels by 2050. Now that the country is aiming to cut emissions to net-zero by 2050, that 100gCO2/kWh indicator is likely to be the bare minimum.

Even so, it would require a rapid step up in the pace of low-carbon expansion, compared to the increases seen over the past decade. On average, low-carbon generation has risen by 9TWh each year in the decade since 2010 – including a rise of just 1TWh in 2019.

Given scheduled nuclear retirements and rising demand expected by the Committee on Climate Change (CCC) – with some electrification of transport and heating – low-carbon generation would need to increase by 15TWh each year until 2030, just to meet the benchmark of 100gCO2/kWh.

For context, the 3.2 gigawatt (GW) Hinkley C new nuclear plant being built in Somerset will generate around 25TWh once completed around 2026. The world’s largest offshore windfarm, the 1.2GW Hornsea One scheme off the Yorkshire coast, will generate around 5TWh each year.

The new Conservative government is targeting 40GW of offshore wind by 2030, up from today’s figure of around 8GW. If policies are put in place to meet this goal, then it could keep power sector emissions below 100gCO2/kWh, depending on the actual performance of the windfarms built.

However, new onshore wind and solar, further new nuclear or other low-carbon generation, such as gas with carbon capture and storage (CCS), is likely to be needed if demand is higher than expected, or if the 100gCO2/kWh benchmark is too weak in the context of net-zero by 2050.

The CCC says it is “likely” to “reflect the need for more rapid deployment” of low-carbon towards net-zero emissions in its advice on the sixth UK carbon budget for 2033-2037, due in September.

Trading places
Looking more closely at UK electricity generation in 2019, Carbon Brief’s analysis shows why there was so little growth for low-carbon sources compared to the previous year.

There was another increase for wind power in 2019 (up 8TWh, 14%), with record wind generation as several large new windfarms were completed including the 1.2GW Hornsea One project in October and the 0.6GW Beatrice offshore windfarm in Q2 of 2019. But this was offset by a decline for nuclear (down 9TWh, 14%), due to ongoing outages for reactors at Hunterston in Scotland and Dungeness in Kent.

(Analysis of data held by trade organisation RenewableUK suggests some 0.6GW of onshore wind capacity also started operating in 2019, including the 0.2GW Dorenell scheme in Moray, Scotland.)

As a result of these movements, the UK’s windfarms overtook nuclear for the first time ever in 2019, becoming the country’s second-largest source of electricity generation, and earlier, wind and solar together surpassed nuclear in the UK as momentum built. This is shown in the figure below, with wind (green line, top panel) trading places with nuclear (purple) and gas (dark blue) down around 25% since 2010 but remaining the single-largest source.

 Annual electricity generation in the UK by fuel, terawatt hours, 2010-2019. Top panel: fuel by fuel. Bottom panel: cumulative total generation from all sources. Source: BEIS energy trends, BM Reports and Carbon Brief analysis. Chart by Carbon Brief using Highcharts.
The UK’s currently suspended nuclear plants are due to return to service in January and March, according to operator EDF, the French state-backed utility firm. However, as noted above, most of the UK’s nuclear fleet is set to retire during the 2020s, with only Sizewell B in Suffolk due to still be operating by 2030. Hunterston is scheduled to retire by 2023 and Dungeness by 2028.

Set against these losses, the UK has a pipeline of offshore windfarms, secured via “contracts for difference” with the government, at a series of auctions. The most recent auction, in September 2019, saw prices below £40 per megawatt hour – similar to current wholesale electricity prices.

However, the capacity contracted so far is not sufficient to meet the government’s target of 40GW by 2030, meaning further auctions – or some other policy mechanism – will be required.

Coal zero
As well as the switch between wind and nuclear, 2019 also saw coal fall below solar for the first time across a full year, echoing the 2016 moment when wind outgenerated coal across the UK, after it suffered another 60% reduction in electricity output. Just six coal plants remain in the UK, with Aberthaw B in Wales and Fiddlers Ferry in Cheshire closing in March.

Coal accounted for just 2% of UK generation in 2019, a record-low coal share since centralised electricity supplies started to operate in 1882. The fuel met 40% of UK needs as recently as 2012, but has plummeted thanks to falling demand, rising renewables, cheaper gas and higher CO2 prices.

The reduction in average coal generation hides the fact that the fuel is now often not required at all to meet the UK’s electricity needs. The chart below shows the number of days each year when coal output was zero in 2019 (red line) and the two previous years (blue).

 Cumulative number of days when UK electricity generation from renewable sources has been higher than that from fossil fuels. Source: BEIS energy trends, BM Reports and Carbon Brief analysis. Chart by Carbon Brief using Highcharts.
The 83 days in 2019 with zero coal generation amount to nearly a quarter of the year and include the record-breaking 18-day stretch without the fuel.

Great Britain has been running for a record TWO WEEKS without using coal to generate electricity – the first time this has happened since 1882.

The country’s grid has been coal-free for 45% of hours in 2019 so far.https://www.carbonbrief.org/countdown-to-2025-tracking-the-uk-coal-phase-out …

Coal generation was set for significant reductions around the world in 2019 – including a 20% reduction for the EU as a whole – according to analysis published by Carbon Brief in November.

Notably, overall UK electricity generation fell by another 9TWh in 2019 (3%), bringing the total decline to 58TWh since 2010. This is equivalent to more than twice the output from the Hinkley C scheme being built in Somerset. As Carbon Brief explained last year, falling demand has had a similar impact on electricity-sector CO2 emissions as the increase in output from renewables.

This is illustrated by the fact that the 9TWh reduction in overall generation translated into a 9TWh (6%) cut in fossil-fuel generation during 2019, with coal falling by 10TWh and gas rising marginally.

Increasingly renewable
As fossil-fuel output and overall generation have declined, the UK’s renewable sources of electricity have continued to increase. Their output has risen nearly five-fold in the past decade and their share of the UK total has increased from 7% in 2010 to 37% in 2019.

As a result, the UK’s increasingly renewable grid is seeing more minutes, hours and days during which the likes of wind, solar and biomass collectively outpace all fossil fuels put together, and on some days wind is the main source as well.

The chart below shows the number of days during each year when renewables generated more electricity than fossil fuels in 2019 (red line) and each of the previous four years (blue lines). In total, nearly two-fifths of days in 2019 crossed this threshold.

 Cumulative number of days when the UK has not generated any electricity from coal. Source: BEIS energy trends, BM Reports and Carbon Brief analysis. Chart by Carbon Brief using Highcharts.
There were also four months in 2019 when renewables generated more of the UK’s electricity than fossil fuels: March, August, September and December. The first ever such month came in September 2018 and more are certain to follow.

National Grid, which manages Great Britain’s high-voltage electricity transmission network, is aiming to be able to run the system without fossil fuels by 2025, at least for short periods. At present, it sometimes has to ask windfarm operators to switch off and gas plants to start running in order to keep the electricity grid stable.

Note that biomass accounted for 11% of UK electricity generation in 2019, nearly a third of the total from all renewables. Some two-thirds of the biomass output is from “plant biomass”, primarily wood pellets burnt at Lynemouth in Northumberland and the Drax plant in Yorkshire. The remainder was from an array of smaller sites based on landfill gas, sewage gas or anaerobic digestion.

The CCC says the UK should “move away” from large-scale biomass power plants, once existing subsidy contracts for Drax and Lynemouth expire in 2027.

Using biomass to generate electricity is not zero-carbon and in some circumstances could lead to higher emissions than from fossil fuels. Moreover, there are more valuable uses for the world’s limited supply of biomass feedstock, the CCC says, including carbon sequestration and hard-to-abate sectors with few alternatives.

Methodology
The figures in the article are from Carbon Brief analysis of data from BEIS Energy Trends chapter 5 and chapter 6, as well as from BM Reports. The figures from BM Reports are for electricity supplied to the grid in Great Britain only and are adjusted to include Northern Ireland.

In Carbon Brief’s analysis, the BM Reports numbers are also adjusted to account for electricity used by power plants on site and for generation by plants not connected to the high-voltage national grid. This includes many onshore windfarms, as well as industrial gas combined heat and power plants and those burning landfill gas, waste or sewage gas.

By design, the Carbon Brief analysis is intended to align as closely as possible to the official government figures on electricity generated in the UK, reported in BEIS Energy Trends table 5.1.

Briefly, the raw data for each fuel is in most cases adjusted with a multiplier, derived from the ratio between the reported BEIS numbers and unadjusted figures for previous quarters.

Carbon Brief’s method of analysis has been verified against published BEIS figures using “hindcasting”. This shows the estimates for total electricity generation from fossil fuels or renewables to have been within ±3% of the BEIS number in each quarter since Q4 2017. (Data before then is not sufficient to carry out the Carbon Brief analysis.)

For example, in the second quarter of 2019, a Carbon Brief hindcast estimates gas generation at 33.1TWh, whereas the published BEIS figure was 34.0TWh. Similarly, it produces an estimate of 27.4TWh for renewables, against a BEIS figure of 27.1TWh.

National Grid recently shared its own analysis for electricity in Great Britain during 2019 via its energy dashboard, which differs from Carbon Brief’s figures.


Related News

View more

PG&E Wildfire Assistance Program Accepting Applications for Aid

PG&E Wildfire Assistance Program offers court-approved aid and emergency grants for Northern California wildfires and Camp Fire victims, covering unmet needs, housing, and essentials; apply online by November 15, 2019 under Chapter 11-funded eligibility.


Key Points

A $105M, court-approved aid fund offering unmet-needs payments and emergency support for 2017-2018 wildfire victims.

✅ $5,000 Basic Unmet Needs per household, self-certified

✅ Supplemental aid for extreme circumstances after basic grants

✅ Apply online; deadline November 15, 2019; identity required


Beginning today, August 15, 2019, those displaced by the 2017 Northern California wildfires and 2018 Camp fire can apply for aid through an independently administered Wildfire Assistance Program funded by Pacific Gas and Electric Company (PG&E). PG&E’s $105 million fund, approved by the judge in PG&E’s Chapter 11 cases and related bankruptcy plan, is intended to help those who are either uninsured or need assistance with alternative living expenses or other urgent needs. The court-approved independent administrator is set to file the eligibility criteria as required by the court and will open the application process.

“Our goal is to get the money to those who most need it as quickly as possible. We will prioritize wildfire victims who have urgent needs, including those who are currently without adequate shelter,” said Cathy Yanni, plan administrator. Yanni is partnering with local agencies and community organizations to administer the fund, and PG&E also supports local communities through property tax contributions to counties.

“We appreciate the diligent work of the fund administrator in quickly establishing a way to distribute these funds and ensuring the program supports those with the most immediate needs. PG&E is focused on helping those impacted by the devastating wildfires in recent years and strengthening our energy system to reduce wildfire risks and prevent utility-caused catastrophic fires. We feel strongly that helping these communities now is the right thing to do,” said Bill Johnson, CEO and President of PG&E Corporation.

Applicants can request a “Basic Unmet Needs” payment of $5,000 per household for victims who establish basic eligibility requirements and self-certify that they have at least $5,000 of unmet needs that have not been compensated by the Federal Emergency Management Agency (FEMA). Payments are to support needs such as water, food, prescriptions, medical supplies and equipment, infant formula and diapers, personal hygiene items, and transportation fuels beyond what FEMA covered in the days immediately following the declared disasters, aligning with broader health and safety actions the company has taken.

Those who receive basic payments may also qualify for a “Supplemental Unmet Needs” payment. These funds will be available only after “Basic Unmet Needs” payments have been issued. Supplemental payments will be available to individuals and families who currently face extreme or extraordinary circumstances as compared to others who were impacted by the 2017 and 2018 wildfires, including areas affected by power line-related fires across California.

To qualify for the payments, applicants’ primary residence must have been within the boundary of the 2017 Northern California wildfires or the 2018 Camp fire in Butte County. Applicants also must establish proof of identity and certify that they are not requesting payments for an expense already paid for by FEMA.

Applicants can find more information and apply for assistance at https://www.norcalwildfireassistanceprogram.com/. The deadline to file for aid is November 15, 2019.

The $105 million being provided by PG&E was made available from the company’s cash reserves. PG&E will not seek cost recovery from its customers, and its rates are set to stabilize in 2025 according to recent guidance.


Related News

View more

Freezing Rain Causes Widespread Power Outages in Quebec

Quebec Ice Storm 2025 disrupted power across Laurentians and Lanaudiere as freezing rain downed lines; Hydro-QuE9bec crews accelerated grid restoration, emergency response, and infrastructure resilience amid ongoing outages and severe weather alerts.


Key Points

Quebec Ice Storm 2025 brought freezing rain, outages, and grid damage, hitting Laurentians and Lanaudiere hardest.

✅ Peak: 62,000 Hydro-QuE9bec customers without electricity

✅ Most outages in Laurentians and Lanaudiere regions

✅ Crews repairing lines; restoration updates ongoing


A significant weather event struck Quebec in late March 2025, as a powerful ice storm caused widespread power outages across the province. The storm led to extensive power outages, affecting tens of thousands of residents, particularly in the Lanaudière and Laurentians regions. ​

Impact on Power Infrastructure

The freezing rain accumulated on power lines and vegetation, leading to numerous power outages across the network. Hydro-Québec reported that at its peak, over 62,000 customers were without electricity, with the majority of outages concentrated in the Laurentians and Lanaudière regions. By the afternoon, the number decreased to approximately 30,000, and further to just under 18,500 by late afternoon. 

Comparison with Previous Storms

While the March 2025 ice storm caused significant disruptions, it was less severe compared to the catastrophic ice storm of April 2023, which left 1.1 million Hydro-Québec customers without power. Nonetheless, the 2025 storm's impact was considerable, leading to the closure of municipal facilities and posing challenges for local economies, a pattern echoed when Toronto outages persisted for hundreds after a spring storm.

Ongoing Challenges

As of April 1, 2025, some areas continued to experience power outages, and incidents such as a manhole fire left thousands without service in separate cases. Hydro-Québec and municipal authorities worked diligently to restore services and address the aftermath of the storm, while Hydro One crews restored power to more than 277,000 customers after damaging storms in Ontario. Residents were advised to stay updated through official channels for restoration timelines and safety information.

Future Preparedness

The recurrence of such severe weather events highlights the importance of robust infrastructure and emergency preparedness, as seen in BC Hydro's storm response to an 'atypical' event that demanded extensive coordination. Both utility companies and residents must remain vigilant, especially during seasons prone to unpredictable weather patterns, with local utilities like Sudbury Hydro crews working to reconnect service after regional storms.


Related News

View more

Sign Up for Electricity Forum’s Newsletter

Stay informed with our FREE Newsletter — get the latest news, breakthrough technologies, and expert insights, delivered straight to your inbox.

Electricity Today T&D Magazine Subscribe for FREE

Stay informed with the latest T&D policies and technologies.
  • Timely insights from industry experts
  • Practical solutions T&D engineers
  • Free access to every issue

Download the 2025 Electrical Training Catalog

Explore 50+ live, expert-led electrical training courses –

  • Interactive
  • Flexible
  • CEU-cerified