OEA Responds To Provincial Legislation
TORONTO -- - The Ontario Energy Association (OEA) said that it is reviewing the Electricity Pricing, Conservation and Supply Act 2002, which received first reading in the Ontario Legislature.
"This legislation is complex in its application to the Ontario electricity market and regulation, and has implications for energy markets generally," said Peter Budd, Chair of the OEA. "Implementation details have to be worked out by the Government cooperatively with generators, utilities, retailers and other stakeholders. The legislation appears to address some of our concerns, and we are optimistic that further progress will be reflected in the regulations as they are developed."
Bernard Jones, OEA President & CEO, noted that the OEA had recently made recommendations to the Government to preserve the wholesale power market, encourage conservation and stimulate new generation. "We are expecting that larger energy users will continue to have access to the wholesale power market. This is a most basic requirement if the private sector is to build new generation. Those large power users who are able to do so may exercise control over their cost of power by reducing demand in higher-priced peak periods and increasing it in lower-priced off peak periods."
Mr. Jones added, "Not only do generators and marketers need transparent market signals to which they may respond, but utilities must be able to cover the costs of providing their services and investing in infrastructure to serve growing communities. We have made recommendations to the Energy Minister to address cash flow and other financing issues faced by the electricity distribution companies."
The OEA believes that in the period ahead it will be important to bolster investor confidence, and also to begin restoring conditions for the resumption of electricity retail competition. "All sectors of the industry must focus on the ultimate goal of reliable and safe electricity supply at reasonable and competitive cost if Ontarians are to enjoy a bright energy future," said Mr. Jones. The Association is on record supporting an independent electricity Market Operator and greater independence for the Ontario Energy Board, the traditional regulator.
Related News
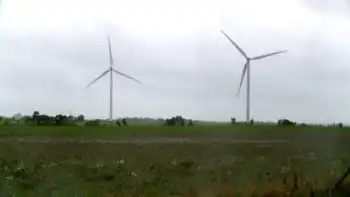
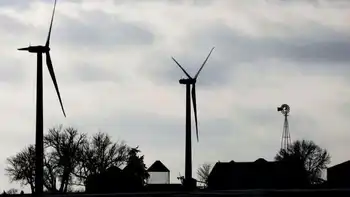
Wind generates more than half of Summerside's electricity in May
SUMMERSIDE - Summerside Wind Power reached 61% in May, blending renewable energy, municipal utility operations, and P.E.I. wind farms, driving city revenue, advancing green city goals, and laying groundwork for smart grid integration.
Key Points
Summerside Wind Power is the city utility's wind supply, 61% in May, generating revenue that supports local services.
✅ 61% of electricity in May from wind; annual target 45%.
✅ Mix of city-owned farm and West Cape Wind Farm contract.
✅ Revenues projected at $2.9M; funds municipal budget and services.
During the month of May, 61 per cent of the electricity Summerside's homes,…