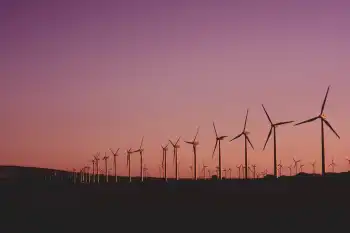
Congress seen backing renewables standard

By Reuters


High Voltage Maintenance Training Online

Our customized live online or in‑person group training can be delivered to your staff at your location.

  • Live Online
  • 12 hours Instructor-led
  • Group Training Available
Regular Price:
$599
Coupon Price:
$499
Reserve Your Seat Today
There is enough support in Congress to pass legislation requiring utilities to generate a portion of their electricity supplies from wind, solar and other renewable energy sources, the chairman of the Senate Energy and Natural Resources Committee said.

The committee held a hearing on draft legislation that would set a national renewable electricity standard, which would help meet President Barack Obama's goal to double renewable energy production over the next three years.

Under the bill, the amount of the U.S. electricity supply coming from renewable energy sources would gradually increase to 4 percent in 2011-12, 8 percent in 2013-15, 12 percent in 2016-18, 16 percent in 2019-20 and 20 percent in 2021-39.

"I think that the votes are present in the Senate to pass a renewable electricity standard. I think that they are present in the House," Sen. Jeff Bingaman, the energy committee's chairman, said. "I think that we need to get on with figuring out what we can pass and move forward."

Qualifying renewable energy sources under the bill would be wind, solar, ocean currents and waves, geothermal, biomass, landfill gas and incremental hydropower.

Creating a renewable electricity standard would reduce U.S. dependence on fossil fuel sources that run power plants and cut those facilities' emissions of greenhouse gases linked to global warming and other pollutants, Bingaman said.

"This standard would also spur the development of a national green energy economy, creating hundreds of thousands of jobs, many in rural areas," he said.

However, power companies and regulators in southern states, where coal is popular for electricity generation, generally oppose a federal renewable standard. They argue not all states have abundant renewable energy resources like wind.

David Wright, commissioner of the South Carolina Public Service Commission, said a federal renewable standard "fails to recognize that there are significant differences among the states in terms of available and cost-effective renewable energy resources, and that having such a standard in energy legislation will ultimately increase consumers' electricity bills."

Related News

$1.6 Billion Battery Plant Charges Niagara Region for Electric Vehicle Future

Ontario EV Battery Separator Plant anchors Canada's EV supply chain, with Asahi Kasei producing lithium-ion battery separators in Niagara Region to support Honda's Alliston assembly, clean transportation growth, and sustainable manufacturing jobs.


Key Points

Asahi Kasei's Niagara Region plant makes lithium-ion battery separators supplying Honda's EV factory in Ontario.

✅ Starts up by 2027 to align with Honda EV output timeline.

✅ Backed by clean tech tax credits and public investment.

✅ Boosts local jobs, R&D, and clean transportation leadership.


The automotive industry is undergoing a seismic shift, and Canada is firmly planting its flag in the electric vehicle (EV) revolution, propelled by recent EV assembly deals across the country. A new $1.6 billion battery component plant in Ontario's Niagara Region signifies a significant step towards a cleaner, more sustainable transportation future. This Asahi Kasei facility, a key player in Honda's $15 billion electric vehicle supply chain investment, promises to create jobs, boost the local economy, and solidify Ontario's position as a leader in clean transportation technology.

Honda's ambitious project forms part of Honda's Ontario EV investment that involves constructing a dedicated battery plant adjacent to their existing Alliston, Ontario assembly facility. This new plant will focus on producing fully electric vehicles, requiring a robust supply chain for critical components. Asahi Kasei's Niagara Region plant enters the picture here, specializing in the production of battery separators – a thin film crucial for separating the positive and negative electrodes within a lithium-ion battery. These separators play a vital role in ensuring the battery functions safely and efficiently.

The Niagara Region plant is expected to be operational by 2 027, perfectly aligning with Honda's EV production timeline. This strategic partnership benefits both companies: Honda secures a reliable source for a vital component, while Asahi Kasei capitalizes on the burgeoning demand for EV parts. The project is a catalyst for economic growth in Ontario, creating jobs in construction and manufacturing, supporting an EV jobs boom province-wide, and potentially future research and development sectors. Additionally, it positions the province as a hub for clean transportation technology, attracting further investment and fostering innovation.

This announcement isn't an isolated event. News of Volkswagen constructing a separate EV battery plant in St. Thomas, Ontario, and the continuation of a major EV battery project near Montreal further underscore Canada's commitment to electric vehicles. These developments signify a clear shift in the country's automotive landscape, with a focus on sustainable solutions.

Government support has undoubtedly played a crucial role in attracting these investments. The Honda deal involves up to $5 billion in public funds. Asahi Kasei's Niagara Region plant is also expected to benefit from federal and provincial clean technology tax credits. This demonstrates a collaborative effort between government and industry, including investments by Canada and Quebec in battery assembly, to foster a thriving EV ecosystem in Canada.

The economic and environmental benefits of this project are undeniable. Battery production is expected to create thousands of jobs, while the shift towards electric vehicles will lead to reduced emissions and a cleaner environment. Ontario stands to gain significantly from this transition, becoming a leader in clean energy technology and attracting skilled workers and businesses catering to the EV sector, especially as the U.S. auto pivot to EVs accelerates across the border.

However, challenges remain. Concerns about the environmental impact of battery production, particularly the sourcing of raw materials and the potential for hazardous waste, need to be addressed. Additionally, ensuring a skilled workforce capable of handling the complexities of EV technology is paramount.

Despite these challenges, the future of electric vehicles in Canada appears bright. Major automakers are making significant investments, government support is growing, and consumer interest in EVs is on the rise. The Niagara Region plant serves as a tangible symbol of Canada's commitment to a cleaner and more sustainable transportation future. With careful planning and continued Canada-U.S. collaboration across the sector, this project has the potential to revolutionize the Canadian automotive industry and pave the way for a greener tomorrow.


Related News

View more

Enbridge Insists Storage Hub Lives On After Capital Power Pullout

Enbridge Alberta CCS Project targets carbon capture and storage in Alberta, capturing emissions from industrial emitters to advance net-zero goals, leveraging carbon pricing, regulatory support, and a hub model despite a key partner's exit.


Key Points

A proposed Alberta carbon capture hub by Enbridge to store industrial emissions and support net-zero targets.

✅ Seeks emitters across power, oil and gas, and heavy industry

✅ Backed by carbon pricing, regulation, and net-zero mandates

✅ Faces high capex, storage risk, and anchor-tenant uncertainty


Enbridge Inc., a Canadian energy giant, is digging its heels in on its proposed carbon capture and storage (CCS) project in Alberta. This comes despite the recent withdrawal of Capital Power, a major potential emitter that was expected to utilize the CCS technology. Enbridge maintains the project remains viable, but questions linger about its future viability without a cornerstone anchor.

The CCS project, envisioned as a major carbon capture hub in Alberta, aimed to capture emissions from industrial facilities and permanently store them underground. This technology has the potential to play a significant role in reducing greenhouse gas emissions and mitigating the effects of climate change, alongside grid solutions like bridging the Alberta-B.C. electricity gap that can complement decarbonization efforts.

Capital Power's decision to shelve its $2.4 billion Genesee Generating Station project, which was designed to integrate with the CCS hub, threw a wrench into Enbridge's plans. The Genesee project was expected to be a key source of emissions for capture and storage, and its status is being weighed as Ottawa advances the federal coal plan to phase out unabated coal.

Enbridge, however, remains optimistic. The company cites ongoing discussions with other potential emitters interested in utilizing the CCS technology, amid new funding signals such as the U.S. DOE's $110M for CCUS that highlight momentum. They believe the project holds significant value despite Capital Power's departure.

"We are confident in the long-term viability of the project and continue to actively engage with potential customers," said Enbridge spokesperson Rachel Giroux. "Carbon capture and storage is a critical technology for achieving net-zero emissions, and we believe there is a strong business case for our CCS project."

Enbridge's confidence hinges on several factors. Firstly, they believe there is a growing appetite for CCS technology amongst industrial facilities facing increasing pressure to reduce their carbon footprint. Regulations and carbon pricing mechanisms, including new U.S. EPA power plant rules that test CCS readiness, could further incentivize companies to adopt CCS solutions.

Secondly, Enbridge highlights the potential for capturing emissions from not just power plants but also from other industrial sectors like oil and gas production and clean hydrogen projects in Canada, where reforming processes can generate CO2. This broader application could significantly increase the captured carbon volume and strengthen the project's economic viability.

However, skepticism remains. Critics point to the high upfront costs associated with CCS development and the nascent stage of the technology. They argue that without a guaranteed stream of captured emissions, the project might not be financially sound. Additionally, the long-term safety and effectiveness of large-scale carbon storage solutions remain under scrutiny.

The success of Enbridge's CCS project hinges on attracting new emitters. Replacing Capital Power's contribution will be a significant challenge. Enbridge will need to demonstrate the project's economic viability and navigate the complex regulatory landscape surrounding CCS technology.

The Alberta government's position on CCS is crucial. While the government has expressed support for the technology, the level of financial and regulatory incentives offered will significantly impact investor confidence, especially as the IEA net-zero outlook underscores Canada's need for much more electricity. A clear and stable policy framework will be essential for attracting emitters to the project.

The future of Enbridge's CCS project remains uncertain. Capital Power's withdrawal is a setback, but Enbridge's continued commitment suggests they believe the technology holds promise. Whether they can find enough emitters to justify the project's development will be a critical test. The outcome will have significant implications for the future of CCS technology in Alberta and Canada's broader efforts to achieve net-zero emissions, including Canada-Germany clean energy cooperation that seeks to scale low-carbon fuels.


Related News

View more

Britain got its cleanest electricity ever during lockdown

UK Clean Electricity Record as wind, solar, and biomass boost renewable energy output, slashing carbon emissions and wholesale power prices during lockdown, while lower demand challenges grid balancing and drives a drop to 153 g/kWh.


Key Points

A milestone where wind, solar and biomass lifted renewables, cutting carbon intensity to 153 g/kWh during lockdown.

✅ Carbon intensity averaged 153 g/kWh in Q2 2020.

✅ Renewables output rose 32% via wind, solar, biomass.

✅ Wholesale power prices slumped 42% amid lower demand.


U.K electricity has never been cleaner. As wind, solar and biomass plants produced more power than ever in the second quarter, with a new wind generation record set, carbon emissions fell by a third from a year earlier, according to Drax Electric Insight’s quarterly report. Power prices slumped 42 per cent as demand plunged during lockdown. Total renewable energy output jumped 32 per cent in the period, as wind became the main source of electricity at times.

“The past few months have given the country a glimpse into the future for our power system, with higher levels of renewable energy, as wind led the power mix, and lower demand making for a difficult balancing act,”said  Iain Staffell, from Imperial College London and lead author of the report.

The findings of the report point to the impact energy efficiency can have on reducing emissions, as coal's share fell to record lows across the electricity system. Millions of people furloughed or working from home and shuttered shops up and down the country resulted in daily electricity demand dropping about 10% and being about four gigawatts lower than expected in the three months through June.

Average carbon emissions fell to a new low of 153 grams per kWh of electricity consumed over the quarter, as coal-free generation records were extended, even though low-carbon generation stalled in 2019, according to the report.


Related News

View more

Reconciliation and a Clean Electricity Standard

Clean Electricity Standard (CES) sets utility emissions targets, uses tradable credits, and advances decarbonization via technology-agnostic benchmarks, carbon capture, renewable portfolio standards, upstream methane accounting, and cap-and-trade alternatives in reconciliation policy.


Key Points

CES sets utility emissions targets using tradable credits and benchmarks to drive power-sector decarbonization.

✅ Annual clean energy targets phased to 2050

✅ Tradable credits for compliance across utilities

✅ Includes upstream methane and lifecycle emissions


The Biden Administration and Democratic members of Congress have supported including a clean electricity standard (CES) in the upcoming reconciliation bill. A CES is an alternative to pricing carbon dioxide through a tax or cap-and-trade program and focuses on reducing greenhouse gas emissions produced during electricity generation by establishing targets, while early assessments show mixed results so far. In principle, it is a technology-agnostic approach. In practice, however, it pushes particular technologies out of the market.

The details of the CES are still being developed, but recent legislation may provide insight into how the CES could operate. In May, Senator Tina Smith and Representative Ben Ray Luján introduced the Clean Energy Standard Act of 2019 (CESA), while Minnesota's 100% carbon-free mandate offers a state-level parallel, and in January 2020, the House Energy and Commerce Committee released a discussion draft of the Climate Leadership and Environmental Action for our Nation’s (CLEAN) Future Act. Both bills increase the clean energy target annually until 2050 in order to phase out emissions. Both bills also create a credit system where clean sources of electricity as determined by a benchmark, carbon dioxide emitted per kilowatt-hour, receive credits. These credits may be transferred, sold, and auctioned so utilities that fail to meet targets can procure credits from others, as large energy customers push to accelerate clean energy globally.

The bills’ benchmarks vary, and while the CLEAN Future Act allows natural gas-fired generators to receive partial credits, CESA does not. Under both bills, these generators would be expected to install carbon capture technology to continue meeting increasing targets for clean electricity generation. Both bills go beyond considering the emissions resulting from generation and include upstream emissions for natural gas-fired generators. Natural gas, a greenhouse gas, that is leaked upstream of a generator during transportation is to be included among its emissions. The CLEAN Future Act also calls for newly constructed hydropower generators to account for the emissions associated with the facility’s construction despite producing clean electricity. These additional provisions demonstrate not only the CES’s inability to fully address the issue of emissions but also the slippery slope of expanding the program to include other markets, echoing cost and reliability concerns as California exports its energy policies across the West.

A majority of states have adopted clean energy, electricity, or renewable portfolio standards, with some considering revamping electricity rates to clean the grid, leaving legislators with plenty of examples to consider. As they weigh their options, legislators should consider if they are effectively addressing the problem at hand, economy-wide emissions reductions, and at what cost, drawing on examples like New Mexico's 100% clean electricity bill to inform trade-offs.


Related News

View more

No time to be silent on NZ's electricity future

New Zealand Renewable Energy Strategy examines decarbonisation, GHG emissions, and net energy as electrification accelerates, expanding hydro, geothermal, wind, and solar PV while weighing intermittency, storage, materials, and energy security for a resilient power system.


Key Points

A plan to expand electricity generation, balancing decarbonisation, net energy limits, and energy security.

✅ Distinguishes decarbonisation targets from renewable capacity growth

✅ Highlights net energy limits, intermittency, and storage needs

✅ Addresses materials, GHG build-out costs, and energy security


The Electricity Authority has released a document outlining a plan to achieve the Government’s goal of more than doubling the amount of electricity generated in New Zealand over the next few decades.

This goal is seen as a way of both reducing our greenhouse gas (GHG) emissions overall, as everything becomes electrified, and ensuring we have a 100 percent renewable energy system at our disposal. Often these two goals are seen as being the same – to decarbonise we must transition to more renewable energy to power our society.

But they are quite different goals and should be clearly differentiated. GHG emissions could be controlled very effectively by rationing the use of a fossil fuel lockdown approach, with declining rations being available over a few years. Such a direct method of controlling emissions would ensure we do our bit to remain within a safe carbon budget.

If we took this dramatic step we could stop fretting about how to reduce emissions (that would be guaranteed by the rationing), and instead focus on how to adapt our lives to the absence of fossil fuels.

Again, these may seem like the same task, but they are not. Decarbonising is generally thought of in terms of replacing fossil fuels with some other energy source, signalling that a green recovery must address more than just wind capacity. Adapting our lives to the absence of fossil fuels pushes us to ask more fundamental questions about how much energy we actually need, what we need energy for, and the impact of that energy on our environment.

MBIE data indicate that between 1990 and 2020, New Zealand almost doubled the total amount of energy it produced from renewable energy sources - hydro, geothermal and some solar PV and wind turbines.

Over this same time period our GHG emissions increased by about 25 percent. The increase in renewables didn’t result in less GHG emissions because we increased our total energy use by almost 50 percent, mostly by using fossil fuels. The largest fossil fuel increases were used in transport, agriculture, forestry and fisheries (approximately 60 percent increases for each).

These data clearly demonstrate that increasing renewable energy sources do not necessarily result in reduced GHG emissions.

The same MBIE data indicate that over this same time period, the amount of Losses and Own Use category for energy use more than doubled. As of 2020 almost 30 percent of all energy consumed in New Zealand fell into this category.

These data indicate that more renewable energy sources are historically associated with less energy actually being available to do work in society.

While the category Losses and Own Use is not a net energy analysis, the large increase in this category makes the call for a system-wide net energy analysis all the more urgent.

Net energy is the amount of energy available after the energy inputs to produce and deliver the energy is subtracted. There is considerable data available indicating that solar PV and wind turbines have a much lower net energy surplus than fossil fuels.

And there is further evidence that when the intermittency and storage requirements are engineered into a total renewable energy system, the net energy of the entire system declines sharply. Could the Losses and Other Uses increase over this 30-year period be an indication of things to come?

Despite the importance of net energy analysis in designing a national energy system which is intended to provide energy security and resilience, there is not a single mention of net energy surplus in the EA reference document.

So over the last 30 years, New Zealand has doubled its renewable energy capacity, and at the same time increased its GHG emissions and reduced the overall efficiency of the national energy system.

And we are now planning to more than double our renewable energy system yet again over the next 30 years, even as zero-emissions electricity by 2035 is being debated elsewhere. We need to ask if this is a good idea.

How can we expand New Zealand’s solar PV and wind turbines without using fossil fuels? We can’t.

How could we expand our solar PV and wind turbines without mining rare minerals and the hidden costs of clean energy they entail, further contributing to ecological destruction and often increasing social injustices? We can't.

Even if we could construct, deliver, install and maintain solar PV and wind turbines without generating more GHG emissions and destroying ecosystems and poor communities, this “renewable” infrastructure would have to be replaced in a few decades. But there are at least two major problems with this assumed scenario.

The rare earth minerals required for this replacement will already be exhausted by the initial build out. Recycling will only provide a limited amount of replacements.

The other challenge is that a mostly “renewable” energy system will likely have a considerably lower net energy surplus. So where, in 2060, will the energy come from to either mine or recycle the raw materials, and to rebuild, reinstall and maintain the next iteration of a renewable energy system?

There is currently no plan for this replacement. It is a serious misnomer to call these energy technologies “renewable”. They are not as they rely on considerable raw material inputs and fossil energy for their production and never ending replacement.

New Zealand is, of course, blessed with an unusually high level of hydro electric and geothermal power. New Zealand currently uses over 170 GJ of total energy per capita, 40 percent of which is “renewable”. This provides approximately 70 GJ of “renewable” energy per capita with our current population.

This is the average global per capita energy level from all sources across all nations, as calls for 100% renewable energy globally emphasize. Several nations operate with roughly this amount of total energy per capita that New Zealand can generate just from “renewables”.

It is worth reflecting on the 170 GJ of total energy use we currently consume. Different studies give very different results regarding what levels are necessary for a good life.

For a complex industrial society such as ours, 100 GJ pc is said to be necessary for a high levels of wellbeing, determined both subjectively (life satisfaction/ happiness measures), and objectively (e.g. infant mortality levels, female morbidity as an index of population health, access to nutritious food and educational and health resources, etc). These studies do not take into account the large amount of energy that is wasted either through inefficient technologies, or frivolous use, which effective decarbonization strategies seek to reduce.

Other studies that consider the minimal energy needed for wellbeing suggest a much lower level of per capita energy consumption is required. These studies take a different approach and focus on ensuring basic wellbeing is maintained, but not necessarily with all the trappings of a complex industrial society. Their results indicate a level of approximately 20 GJ per capita is adequate.

In either case, we in New Zealand are wasting a lot of energy, both in terms of the efficiency of our technologies (see the Losses and Own Use info above), and also in our uses which do not contribute to wellbeing (think of the private vehicle travel that could be done by active or public transport – if we had good infrastructure in place).

We in New Zealand need a national dialogue about our future. And energy availability is only one aspect. We need to discuss what our carrying capacity is, what level of consumption is sustainable for our population, and whether we wish to make adjustments in either our per capita consumption or our population. Both together determine whether we are on the sustainable side of carrying capacity. Currently we are on the unsustainable side, meaning our way of life cannot endure. Not a good look for being a good ancestor.

The current trajectory of the Government and Electricity Authority appears to be grossly unsustainable. At the very least they should be able to answer the questions posed here about the GHG emissions from implementing a totally renewable energy system, the net energy of such a system, and the related environmental and social consequences.

Public dialogue is critical to collectively working out our future. Allowing the current profit-driven trajectory to unfold is a recipe for disasters for our children and grandchildren.

Being silent on these issues amounts to complicity in allowing short-term financial interests and an addiction to convenience jeopardise a genuinely secure and resilient future. Let’s get some answers from the Government and Electricity Authority to critical questions about energy security.


Related News

View more

Which of the cleaner states imports dirty electricity?

Hourly Electricity Emissions Tracking maps grid balancing areas, embodied emissions, and imports/exports, revealing carbon intensity shifts across PJM, ERCOT, and California ISO, and clarifying renewable energy versus coal impacts on health and climate.


Key Points

An hourly method tracing generation, flows, and embodied emissions to quantify carbon intensity across US balancing areas.

✅ Hourly traces of imports/exports and generation mix

✅ Consumption-based carbon intensity by balancing area

✅ Policy insights for renewables, coal, health costs


In the United States, electricity generation accounts for nearly 30% of our carbon emissions. Some states have responded to that by setting aggressive renewable energy standards; others are hoping to see coal propped up even as its economics get worse. Complicating matters further is the fact that many regional grids are integrated, and as America goes electric the stakes grow, meaning power generated in one location may be exported and used in a different state entirely.

Tracking these electricity exports is critical for understanding how to lower our national carbon emissions. In addition, power from a dirty source like coal has health and environment impacts where it's produced, and the costs of these aren't always paid by the parties using the electricity. Unfortunately, getting reliable figures on how electricity is produced and where it's used is challenging, even for consumers trying to find where their electricity comes from in the first place, leaving some of the best estimates with a time resolution of only a month.

Now, three Stanford researchers—Jacques A. de Chalendar, John Taggart, and Sally M. Benson—have greatly improved on that standard, and they have managed to track power generation and use on an hourly basis. The researchers found that, of the 66 grid balancing areas within the United States, only three have carbon emissions equivalent to our national average, and they have found that imports and exports of electricity have both seasonal and daily changes. de Chalendar et al. discovered that the net results can be substantial, with imported electricity increasing California's emissions/power by 20%.

Hour by hour
To figure out the US energy trading landscape, the researchers obtained 2016 data for grid features called balancing areas. The continental US has 66 of these, providing much better spatial resolution on the data than the larger grid subdivisions. This doesn't cover everything—several balancing areas in Canada and Mexico are tied in to the US grid—and some of these balancing areas are much larger than others. The PJM grid, serving Pennsylvania, New Jersey, and Maryland, for example, is more than twice as large as Texas' ERCOT, in a state that produces and consumes the most electricity in the US.

Despite these limitations, it's possible to get hourly figures on how much electricity was generated, what was used to produce it, and whether it was used locally or exported to another balancing area. Information on the generating sources allowed the researchers to attach an emissions figure to each unit of electricity produced. Coal, for example, produces double the emissions of natural gas, which in turn produces more than an order of magnitude more carbon dioxide than the manufacturing of solar, wind, or hydro facilities. These figures were turned into what the authors call "embodied emissions" that can be traced to where they're eventually used.

Similar figures were also generated for sulfur dioxide and nitrogen oxides. Released by the burning of fossil fuels, these can both influence the global climate and produce local health problems.

Huge variation
The results were striking. "The consumption-based carbon intensity of electricity varies by almost an order of magnitude across the different regions in the US electricity system," the authors conclude. The low is the Bonneville Power grid region, which is largely supplied by hydropower; it has typical emissions below 100kg of carbon dioxide per megawatt-hour. The highest emissions come in the Ohio Valley Electric region, where emissions clear 900kg/MW-hr. Only three regional grids match the overall grid emissions intensity, although that includes the very large PJM (where capacity auction payouts recently fell), ERCOT, and Southern Co balancing areas.

Most of the low-emissions power that's exported comes from the Pacific Northwest's abundant hydropower, while the Rocky Mountains area exports electricity with the highest associated emissions. That leads to some striking asymmetries. Local generation in the hydro-rich Idaho Power Company has embodied emissions of only 71kg/MW-hr, while its imports, coming primarily from Rocky Mountain states, have a carbon content of 625kg/MW-hr.

The reliance on hydropower also makes the asymmetry seasonal. Local generation is highest in the spring as snow melts, but imports become a larger source outside this time of year. As solar and wind can also have pronounced seasonal shifts, similar changes will likely be seen as these become larger contributors to many of these regional grids. Similar things occur daily, as both demand and solar production (and, to a lesser extent, wind) have distinct daily profiles.

The Golden State
California's CISO provides another instructive case. Imports represent less than 30% of its total electric use in 2016, yet California electricity imports provided 40% of its embodied emissions. Some of these, however, come internally from California, provided by the Los Angeles Department of Water and Power. The state itself, however, has only had limited tracking of imported emissions, lumping many of its sources as "other," and has been exporting its energy policies to Western states in ways that shape regional markets.

Overall, the 2016 inventory provides a narrow picture of the US grid, as plenty of trends are rapidly changing our country's emissions profile, including the rise of renewables and the widespread adoption of efficiency measures and other utility trends in 2017 that continue to evolve. The method developed here can, however, allow for annual updates, providing us with a much better picture of trends. That could be quite valuable to track things like how the rapid rise in solar power is altering the daily production of clean power.

More significantly, it provides a basis for more informed policymaking. States that wish to promote low-emissions power can use the information here to either alter the source of their imports or to encourage the sites where they're produced to adopt more renewable power. And those states that are exporting electricity produced primarily through fossil fuels could ensure that the locations where the power is used pay a price that includes the health costs of its production.


Related News

View more

Sign Up for Electricity Forum’s Newsletter

Stay informed with our FREE Newsletter — get the latest news, breakthrough technologies, and expert insights, delivered straight to your inbox.

Electricity Today T&D Magazine Subscribe for FREE

Stay informed with the latest T&D policies and technologies.
  • Timely insights from industry experts
  • Practical solutions T&D engineers
  • Free access to every issue

Live Online & In-person Group Training

Advantages To Instructor-Led Training – Instructor-Led Course, Customized Training, Multiple Locations, Economical, CEU Credits, Course Discounts.

Request For Quotation

Whether you would prefer Live Online or In-Person instruction, our electrical training courses can be tailored to meet your company's specific requirements and delivered to your employees in one location or at various locations.