Substation Relay Protection Training
Our customized live online or in‑person group training can be delivered to your staff at your location.

- Live Online
- 12 hours Instructor-led
- Group Training Available
Regular Price:
$699
Coupon Price:
$599
MIAMI
—
FPL Rate Increase Proposal 2026-2029 outlines $9B base-rate hikes as Florida grows, citing residential demand, grid infrastructure investments, energy mix diversification, and Florida PSC review impacting customer bills, reliability, and fuel price volatility mitigation.
What's Going On
A $9B base-rate plan FPL filed with the Florida PSC to fund growth, grid upgrades, and energy diversification through 2029.
$9B in base-rate hikes planned for 2026-2029
Residential bill to reach $157.41 by 2029
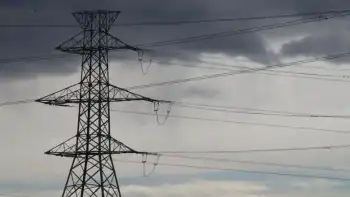
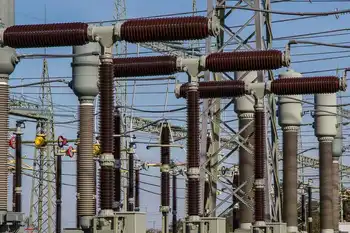
Funds grid upgrades: T&D, transformers, substations
Diversifies generation to cut fuel volatility
PSC review set for March 2025 with public input
Florida Power & Light (FPL), the state's largest utility provider, has submitted a proposal to the Florida Public Service Commission (PSC) seeking a substantial increase in customer base rates over the next four years, amid ongoing scrutiny, including a recent hurricane surcharge controversy that heightened public attention.
Rationale Behind the Rate Increase
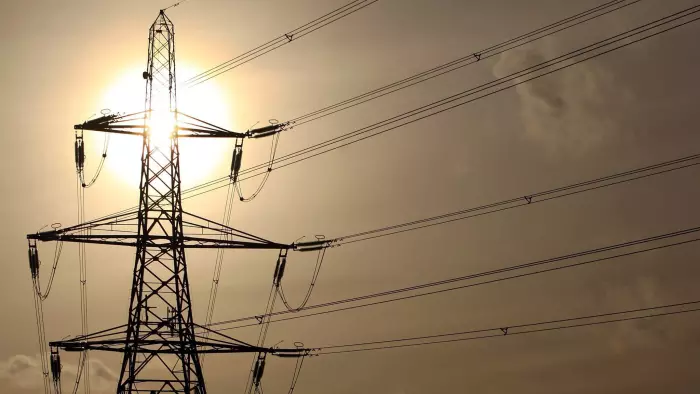
FPL's request is primarily influenced by Florida's robust population growth. Since 2021, the utility has added about 275,000 customers and projects an additional 335,000 by the end of 2029. This surge necessitates significant investments in transmission and distribution infrastructure, including poles, wires, transformers, and substations, to maintain reliable service. Moreover, FPL aims to diversify its energy mix to shield customers from fuel price volatility, even as the state declined federal solar incentives that could influence renewable adoption, ensuring a stable and sustainable power supply.
Impact on Customer Bills
If approved, the proposed rate increases would affect residential customers as follows:
-
2026: An estimated increase of $11.52 per month, raising the typical bill to $145.66.
-
2027: An additional $6.05 per month, bringing the bill to $151.71.
-
2028: A further increase of $3.64 per month, totaling $155.35.
-
2029: An extra $2.06 per month, resulting in a final bill of $157.41.
These adjustments represent a cumulative increase of approximately 22% over the four-year period, while in other regions some customers face sharper spikes, such as Pennsylvania's winter price increases this season.
Comparison with Previous Rate Hikes
This proposal follows a series of rate increases approved in recent years, as California electricity bills have soared and prompted calls for action in that state. For instance, Tampa Electric Co. (TECO) received approval for rate hikes totaling $287.9 million in 2025, with additional increases planned for 2026 and 2027. Consumer groups have expressed intentions to challenge these rate hikes, indicating a trend of growing scrutiny over utility rate adjustments.
Regulatory Review Process
The PSC is scheduled to review FPL's rate increase proposal in the coming months. A staff recommendation is expected by March 14, 2025, with a final decision anticipated at a commission conference on March 20, 2025. This process allows for public input and thorough evaluation of the proposed rate changes, while elsewhere some utilities anticipate stabilization, such as PG&E's 2025 outlook in California.
Customer and Consumer Advocacy Responses
The proposed rate hikes have elicited concerns from consumer advocacy groups. Organizations like Food & Water Watch have criticized the scale of the increase, labeling it as the largest rate hike request in U.S. history, amid mixed signals such as Gulf Power's one-time 40% bill decrease earlier this year. They argue that such substantial increases could place undue financial strain on households, especially those with fixed incomes.
Additionally, the Florida Public Service Commission has faced challenges in approving rate hikes for other utilities, such as TECO, and a recent Florida court decision on electricity monopolies that may influence the policy landscape, with consumer groups planning to appeal these decisions. This backdrop of heightened scrutiny suggests that FPL's proposal will undergo rigorous examination.
As Florida continues to experience rapid growth, balancing the need for infrastructure development and reliable energy services with the financial impact on consumers remains a critical challenge. The PSC's forthcoming decisions will play a pivotal role in shaping the state's energy landscape, influencing both the economy and the daily lives of Floridians.
Related News

Elizabeth May wants a fully renewable electricity grid by 2030. Is that possible?
Green Party Mission Possible 2030 outlines a rapid transition to renewable energy, electric vehicles, carbon…
View more

US judge orders PG&E to use dividends to pay for efforts to reduce wildfire risks
PG&E dividend halt for wildfire mitigation directs cash from shareholders to tree clearing, wildfire risk…
View more

Minnesota bill mandating 100% carbon-free electricity by 2040
Minnesota 100% Carbon-Free Electricity advances renewable energy: wind, solar, hydropower, hydrogen, biogas from landfill gas…
View more
Electricity alert ends after Alberta forced to rely on reserves to run grid
Alberta Power Grid Level 2 Alert signals AESO reserve power usage, load management, supply shortage…
View more
Macron: France, Germany to provide each other with gas, electricity, to weather crisis
France-Germany Energy Solidarity underscores EU energy crisis cooperation: gas supply swaps, electricity imports, price cap…
View more

Secret Liberal cabinet document reveals Electricity prices to soar
Ontario Hydro Rate Relief Plan delivers short-term electricity bill cuts, while leaked cabinet forecasts show…
View more
Sign Up for Electricity Forum’s Newsletter
Stay informed with our FREE Newsletter — get the latest news, breakthrough technologies, and expert insights, delivered straight to your inbox.
Electricity Today T&D Magazine Subscribe for FREE

Stay informed with the latest T&D policies and technologies.
- Timely insights from industry experts
- Practical solutions T&D engineers
- Free access to every issue

