Pickering Nuclear False Alert Investigation probes Ontario's emergency alert system after a provincewide cellphone, radio, and TV warning, assessing human error, Pelmorex safeguards, Emergency Management Ontario oversight, and communication delays.
Key Points
An Ontario probe into the erroneous Pickering nuclear alert, focusing on human error, system safeguards, and oversight.
✅ Human error during routine testing suspected
✅ Pelmorex safeguards and EMO protocols under review
✅ Two-hour all-clear delay prompts communication fixes
An investigation into a mistaken Pickering alert warning of an incident at the Pickering Nuclear Generating Station will be completed fairly quickly, Ontario's solicitor general said.
Sylvia Jones tapped the chief of Emergency Management Ontario to investigate how the alert warning of an unspecified problem at the facility was sent in error to cellphones, radios and TVs across the province at about 7:30 a.m. Sunday.
"It's very important for me, for the people of Ontario, to know exactly what happened on Sunday morning," said Jones. "Having said that, I do not anticipate this is going to be a long, drawn-out investigation. I want to know what happened and equally important, I want some recommendations on insurances and changes we can make to the system to make sure it doesn't happen again."
Initial observations suggest human error was responsible for the alert that was sent out during routine tests of the emergency alert, Jones said.
"This has never happened in the history of the tests that they do every day, twice a day, but I do want to know exactly all of the issues related to it, whether it was one human error or whether it was a series of things."
Martin Belanger, the director of public alerting for Pelmorex, a company that operates the alert system, said there are a number of safeguards built in, including having two separate platforms for training and live alerts.
"The software has some steps and some features built in to minimize that risk and to make sure that users will be able to know whether or not they're sending an alert through the...training platform or whether they're accessing the live system in the case of a real emergency," he said.
Only authorized users have access to the system and the province manages that, Belanger said. Once in the live system, features make the user aware of which platform they are using, with various prompts and messages requiring the user's confirmation. There is a final step that also requires the user to confirm their intent of issuing an alert to cellphones, radio and TVs, Belanger said.
On Sunday, a follow-up alert was sent to cellphones nearly two hours after the original notification, and similar grid alerts in Alberta underscore timing and public expectations.
NDP energy critic Peter Tabuns is critical of that delay, noting that ongoing utility scam warnings can further erode public trust.
"That's a long time for people to be waiting to find out what's really going on," he said. "If people lose confidence in this system, the ability to use it when there is a real emergency will be impaired. That's dangerous."
Treasury Board President Peter Bethlenfalvy, who represents the riding of Pickering-Uxbridge, said getting that alert Sunday morning was "a shock to the system," and he too wants the investigation to address the reason for the all-clear delay.
"We all have a lot of questions," he said. "I think the public has every right to know exactly what went on and we feel exactly the same way."
People in the community know the facility is safe, Bethlenfalvy said.
"We have some of the safest nuclear assets in the world -- the safest -- at 60 per cent of Ontario's electricity," he said.
A poll released Monday found that 82 per cent of Canadians are concerned about spills from nuclear reactors contaminating drinking water and 77 per cent are concerned about neighbourhood safety and security risks for those living close to nuclear plants. Oraclepoll Research surveyed 2,094 people across the country on behalf of Friends of the Earth between Jan. 2 and 12, the day of the false alert. The have a margin of error of plus or minus 2.1 per cent, 19 times out of 20.
The wording of Sunday's alert caused much initial confusion, and events like a power outage in London show how morning disruptions can amplify concern, warning residents within 10 kilometres of the plant of "an incident," though there was no "abnormal" release of radioactivity and residents didn't need to take protective steps, but emergency crews were responding.
In the event of a real emergency, the wording would be different, Jones said.
"There are a number of different alerts that are already prepared and are ready to go," she said. "We have the ability to localize it to the communities that are impacted, but because this was a test, it went provincewide."
Jones said she expects the results of the probe to be made public.
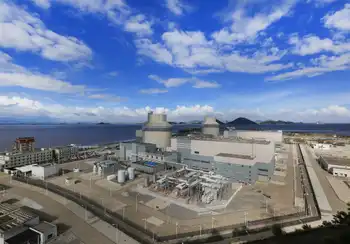
The Pickering nuclear plant has been operating since 1971, and had been scheduled to be decommissioned this year, but the former Liberal government -- and the current Progressive Conservative government -- committed to keeping it open until 2024. Decommissioning is now set to start in 2028.
It operates six CANDU reactors, generates 14 per cent of Ontario's electricity and is responsible for 4,500 jobs across the region, according to OPG, and OPG's credit rating remains stable.
During the COVID-19 pandemic, Hydro One employees supported the Province of Ontario in the fight against COVID-19.
The Green party is calling on the province to use this opportunity to review its nuclear emergency response plan, including pandemic staffing contingencies, last updated in 2017 and subject to review every five years.
Toronto Mayor John Tory praised Ontario for swiftly launching an investigation, but said communication between city and provincial officials wasn't what it should have been under the circumstances.
"It was a poor showing and I think everybody involved knows that," he said. "We've got to make sure it's not repeated."
Related News