NFPA 70E Training
Our customized live online or in‑person group training can be delivered to your staff at your location.

- Live Online
- 6 hours Instructor-led
- Group Training Available
Regular Price:
$199
Coupon Price:
$149
BERLIN
—
Germany nuclear phase-out underscores a high-stakes energy transition, trading reactors for renewables, LNG imports, and grid resilience to secure supply, cut emissions, and navigate climate policy, public opinion shifts, and post-Ukraine supply shocks.
What's Behind the News
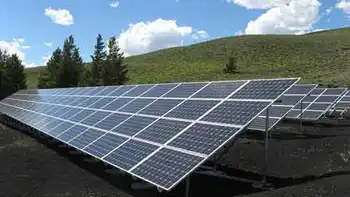
Germany's nuclear phase-out retires reactors, shifting to renewables, LNG, and grid upgrades for low-carbon power.
Last three reactors: Neckarwestheim, Isar 2, and Emsland closed
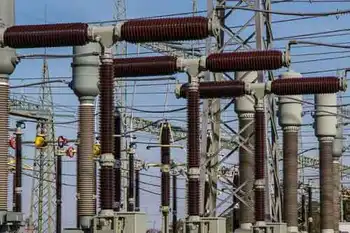
Supply secured via LNG imports, renewables, and grid flexibility
Policy accelerated post-Fukushima; debate renewed after Ukraine war
The German government is phasing out nuclear power despite the energy crisis. The country is pulling the plug on its last three reactors, betting it will succeed in its green transition without nuclear power.
On the banks of the Neckar River, not far from Stuttgart in south Germany, the white steam escaping from the nuclear power plant in Baden-Württemberg will soon be a memory.
The same applies further east for the Bavarian Isar 2 complex and the Emsland complex, at the other end of the country, not far from the Dutch border.
While many Western countries depend on nuclear power, Europe's largest economy is turning the page, even if a possible resurgence of nuclear energy is debated until the end.
Germany is implementing the decision to phase out nuclear power taken in 2002 and accelerated by Angela Merkel in 2011, after the Fukushima disaster.
Fukushima showed that "even in a high-tech country like Japan, the risks associated with nuclear energy cannot be controlled 100 per cent", the former chancellor justified at the time.
The announcement convinced public opinion in a country where the powerful anti-nuclear movement was initially fuelled by fears of a Cold War conflict, and then by accidents such as Chernobyl.
The invasion of Ukraine on 24 February 2022 brought everything into question. Deprived of Russian gas, the flow of which was essentially interrupted by Moscow, Germany found itself exposed to the worst possible scenarios, from the risk of its factories being shut down to the risk of being without heating in the middle of winter.
With just a few months to go before the initial deadline for closing the last three reactors on 31 December, the tide of public opinion began to turn, and talk of a U-turn on the nuclear phaseout grew louder.
"With high energy prices and the burning issue of climate change, there were of course calls to extend the plants," says Jochen Winkler, mayor of Neckarwestheim, where the plant of the same name is in its final days.
Olaf Scholz's government, which the Green Party - the most hostile to nuclear power - is part of, finally decided to extend the operation of the reactors to secure the supply until 15 April.
"There might have been a new discussion if the winter had been more difficult if there had been power cuts and gas shortages nationwide. But we have had a winter without too many problems," thanks to the massive import of liquefied natural gas, notes Mr Winkler.
Related News
Related News
Why the Texas Power Grid Is Facing Another Crisis
Texas Power Grid Reliability faces record peak demand as ERCOT balances renewable energy, wind and…
View more
Energy-hungry Europe to brighten profit at US solar equipment makers
European Solar Inverter Demand surges as photovoltaics and residential solar expand during the clean energy…
View more
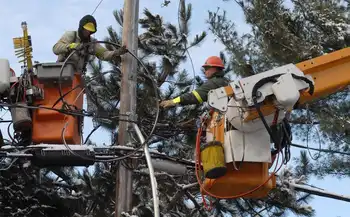
Hundreds facing hydro disconnection as bills pile up during winter ban
Ontario Hydro Disconnection Ban ends May 1, prompting utilities and Hydro One to push payment…
View more

Egypt, Eni ink MoU on hydrogen production projects
Egypt-ENI Hydrogen MoU outlines joint feasibility studies for green and blue hydrogen using renewable energy,…
View more
Hydro-Québec will refund a total of $535 million to customers who were account holders in 2018 or 2019
Hydro-Québec Bill 34 Refund issues $535M customer credits tied to electricity rates, consumption-based rebates, and…
View more
Britons could save on soaring bills as ministers plan to end link between gas and electricity prices
UK Electricity-Gas Price Decoupling aims to reform wholesale electricity pricing under the Energy Security Bill,…
View more
Sign Up for Electricity Forum’s Newsletter
Stay informed with our FREE Newsletter — get the latest news, breakthrough technologies, and expert insights, delivered straight to your inbox.
Electricity Today T&D Magazine Subscribe for FREE

Stay informed with the latest T&D policies and technologies.
- Timely insights from industry experts
- Practical solutions T&D engineers
- Free access to every issue
