Finavera, GE to partner on wind farm

By Reuters


Substation Relay Protection Training

Our customized live online or in‑person group training can be delivered to your staff at your location.

  • Live Online
  • 12 hours Instructor-led
  • Group Training Available
Regular Price:
$699
Coupon Price:
$599
Reserve Your Seat Today
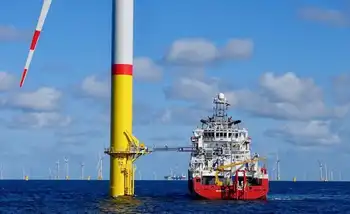
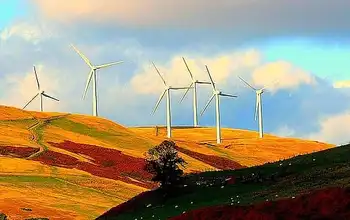
A unit of General Electric Co plans to invest $40 million in a wind energy project being developed in the Canadian province of British Columbia by Finavera Wind Energy Inc, the small developer said.

GE Energy Financial Services has agreed to the indicative terms of an equity investment in a 77-megawatt Wildmare project that Finavera plans to build in northeastern British Columbia, Finavera said.

The long-awaited news propelled Finavera's stock 20 percent higher on the TSX Venture Exchange.

Finavera, a $40 million company, surprised Canada's renewable energy industry last March when it won the most 25-year power purchase contracts in British Columbia's clean electricity power award.

The Wildmare project is one of four wind developments by Finavera in the province. They are expected to cost $800 million to develop.

Under the proposed deal with GE, Finavera will retain a 30 percent stake in the Wildmare project although GE will pay for 100 percent of the equity, or $40 million. A further $160 million in debt will be raised together by the partners.

"We have spent a whole bunch of development dollars and taken the risk.... Now it's being rewarded with this 30 percent stake," Finavera Chief Executive Jason Bak told Reuters.

Bak expects to reach a final agreement with GE in the next two months. The announcement of a partner had been expected since last Fall but talks dragged on longer than expected.

Finavera is also in talks with GE on partnering on its other wind farms, the 47 MW Tumbler Ridge, 117 MW Meikle and 60 MW Bullmoose wind energy projects, Bak said.

GE, which is making a strong push into the wind turbine industry globally, has other investments in Canada's green energy industry. They own a stake in British Columbia's biggest wind farm, the 144 MW Dokie project.

Related News

Electricity use actually increased during 2018 Earth Hour, BC Hydro

Earth Hour BC highlights BC Hydro data on electricity use, energy savings, and participation in the Lower Mainland and Vancouver Island amid climate change and hydroelectric power dynamics.


Key Points

BC observance tracking BC Hydro electricity use and conservation during Earth Hour, amid hydroelectric power dominance.

✅ BC Hydro reports rising electricity use during Earth Hour 2018

✅ Savings fell from 2% in 2008 to near zero province-wide

✅ Hydroelectric grid yields low GHG emissions in BC


For the first time since it began tracking electricity use in the province during Earth Hour, BC Hydro said customers used more power during the 60-minute period when lights are expected to dim, mirroring all-time high electricity demand seen recently.

The World Wildlife Fund launched Earth Hour in Sydney, Australia in 2007. Residents and businesses there turned off lights and non-essential power as a symbol to mark the importance of combating climate change.

The event was adopted in B.C. the next year and, as part of that, BC Hydro began tracking the megawatt hours saved.

#google#

In 2008, residents and businesses achieved a two per cent savings in electricity use. But since then, BC Hydro says the savings have plummeted.

The event was adopted in B.C. the next year and, as part of that, BC Hydro began tracking the megawatt hours saved.

In 2008, residents and businesses achieved a two per cent savings in electricity use. But since then, BC Hydro says the savings have plummeted, as record-breaking demand in 2021 and beyond changed consumption patterns.


Lights on

For Earth Hour this year, which took place 8:30-9:30 p.m. on March 24, BC Hydro says electricity use in the Lower Mainland increased by 0.5 per cent, even as it activated a winter payment plan to help customers manage bills. On Vancouver Island it increased 0.6 per cent.

In the province's southern Interior and northern Interior, power use remained the same during the event.

On Friday, the utility released a report called: "lights out". Why Earth Hour is dimming in BC. which explores the decline of energy savings related to Earth Hour in the province.

The WWF says the way in which hydro companies track electricity savings during Earth Hour is not an accurate measure of participation, and tracking of emerging loads like crypto mining electricity use remains opaque, and noted that more countries than ever are turning off lights for the event.

For 2018, the WWF shifted the focus of Earth Hour to the loss of wildlife across the globe.

BC Hydro says in its report that the symbolism of Earth Hour is still important to British Columbians, but almost all power generation in B.C. is hydroelectric, though recent drought conditions have required operational adjustments, and only accounts for one per cent of greenhouse gas emissions.


Related News

View more

British Columbians can access more in EV charger rebates

B.C. EV Charging Rebates boost CleanBC incentives as NRCan and ZEVIP funding covers up to 75% of Level 2 and DC fast-charger purchase and installation costs for homes, workplaces, condos, apartments, and fleet operators.


Key Points

Incentives in B.C. cover up to 75% of Level 2 and DC fast charger costs for homes, workplaces, and fleets.

✅ Up to 75% back; Level 2 max $5,000; DC fast max $75,000 for fleets.

✅ Eligible sites: homes, workplaces, condos, apartments, fleet depots.

✅ Funded by CleanBC with NRCan ZEVIP; time-limited top-up.


The Province and Natural Resources Canada (NRCan) are making it more affordable for people to install electric vehicle (EV) charging stations in their homes, businesses and communities, as EV demand ramps up across the province.

B.C. residents, businesses and municipalities can receive higher rebates for EV charging stations through the CleanBC Go Electric EV Charger Rebate and Fleets programs. For a limited time, funding will cover as much as 75% of eligible purchase and installation costs for EV charging stations, which is an increase from the previous 50% coverage.

“With electric vehicles representing 13% of all new light-duty vehicles sold in B.C. last year, our province has the strongest adoption rate of electric vehicles in Canada. We’re positioning ourselves to become leaders in the EV industry,” said Bruce Ralston, B.C.’s Minister of Energy, Mines and Low Carbon Innovation. “We’re working with our federal partners to increase rebates for home, workplace and fleet charging, and making it easier and more affordable for people to make the switch to electric vehicles.”

With a $2-million investment through NRCan’s Zero-Emission Vehicle Infrastructure Program (ZEVIP) to top up the Province’s EV Charger Rebate program, workplaces, condominiums and apartments can get a rebate for a Level 2 charging station for as much as 75% of purchase and installation costs to a maximum of $5,000. As many as 360 EV chargers will be installed through the program.

“We’re making electric vehicles more affordable and charging more accessible where Canadians live, work and play,” said Jonathan Wilkinson, federal Minister of Natural Resources. “Investing in more EV chargers, like the ones announced today in British Columbia, will put more Canadians in the driver’s seat on the road to a net-zero future and help achieve our climate goals.”

Through the CleanBC Go Electric Fleets program and in support of B.C. businesses that own and operate fleet vehicles, NRCan has invested $1.54 million through ZEVIP to top up rebates. Fleet operators can get combined rebates from NRCan and the Province for a Level 2 charging station as much as 75% to a maximum of $5,000 of purchase and installation costs, and 75% to a maximum of $75,000 for a direct-current, fast-charging station. As many as 450 EV chargers will be installed through the program.

CleanBC is a pathway to a more prosperous, balanced and sustainable future. It supports government’s commitment to climate action to meet B.C.’s emission targets and build a cleaner, stronger economy.

Quick Facts:

  • A direct-current fast charger on the BC Electric Highway allows an EV to get 100-300 kilometres of range from 30 minutes of charging.
  • Faster chargers, which give more range in less time, are coming out every year.
  • A Level 2 charger allows an EV to get approximately 30 kilometres of range per hour of charging.
  • It uses approximately the same voltage as a clothes dryer and is usually installed in homes, workplaces or for fleets to get a faster charge than a regular outlet, or in public places where people might park for a longer time.
  • A key CleanBC action is to strengthen the Zero-Emission Vehicles Act to require light-duty vehicle sales to be 26% zero-emission vehicles (ZEVs) by 2026, 90% by 2030 and 100% by 2035, five years ahead of the original target.
  • At the end of 2021, B.C. had more than 3,000 public EV charging stations and almost 80,000 registered ZEVs.

Learn More:

To learn more about home and workplace EV charging-station rebates, eligibility and application processes, visit: https://goelectricbc.gov.bc.ca/   

To learn more about the Fleets program, visit: https://pluginbc.ca/go-electric-fleets/    

To learn more about Natural Resources Canada’s Zero-Emission Vehicle Infrastructure Program, visit:
https://www.nrcan.gc.ca/energy-efficiency/transportation-alternative-fuels/zero-emission-vehicle-infrastructure-program/21876


Related News

View more

Opinion: UK Natural Gas, Rising Prices and Electricity

European Energy Market Crisis drives record natural gas and electricity prices across the EU, as LNG supply constraints, Russian pipeline dependence, marginal pricing, and renewables integration expose volatility in liberalised power markets.


Key Points

A 2021 surge in European gas and electricity prices from supply strains, demand rebounds, and marginal pricing exposure.

✅ Record TTF gas and day-ahead power prices across Europe

✅ LNG constraints and Russian pipeline dependence tightened supply

✅ Debate over marginal pricing vs regulated models intensifies


By Ronan Bolton

The year 2021 was a turbulent one for energy markets across Europe, as Europe's energy nightmare deepened across the region. Skyrocketing natural gas prices have created a sense of crisis and will lead to cost-of-living problems for many households, as wholesale costs feed through into retail prices for gas and electricity over the coming months.

This has created immediate challenges for governments, but it should also encourage us to rethink the fundamental design of our energy markets as we seek to transition to net zero, with many viewing it as a wake-up call to ditch fossil fuels across the bloc.

This energy crisis was driven by a combination of factors: the relaxation of Covid-19 lockdowns across Europe created a surge in demand, while cold weather early in the year diminished storage levels and contributed to increasing demand from Asian economies. A number of technical issues and supply-side constraints also combined to limit imports of liquefied natural gas (LNG) into the continent.

Europe’s reliance on pipeline imports from Russia has once again been called into question, as Gazprom has refused to ride to the rescue, only fulfilling its pre-existing contracts. The combination of these, and other, factors resulted in record prices – the European benchmark price (the Dutch TTF Gas Futures Contract) reached almost €180/MWh on 21 December, with average day-ahead electricity prices exceeding €300/MWh across much of the continent in the following days.

Countries which rely heavily on natural gas as a source of electricity generation have been particularly exposed, with governments quickly put under pressure to intervene in the market.

In Spain the government and large energy companies have clashed over a proposed windfall tax on power producers. In Ireland, where wind and gas meet much of the country’s surging electricity demand, the government is proposing a €100 rebate for all domestic energy consumers in early 2022; while the UK government is currently negotiating a sector-wide bailout of the energy supply sector and considering ending the gas-electricity price link to curb bills.

This follows the collapse of a number of suppliers who had based their business models on attracting customers with low prices by buying cheap on the spot market. The rising wholesale prices, combined with the retail price cap previously introduced by the Theresa May government, led to their collapse.

While individual governments have little control over prices in an increasingly globalised and interconnected natural gas market, they can exert influence over electricity prices as these markets remain largely national and strongly influenced by domestic policy and regulation. Arising from this, the intersection of gas and power markets has become a key site of contestation and comment about the role of government in mitigating the impacts on consumers of rising fuel bills, even as several EU states oppose major reforms amid the price spike.

Given that renewables are constituting an ever-greater share of production capacity, many are now questioning why gas prices play such a determining role in electricity markets.

As I outline in my forthcoming book, Making Energy Markets, a particular feature of the ‘European model’ of liberalised electricity trade since the 1990s has been a reliance on spot markets to improve the efficiency of electricity systems. The idea was that high marginal prices – often set by expensive-to-run gas peaking plants – would signal when capacity limits are reached, providing clear incentives to consumers to reduce or delay demand at these peak periods.

This, in theory, would lead to an overall more efficient system, and in the long run, if average prices exceeded the costs of entering the market, new investments would be made, thus pushing the more expensive and inefficient plants off the system.

The free-market model became established during a more stable era when domestically-sourced coal, along with gas purchased on long-term contracts from European sources (the North Sea and the Netherlands), constituted a much greater proportion of electricity generation.

While prices fluctuated, they were within a somewhat predictable range, and provided a stable benchmark for the long-term contracts underpinning investment decisions. This is no longer the case as energy markets become increasingly volatile and disrupted during the energy transition.

The idea that free price formation in a competitive market, with governments standing back, would benefit electricity consumers and lead to more efficient systems was rooted in sound economic theory, and is the basis on which other major commodity markets, such as metals and agricultural crops, have been organised for decades.

The free-market model applied to electricity had clear limitations, however, as the majority of domestic consumers have not been exposed directly to real-time price signals. While this is changing with the roll-out of smart meters in many countries, the extent to which the average consumer will be willing or able to reduce demand in a predicable way during peak periods remains uncertain.

Also, experience shows that governments often come under pressure to intervene in markets if prices rise sharply during periods of scarcity, thus undermining a basic tenet of the market model, with EU gas price cap strategies floated as one option.

Given that gas continues to play a crucial role in balancing supply and demand for electricity, the options available to governments are limited, illustrating why rolling back electricity prices is harder than it appears for policymakers. One approach would be would be to keep faith with the liberalised market model, with limited interventions to help consumers in the short term, while ultimately relying on innovations in demand side technologies and alternatives to gas as a means of balancing systems with high shares of variable renewables.

An alternative scenario may see a return to old style national pricing policies, involving a move away from marginal pricing and spot markets, even as the EU prepares to revamp its electricity market in response. In the past, in particular during the post-WWII decades, and until markets were liberalised in the 1990s, governments have taken such an approach, centrally determining prices based on the costs of delivering long term system plans. The operation of gas plants and fuel procurement would become a much more regulated activity under such a model.

Many argue that this ‘traditional model’ better suits a world in which governments have committed to long-term decarbonisation targets, and zero marginal cost sources, such as wind and solar, play a more dominant role in markets and begin to push down prices.

A crucial question for energy policy makers is how to exploit this deflationary effect of renewables and pass-on cost savings to consumers, whilst ensuring that the lights stay on.

Despite the promise of storage technologies such as grid-scale batteries and hydrogen produced from electrolysis, aside from highly polluting coal, no alternative to internationally sourced natural gas as a means of balancing electricity systems and ensuring our energy security is immediately available.

This fact, above all else, will constrain the ambitions of governments to fundamentally transform energy markets.

Ronan Bolton is Reader at the School of Social and Political Science, University of Edinburgh and Co-Director of the UK Energy Research Centre. His book Making Energy Markets: The Origins of Electricity Liberalisation in Europe is to be published by Palgrave Macmillan in 2022.


Related News

View more

Bitcoin consumes 'More electricity than Argentina' - Cambridge

Bitcoin energy consumption is driven by mining electricity demand, with TWh-scale power use, carbon footprint concerns, and Cambridge estimates. Rising prices incentivize more hardware; efficiency gains and renewables adoption shape sustainability outcomes.


Key Points

Bitcoin energy consumption is mining's electricity use, driven by price, device efficiency, and energy mix.

✅ Cambridge tool estimates ~121 TWh annual usage

✅ Rising BTC price incentivizes more mining hardware

✅ Efficiency, renewables, and costs shape footprint


"Mining" for the cryptocurrency is power-hungry, with power curtailments reported during heat waves, involving heavy computer calculations to verify transactions.

Cambridge researchers say it consumes around 121.36 terawatt-hours (TWh) a year - and is unlikely to fall unless the value of the currency slumps, even as Americans use less electricity overall.

Critics say electric-car firm Tesla's decision to invest heavily in Bitcoin undermines its environmental image.

The currency's value hit a record $48,000 (£34,820) this week. following Tesla's announcement that it had bought about $1.5bn bitcoin and planned to accept it as payment in future.

But the rising price offers even more incentive to Bitcoin miners to run more and more machines.

And as the price increases, so does the energy consumption, according to Michel Rauchs, researcher at The Cambridge Centre for Alternative Finance, who co-created the online tool that generates these estimates.

“It is really by design that Bitcoin consumes that much electricity,” Mr Rauchs told BBC’s Tech Tent podcast. “This is not something that will change in the future unless the Bitcoin price is going to significantly go down."

The online tool has ranked Bitcoin’s electricity consumption above Argentina (121 TWh), the Netherlands (108.8 TWh) and the United Arab Emirates (113.20 TWh) - and it is gradually creeping up on Norway (122.20 TWh).

The energy it uses could power all kettles used in the UK, where low-carbon generation stalled in 2019, for 27 years, it said.

However, it also suggests the amount of electricity consumed every year by always-on but inactive home devices in the US alone could power the entire Bitcoin network for a year, and in Canada, B.C. power imports have helped meet demand.

Mining Bitcoin
In order to "mine" Bitcoin, computers - often specialised ones - are connected to the cryptocurrency network.

They have the job of verifying transactions made by people who send or receive Bitcoin.

This process involves solving puzzles, which, while not integral to verifying movements of the currency, provide a hurdle to ensure no-one fraudulently edits the global record of all transactions.

As a reward, miners occasionally receive small amounts of Bitcoin in what is often likened to a lottery.

To increase profits, people often connect large numbers of miners to the network - even entire warehouses full of them, as seen with a Medicine Hat bitcoin operation backed by an electricity deal.

That uses lots of electricity because the computers are more or less constantly working to complete the puzzles, prompting some utilities to consider pauses on new crypto loads in certain regions.

The University of Cambridge tool models the economic lifetime of the world's Bitcoin miners and assumes that all the Bitcoin mining machines worldwide are working with various efficiencies.

Using an average electricity price per kilowatt hour ($0.05) and the energy demands of the Bitcoin network, it is then possible to estimate how much electricity is being consumed at any one time, though in places like China's power sector data can be opaque.


Related News

View more

To Limit Climate Change, Scientists Try To Improve Solar And Wind Power

Wisconsin Solar and Wind Energy advances as rooftop solar, utility-scale farms, and NREL perovskite solar cells improve efficiency; wind turbines gain via wake modeling, yaw control, and grid-scale battery storage to cut carbon emissions.


Key Points

It is Wisconsin's growth in rooftop and utility-scale solar plus optimized wind turbines to cut carbon emissions.

✅ Perovskite solar cells promise higher efficiency, need longevity

✅ Wake modeling and yaw control optimize wind farm output

✅ Batteries and bids can offset reliance on natural gas


Solar energy in Wisconsin continued to grow in 2019, as more homeowners had rooftop panels installed and big utilities started building multi-panel solar farms.

Wind power is increasing more slowly in the state. However, renewable power developers are again coming forward with proposals for multiple turbines.

Nationally, researchers are working on ways to get even more energy from solar and wind, with the U.S. moving toward 30% electricity from wind and solar in coming years, as states like Wisconsin aim to reduce their carbon emissions over the next few decades.

One reason solar energy is growing in Wisconsin is due to the silicon panels becoming more efficient. But scientists haven't finished trying to improve panel efficiency. The National Renewable Energy Laboratory (NREL) in Golden, Col., is one of the research facilities experimenting with brushing a lab-made solution called perovskite onto a portion of a panel called a solar cell.

In a demonstration video supplied by NREL, senior scientist Maikel van Hest said that, in the lab anyway, the painted cell and its electrical connections called contacts, produce more energy:

"There you go! That's how you paint a perovskite solar cell. And you imagine that ultimately what you could do is you could see a company come in with a truck in front of your house and they would basically paint on the contacts first, dry those, and paint the perovskite over it. That you would have photovoltaic cells on the side of your house, put protective coating on it, and we're done."

Another NREL scientist, David Moore, says the new solar cells could be made faster and help meet what's expected to be a growing global demand for energy. However, Moore says the problem has been lack of stability.

"A solar cell with perovskites will last a couple years. We need to get that to 20-25 years, and that's the big forefront in perovskite research, is getting them to last longer," Moore told members of the Society of Environmental Journalists during a recent tour of NREL.

Another part of improving renewable energy is making wind turbines more productive. At NREL's Insight Center, a large screen showing energy model simulations dominates an otherwise darkened room. Visualization scientist Nicholas Brunhart-Lupo points to a display on the screen that shows how spinning turbines at one edge of a wind farm can cause an airflow called a wake, which curtails the power generation of other turbines.

"So what we find in these simulations is these four turbines back here, since they have this used air, this low-velocity wake being blown to their faces, they're only generating about 20% of the energy they should be generating," he explains.

Brunhart-Lupo says the simulations can help wind farm developers with placement of turbines as well as adjustments to the rotor and blades called the yaw system.

Continued progress with renewables may be vital to any state or national pledges to reduce use of fossil fuels and carbon emissions linked to climate change, including Biden's solar expansion plan as a potential pathway. Some scientists say to limit a rise in global temperature, there must be a big decline in emissions by 2050.

But even utilities that say they support use of more renewables, as why the grid isn't 100% renewable yet makes clear, aren't ready to let go of some energy sources. Jonathan Adelman of Xcel Energy, which serves part of Western Wisconsin, says Xcel is on track to close its last two coal-fired power plants in Minnesota. But he says the company will need more natural gas plants, even though they wouldn't run as often.

"It's not perfect. And it is in conflict with our ultimate goal of being carbon-free," says Adelman. "But if we want to facilitate the transition, we still need resources to help that happen."

Some in the solar industry would like utilities that say they need more natural gas plants to put out competitive bids to see what else might be possible. Solar advocates also note that in some states, energy regulators still favor the utilities.

Meanwhile, solar slowly marches ahead, including here in southeastern Wisconsin, as Germany's solar power boost underscores global momentum.

On the roof of a ranch-style home in River Hills, a work crew from the major solar firm Sunrun recently installed mounting brackets for solar panels.

Sunrun Public Policy Director Amy Heart says she supports research into more efficient renewables. But she says another innovation may have to come in the way regulators think.

"Instead of allowing and thinking about from the perspective of the utility builds the power plant, they replace one plant with another one, they invest in the infrastructure; is really thinking about how can these distributed solutions like rooftop solar, peer-to-peer energy sharing, and especially rooftop solar paired with batteries how can that actually reduce some of what the utility needs?

Large-scale energy storage batteries are already being used in some limited cases. But energy researchers continue to make improvements to them, too, with cheap solar batteries beginning to make widespread adoption more feasible as scientists race to reduce the expected additional harm of climate change.


Related News

View more

EIA: Pennsylvania exports the most electricity, California imports the most from other states

U.S. Electricity Trade by State, 2013-2017 highlights EIA grid patterns, interstate imports and exports, cross-border flows with Canada and Mexico, net exporters and importers, and market regions like ISOs and RTOs shaping consumption and generation.


Key Points

Brief EIA overview of interstate and cross-border power flows, ranking top net importers and exporters.

✅ Pennsylvania was the largest net exporter, averaging 59 million MWh.

✅ California was the largest net importer, averaging 77 million MWh.

✅ Top cross-border: NY, CA, VT, MN, MI imports; WA, TX, CA, NY, MT exports.


According to the U.S. Energy Information Administration (EIA) State Electricity Profiles, from 2013 to 2017, Pennsylvania was the largest net exporter of electricity, while California was the largest net importer.

Pennsylvania exported an annual average of 59 million megawatt-hours (MWh), while California imported an average of 77 million MWh annually.

Based on the share of total consumption in each state, the District of Columbia, Maryland, Massachusetts, Idaho and Delaware were the five largest power-importing states between 2013 and 2017, highlighting how some clean states import 'dirty' electricity as consumption outpaces local generation. Wyoming, West Virginia, North Dakota, Montana and New Hampshire were the five largest power-exporting states. Wyoming and West Virginia were net power exporting states between 2013 and 2017.

New York, California, Vermont, Minnesota and Michigan imported the most electricity from Canada or Mexico on average from 2013 to 2017, reflecting the U.S. look to Canada for green power during that period. Similarly, Washington, Texas, California, New York, and Montana exported the most electricity to Canada or Mexico, on average, during the same period.

Electricity routinely flows among the Lower 48 states and, to a lesser extent, between the United States and Canada and Mexico. From 2013 to 2017, Pennsylvania was the largest net exporter of electricity, sending an annual average of 59 million megawatthours (MWh) outside the state. California was the largest net importer, receiving an average of 77 million MWh annually.

Based on the share of total consumption within each state, the District of Columbia, Maryland, Massachusetts, Idaho, and Delaware were the five largest power-importing states between 2013 and 2017. Wyoming, West Virginia, North Dakota, Montana, and New Hampshire were the five largest power-exporting states. States with major population centers and relatively less generating capacity within their state boundaries tend to have higher ratios of net electricity imports to total electricity consumption, as utilities devote more to electricity delivery than to power production in many markets.

Wyoming and West Virginia were net power exporting states (they exported more power to other states than they consumed) between 2013 and 2017. Customers residing in these two states are not necessarily at an economic disadvantage or advantage compared with customers in neighboring states when considering their electricity bills and fees and market dynamics. However, large amounts of power trading may affect a state’s revenue derived from power generation.

Some states also import and export electricity outside the United States to Canada or Mexico, even as Canada's electricity exports face trade tensions today. New York, California, Vermont, Minnesota, and Michigan are the five states that imported the most electricity from Canada or Mexico on average from 2013 through 2017. Similarly, Washington, Texas (where electricity production and consumption lead the nation), California, New York, and Montana are the five states that exported the most electricity to Canada or Mexico, on average, for the same period.

Many states within the continental United States fall within integrated market regions, referred to as independent system operators or regional transmission organizations. These integrated market regions allow electricity to flow freely between states or parts of states within their boundaries.

EIA’s State Electricity Profiles provide details about the supply and disposition of electricity for each state, including net trade with other states and international imports and exports, and help you understand where your electricity comes from more clearly.


Related News

View more

Sign Up for Electricity Forum’s Newsletter

Stay informed with our FREE Newsletter — get the latest news, breakthrough technologies, and expert insights, delivered straight to your inbox.

Electricity Today T&D Magazine Subscribe for FREE

Stay informed with the latest T&D policies and technologies.
  • Timely insights from industry experts
  • Practical solutions T&D engineers
  • Free access to every issue

Live Online & In-person Group Training

Advantages To Instructor-Led Training – Instructor-Led Course, Customized Training, Multiple Locations, Economical, CEU Credits, Course Discounts.

Request For Quotation

Whether you would prefer Live Online or In-Person instruction, our electrical training courses can be tailored to meet your company's specific requirements and delivered to your employees in one location or at various locations.