Substation Relay Protection Training
Our customized live online or in‑person group training can be delivered to your staff at your location.

- Live Online
- 12 hours Instructor-led
- Group Training Available
Regular Price:
$699
Coupon Price:
$599
TUCSON
—
TEP Undergrounding Policy prioritizes selective underground power lines to manage wildfire risk, engineering costs, and ratepayer impacts, balancing transmission and distribution reliability with right-of-way, safety, and vegetation management per Arizona regulators.
What's Happening
A selective TEP approach to bury lines where safety, engineering, and cost justify undergrounding.
Selective undergrounding for feeders near substations
Balances wildfire mitigation, reliability, and ratepayer costs
Follows ACC rules, BLM and USFS vegetation management
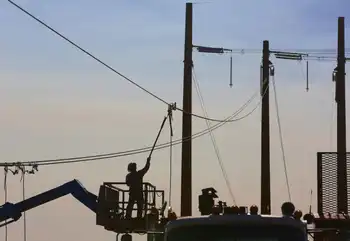
Though wildfires in California caused by power lines have prompted calls for more underground lines, Tucson Electric Power Co. plans to keep to its policy of burying lines selectively for safety.
Like many other utilities, TEP typically doesn’t install its long-range, high-voltage transmission lines, such as the TransWest Express project, and distribution equipment underground because of higher costs that would be passed on to ratepayers, TEP spokesman Joe Barrios said.
But the company will sometimes bury lower-voltage lines and equipment where it is cost-effective or needed for safety as utilities adapt to climate change across North America, or if customers or developers are willing to pay the higher installation costs
Underground installations generally include additional engineering expenses, right-of-way acquisition for projects like the New England Clean Power Link in other regions, and added labor and materials, Barrios said.
“This practice avoids passing along unnecessary costs to customers through their rates, so that all customers are not asked to subsidize a discretionary expenditure that primarily benefits residents or property owners in one small area of our service territory,” he said, adding that the Arizona Corporation Commission has supported the company’s policy.
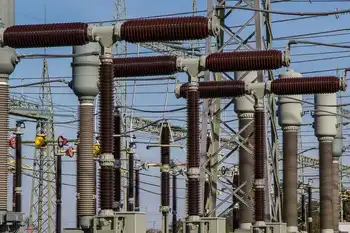
Even so, TEP will place equipment underground in some circumstances if engineering or safety concerns, including electrical safety tips that utilities promote during storm season, justify the additional cost of underground installation, Barrios said.
In fact, lower-voltage “feeder” lines emerging from distribution substations are typically installed underground until the lines reach a point where they can be safely brought above ground, he added.
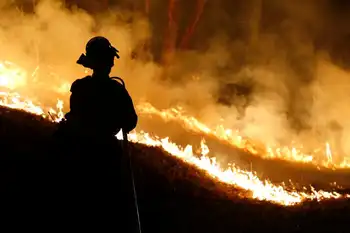
While in California PG&E has shut off power during windy weather to avoid wildfires in forested areas traversed by its power lines after events like the Drum Fire last June, TEP doesn’t face the same kind of wildfire risk, Barrios said.
Most of TEP’s 5,000 miles of transmission and distribution lines aren’t located in heavily forested areas that would raise fire concerns, though large urban systems have seen outages after station fires in Los Angeles, he said.
However, TEP has an active program of monitoring transmission lines and trimming vegetation to maintain a fire-safety buffer zone and address risks from vandalism such as copper theft where applicable, in compliance with federal regulations and in cooperation with the U.S. Bureau of Land Management and the U.S. Forest Service.
Related News
Related News
Cost of US nuclear generation at ten-year low
US Nuclear Generating Costs 2017 show USD33.50/MWh for nuclear energy, the lowest since 2008, as…
View more
PG&E says power lines may have started 2 California fires
PG&E Wildfire Blackouts highlight California power shutoffs as high winds and suspected transmission line faults…
View more
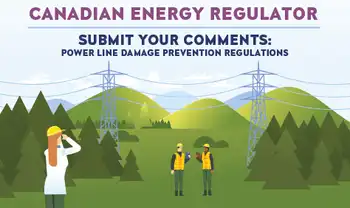
Learn how fees and usage impacts your electricity bill in new online CER tool
CER Interactive Electricity Bill Tool compares provincial electricity prices, fees, taxes, and usage. Explore household…
View more
Ukraine has electricity reserves, no more outages planned if no new strikes
Ukraine Electricity Outages may pause as the grid stabilizes, with energy infrastructure repairs, generators, and…
View more
New EPA power plant rules will put carbon capture to the test
CCUS in the U.S. Power Sector drives investments as DOE grants, 45Q tax credits, and…
View more

Hydro One stock has too much political risk to recommend, Industrial Alliance says
Hydro One Avista merger faces regulatory scrutiny in Washington, Oregon, and Idaho, as political risk…
View more
Sign Up for Electricity Forum’s Newsletter
Stay informed with our FREE Newsletter — get the latest news, breakthrough technologies, and expert insights, delivered straight to your inbox.
Electricity Today T&D Magazine Subscribe for FREE

Stay informed with the latest T&D policies and technologies.
- Timely insights from industry experts
- Practical solutions T&D engineers
- Free access to every issue

