Texas Power Grid Reliability faces ERCOT blackouts and winter storm risks; solutions span weatherization, natural gas coordination, PUC-ERCOT reform, capacity market signals, demand response, grid batteries, and geothermal to maintain resilient electricity supply.
Key Points
Texas Power Grid Reliability is ERCOT's ability to keep electricity flowing during extreme weather and demand spikes.
✅ Weatherize power plants and gas supply to prevent freeze-offs
✅ Merge PUC and Railroad Commission for end-to-end oversight
✅ Pay for firm capacity, demand response, and grid storage
The blackouts in February shined a light on the fragile infrastructure that supports modern life. More and more, every task in life requires electricity, and no one is in charge of making sure Texans have enough.
Of the 4.5 million Texans who lost power last winter, many of them also lost heat and at least 100 froze to death. Wi-Fi stopped working and phones soon lost their charges, making it harder for people to get help, find someplace warm to go or to check in on loved ones.
In some places pipes froze, and people couldn’t get water to drink or flush after power and water failures disrupted systems, and low water pressure left some health care facilities unable to properly care for patients. Many folks looking for gasoline were out of luck; pumps run on electricity.
But rather than scouting for ways to use less electricity, we keep plugging in more things. Automatic faucets and toilets, security systems and locks. Now we want to plug in our cars, so that if the grid goes down, we have to hope our Teslas have enough juice to get to Oklahoma.
The February freeze illuminated two problems with electricity sufficiency. First, power plants had mechanical failures, triggering outages for days. But also, Texans demanded a lot more electricity than usual as heaters kicked on because of the cold. The ugly truth is, the Texas power grid probably couldn’t have generated enough electricity to meet demand, even if the plants kept whirring. And that is what should chill us now.
The stories of the people who died because the electricity went out during the freeze are difficult to read. A paletero and cotton-candy vendor well known in Old East Dallas, Leobardo Torres Sánchez, was found dead in his armchair, bundled in quilts beside two heaters that had no power.
Arnulfo Escalante Lopez, 41, and Jose Anguiano Torres, 28, died from carbon monoxide poisoning after using a gas-powered generator to heat their apartment in Garland.
Pramod Bhattarai, 23, a college student from Nepal, died from carbon monoxide after using a charcoal grill to heat his home in Houston, according to news reports. And Loan Le, 75; Olivia Nguyen, 11; Edison Nguyen, 8; and Colette Nguyen, 5, died in Sugar Land after losing control of a fire they started in the fireplace to keep warm.
A 65-year-old San Antonio man with esophageal cancer died after power outages cut off supply from his oxygen machine. And local Abilene media reported that a man died in a local hospital when a loss of water pressure prevented staff from treating him.
Gloria Jones of Hillsboro, 87, was living by herself, healthy and social. According to the Houston Chronicle, as the cold weather descended, she told her friends and family she was fine. But when her children checked on her after she didn’t answer her phone, they found her on the floor beside her bed. Hospital workers tried to warm her, but they soon pronounced her dead.
Officials said in July that 210 people died because of the freezing weather, including those who died in car crashes and other weather-related causes, but that figure will be updated. The Department of State Health Services said most of those deaths were due to hypothermia.
Policy recommendation: Weatherize power plants and fuel suppliers
Texas could have avoided those deaths if power plants had worked properly. It’s mechanically possible to generate electricity in freezing temperatures; the Swedes and Finns have electricity in winter. But preparing equipment for the winter costs money, and now that the Public Utility Commission set new requirements for plant owners to weatherize equipment, we expect better reliability.
The PUC officials certainly expect better performance. Chairman Peter Lake earlier this month promised: “We go into this winter knowing that because of all these efforts the lights will stay on.”
Yet, there’s no matching requirement to weatherize key fuel supplies for natural gas-fired power plants. While the PUC and the Electric Reliability Council of Texas were busy this year coming up with standards and enforcement processes, the Texas Railroad Commission, which regulates oil and gas production, was not.
The Railroad Commission is working to ensure that natural gas producers who supply power plants have filed the proper paperwork so that they do not lose electricity in a blackout, rendering them unable to provide vital fuel. But weatherization regulations will not happen for some months, not in time for this winter.
Policy recommendation: Combine the state’s Public Utility Commission and Railroad Commission into one energy agency
Electricity and natural gas regulators came to realize the importance of natural gas suppliers communicating their electricity needs with the PUC to avoid getting cut off when the fuel is needed the most. Not last year; they realized this ten years ago, when the same thing happened and triggered a day of rolling outages.
Why did it take a decade for the companies regulated by one agency to get their paperwork in order with a separate agency? It makes more sense for a single agency to regulate the entire energy process, from wellhead to lightbulb. (Or well-to-wheel, as cars increasingly need electricity, too.)
Over the years, various legislative sunset commissions have recommended combining the agencies, with different governance suggestions, none of which passed the Legislature. We urge lawmakers in 2023 to take up the idea in earnest, hammer out the governance details, and make sure the resulting agency has the heft and resources to regulate energy in a way that keeps the industry healthy and holds it accountable.
Policy recommendation: Incentivize building more power plants
Regardless, if energy companies in February had operated their equipment exactly right, the lights likely would have still gone out. Perhaps for a shorter period, perhaps in a more shared way, allowing people to keep homes above freezing and phones charged between rolling blackouts. But Texas was heading for trouble.
Before the winter freeze, ERCOT anticipated Texas would have 74,000 MW of power generation capacity for the winter of 2021. That’s less than the usual summer fleet as some plants go down for maintenance in the winter, but sufficient to meet their wildest predictions of winter electricity demand. The power generation on hand for the winter would have met the historic record winter demand, at 65,918 MW. Even in ERCOT’s planning scenario with extreme generator failures, the grid had enough capacity.
But during the second week of February, as weather forecasts became more dire, grid operators began rapidly hiking their estimates of electricity demand. On Valentine’s Day, ERCOT estimated demand would rise to 75,573 MW in the coming week.
Clearly that is more demand than all of Texas’ winter power generation fleet of 74,000 MW could handle. Demand never reached that level because ERCOT turned off service to millions of customers when power plants failed.
This raises questions about whether the Texas grid has enough power plants to remain resilient as climate change brings more frequent bouts of extreme weather and blackout risks across the U.S. Or if we have enough power to grow, as more people and companies, more homes and businesses and manufacturing plants, move to Texas.
What a shame if the Texas Miracle, our robust and growing economy, died because we ran out of electricity.
This is no exaggeration. In November, ERCOT released its seasonal assessment of whether Texas will have enough electricity resources for the coming winter. If weather is normal, yes, Texas will be in good shape. But if extreme weather again pushes Texas to use an inordinate amount of electricity for heat, and if wind and solar output are low, there won’t be enough. In that scenario, even if power plants mostly continue to operate properly, we should brace for outages.
Further, there are few investors planning to build more power plants in Texas, other than solar and wind. Renewable plants have many good qualities, but reliability isn’t one of them. Some investors are building grid-scale batteries, a technology that promises to add reliability to the grid.
How come power plant developers aren’t building more generators, especially with flat electricity demand in many markets today?
Policy recommendation: Incentivize reliability
The Texas electrical grid, independent of the rest of the U.S., operates as a competitive market. No regulator plans a power plant; investors choose to build plants based on expectations of profit.
How it works is, power generators offer their electricity into the market at the price of their choosing. ERCOT accepts the lowest bids first, working up to higher bids as demand for power increases in the course of a day.
The idea is that Texans always get the lowest possible price, and if prices rise high, investors will build more power plants. Basic supply and demand. When the market was first set up, this worked pretty well, because the big, reliable baseload generators, the coal and nuclear industries, were the cheapest to operate and bid their power at prices that kept them online all the time. The more agile natural gas-fired plants ramped up and down to meet demand minute-by-minute, at higher prices.
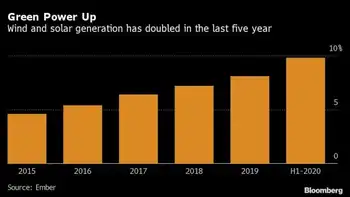
Renewable energy disrupts the market in ways that are great, generating cheap, clean power that has forced some high-polluting coal plants to mothball. But the disruption also undermines reliability. Wind and solar plants are the cheapest and quickest power generation to build and they have the lowest operating cost, allowing them to bid very low prices into the power market. Wind tends to blow hardest in West Texas at night, so the abundance of wind turbines has pushed many of those old baseload plants out of the market.
That’s how markets work, and we’re not crying for coal plant operators. But ERCOT has to figure out how to operate the market differently to keep the lights on.
The PUC announced a slew of electricity market reforms last week to address this very problem, including new to market pricing and an emergency reliability service for ERCOT to contract for more back-up power. These changes cost money, but failing to make any changes could cost more lives.
Texas became the No. 1 wind state thanks in part to a smart renewable energy credit system that created financial incentives to erect wind turbines. But those credits mean that sometimes at night, wind generators bid electricity into the market at negative prices, because they will make money off of the renewable energy credits.
It’s time for the Legislature to review the credit program to determine if it’s still needed, of a similar program could be added to incentivize reliability. The market-based program worked better than anyone could have expected to produce clean energy. Why not use this approach to create what we need now: clean and reliable energy?
We were pleased that PUC commissioners discussed last week an idea that would create a market for reliable power generation capacity by adding requirements that power market participants meet a standard of reliability guarantees.
A market for reliable electricity capacity will cost more, and we hope regulators keep the requirements as modest as possible. Renewable requirements were modest, but turned out to be powerful in a competitive market.
We expect a reliability program to be flexible enough that entrepreneurs can participate with new technology, such as batteries or geothermal energy or something that hasn’t been invented yet, rather than just old reliable fossil fuels.
We also welcome the PUC’s review of pricing rules for the market. Commissioners intend for a new pricing formula to offer early price signals of pending scarcity, to allow time for industrial customers to reduce consumption or suppliers to ramp up. This is intriguing, but we hope the final implementation keeps market interventions at a minimum.
We witnessed in February a scenario in which extremely high prices on the power market did nothing to attract more electricity into the market. Power plants broke down; there was no way to generate more power, no matter how high market prices went. So the PUC was silly to intervene in the market and keep prices artificially high; the outcome was billions of dollars of debt and a proposed electricity market bailout that electricity customers will end up paying.
Nor did this PUC pricing intervention prompt power generation developers to say: “I tell you what, let’s build more plants in Texas.” In the next few years, ERCOT can expect more solar power generation to come online, but little else.
Natural gas plant operators have told the PUC that market price signals show that a new plant wouldn’t be profitable. Natural gas plants are cheaper and faster to build than nuclear reactors; if those developers cannot figure out how to make money, then the prospect of a new nuclear reactor in Texas is a fantasy, even setting aside the environmental and political opposition.
Policy proposal: Use less energy
Politicians like to imagine that technology will solve our energy problem. But the quickest, cheapest, cleanest solution to all of our energy problems is to use less. Investing some federal infrastructure money to make homes more energy efficient would cut energy use, and could help homes retain heat in an emergency.
The PUC’s plan to offer more incentives for major power users to reduce demand in a grid emergency is a good idea. Bravo – next let’s take this benefit to the masses.
Upgrading building codes to require efficiency for office buildings and apartments can help, and might have prevented the frozen pipes in so many multifamily housing units that left people without water.
When North Texas power-line utility Oncor invested in smart grid technology in past decades, part of the promise was to help users reduce demand when electricity prices rise or in emergencies. A review and upgrade of the smart technology could allow more customers to benefit from discounts in exchange for turning things off when electricity supply is tight.
Problem is, we seem to be going in the opposite direction as consumers. Forget turning off the TV and unplugging the coffee machine as we leave the house each morning; now everything is always-on and always connected to Wi-Fi. Our appliances, electronics and the services that operate them can text us when anything interesting happens, like the laundry finishes or somebody opens the patio door or the first season of Murder She Wrote is available for streaming.
As Texans plug in electric vehicles, we will need even more power generation capacity. Researchers at the University of Texas at Austin estimated that if every Texan switched to an electric vehicle, demand for electricity would rise about 30%.
Texans will need to think realistically and rationally about where that electricity is going to come from. Before we march toward a utopian vision of an all-electric world, we need to make sure we have enough electricity.
Getting this right is a matter of life and death for each of one us and for Texas.
Related News