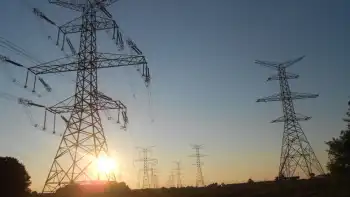
Ontario approves 40 renewable energy projects

By Guelph Mercury


NFPA 70e Training

Our customized live online or in‑person group training can be delivered to your staff at your location.

  • Live Online
  • 6 hours Instructor-led
  • Group Training Available
Regular Price:
$199
Coupon Price:
$149
Reserve Your Seat Today
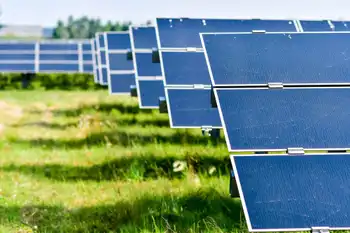
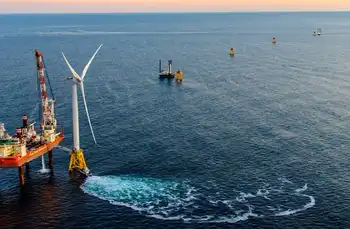
Forty new green energy projects — mostly solar and wind power — have been given the go-ahead by the Ontario government.

Energy minister Brad Duguid said that four large wind projects, totalling 615 megawatts of power have been approved, along with 35 solar projects totalling 257 megawatts, and one 500-kilowatt water project.

But the announcement may upset hundreds of proponents of smaller solar projects, who have been told that their projects have been put on hold because they canÂ’t be connected to the electricity system.

Duguid told reporters that the projects, which are large-scale projects, have all been analyzed, and connections are available.

He said the smaller projects are being approved as quickly as possible, but couldnÂ’t give a deadline by which time all the small operators would be connected.

“Their enthusiasm for the program has outpaced the ability to get the transmission and distribution lines upgraded,” Duguid said.

That didnÂ’t sit well with Brian Wilson, whoÂ’s waiting for a connection for his small project near Belleville.

“It’s amazing what they can do with the big ones, and the little guy gets kicked to the curb,” he said. “You’re just a voice in no-where-land.”

The new wind projects will get 13.5 cents a kilowatt hour for their power, while the solar operators will receive 44.3 cents a kilowatt hour.

Duguid hailed the new projects as continuing evidence of the Liberal governmentÂ’s decision to go with clean renewable energy, while it shuts down coal-burning generators.

That won the support of Greenpeace Canada, which compared the clean energy policy with the decision a century ago to develop Niagara Falls rather than building coal plants.

“Wind and solar energy are the new Niagara Falls, as they can do a similar job of replacing polluting power from coal or nuclear plants to power a prosperous Ontario in the twenty-first century,” said Keith Stewart of Greenpeace.

But Conservative MPP Peter Shurman criticized the announcement, saying itÂ’s unclear what the new contracts will cost.

“What we’re going to have to do when we take over government is review all of these contracts, because we don’t even know what they cost,” he told reporters.

When asked whether “reviewing” the contracts might mean tearing them up, Shurman backtracked: “You don’t tear up contracts.”

Conservative leader Tim Hudak, called for a moratorium on “industrial” wind farms, and said local communities should have a say on whether to allow them.

Duguid didnÂ’t provide an overall cost figure for the newly approved projects, but Bruce Sharp of Aegent Energy Advisors estimated the new contracts will push up the cost of power by about $23 a year for a household using 800 megawatt hours a month.

The Liberals have been under fire for electricity price increases, and have tried to soften the criticism by introducing the Ontario Clean Energy Benefit, which gives householders and small businesses a 10 per cent rebate on hydro bills for the next five years.

OntarioÂ’s expanding wind sector has led to some days where strong winds and moderate temperatures have produced awkward power surpluses. Duguid would only say that the Independent Electricity System Operator is working on the issue.

Robert Hornung, president of the Canadian Wind Energy Association, said the new projects will help make Ontario “a leader in green energy production.”

“This is an important announcement in terms of maintaining the momentum and demonstrating an ongoing commitment” to green energy policies, he said.

Related News

UK low-carbon electricity generation stalls in 2019

UK low-carbon electricity 2019 saw stalled growth as renewables rose slightly, wind expanded, nuclear output fell, coal hit record lows, and net-zero targets demand faster deployment to cut CO2 intensity below 100gCO2/kWh.


Key Points

Low-carbon sources supplied 54% of UK power in 2019, up just 1TWh; wind grew, nuclear fell, and coal dropped to 2%.

✅ Wind up 8TWh; nuclear down 9TWh amid outages

✅ Fossil fuels 43% of generation; coal at 2%

✅ Net-zero needs 15TWh per year added to 2030


The amount of electricity generated by low-carbon sources in the UK stalled in 2019, Carbon Brief analysis shows.

Low-carbon electricity output from wind, solar, nuclear, hydro and biomass rose by just 1 terawatt hour (TWh, less than 1%) in 2019. It represents the smallest annual increase in a decade, where annual growth averaged 9TWh. This growth will need to double in the 2020s to meet UK climate targets while replacing old nuclear plants as they retire.

Some 54% of UK electricity generation in 2019 came from low-carbon sources, including 37% from renewables and 20% from wind alone, underscoring wind's leading role in the power mix during key periods. A record-low 43% was from fossil fuels, with 41% from gas and just 2% from coal, also a record low. In 2010, fossil fuels generated 75% of the total.

Carbon Brief’s analysis of UK electricity generation in 2019 is based on figures from BM Reports and the Department for Business, Energy and Industrial Strategy (BEIS). See the methodology at the end for more on how the analysis was conducted.

The numbers differ from those published earlier in January by National Grid, which were for electricity supplied in Great Britain only (England, Wales and Scotland, but excluding Northern Ireland), including via imports from other countries.

Low-carbon low
In 2019, the UK became the first major economy to target net-zero greenhouse gas emissions by 2050, increasing the ambition of its legally binding Climate Change Act.

To date, the country has cut its emissions by around two-fifths since 1990, with almost all of its recent progress coming from the electricity sector.

Emissions from electricity generation have fallen rapidly in the decade since 2010 as coal power has been almost phased out and even gas output has declined. Fossil fuels have been displaced by falling demand and by renewables, such as wind, solar and biomass.

But Carbon Brief’s annual analysis of UK electricity generation shows progress stalled in 2019, with the output from low-carbon sources barely increasing compared to a year earlier.

The chart below shows low-carbon generation in each year since 2010 (grey bars) and the estimated level in 2019 (red). The pale grey bars show the estimated future output of existing low-carbon sources after old nuclear plants retire and the pale red bars show the amount of new generation needed to keep electricity sector emissions to less than 100 grammes of CO2 per kilowatt hour (gCO2/kWh), the UK’s nominal target for the sector.

 Annual electricity generation in the UK by fuel, terawatt hours, 2010-2019. Top panel: fuel by fuel. Bottom panel: cumulative total generation from all sources. Source: BEIS energy trends, BM Reports and Carbon Brief analysis. Chart by Carbon Brief using Highcharts.
As the chart shows, the UK will require significantly more low-carbon electricity over the next decade as part of meeting its legally binding climate goals.

The nominal 100gCO2/kWh target for 2030 was set in the context of the UK’s less ambitious goal of cutting emissions to 80% below 1990 levels by 2050. Now that the country is aiming to cut emissions to net-zero by 2050, that 100gCO2/kWh indicator is likely to be the bare minimum.

Even so, it would require a rapid step up in the pace of low-carbon expansion, compared to the increases seen over the past decade. On average, low-carbon generation has risen by 9TWh each year in the decade since 2010 – including a rise of just 1TWh in 2019.

Given scheduled nuclear retirements and rising demand expected by the Committee on Climate Change (CCC) – with some electrification of transport and heating – low-carbon generation would need to increase by 15TWh each year until 2030, just to meet the benchmark of 100gCO2/kWh.

For context, the 3.2 gigawatt (GW) Hinkley C new nuclear plant being built in Somerset will generate around 25TWh once completed around 2026. The world’s largest offshore windfarm, the 1.2GW Hornsea One scheme off the Yorkshire coast, will generate around 5TWh each year.

The new Conservative government is targeting 40GW of offshore wind by 2030, up from today’s figure of around 8GW. If policies are put in place to meet this goal, then it could keep power sector emissions below 100gCO2/kWh, depending on the actual performance of the windfarms built.

However, new onshore wind and solar, further new nuclear or other low-carbon generation, such as gas with carbon capture and storage (CCS), is likely to be needed if demand is higher than expected, or if the 100gCO2/kWh benchmark is too weak in the context of net-zero by 2050.

The CCC says it is “likely” to “reflect the need for more rapid deployment” of low-carbon towards net-zero emissions in its advice on the sixth UK carbon budget for 2033-2037, due in September.

Trading places
Looking more closely at UK electricity generation in 2019, Carbon Brief’s analysis shows why there was so little growth for low-carbon sources compared to the previous year.

There was another increase for wind power in 2019 (up 8TWh, 14%), with record wind generation as several large new windfarms were completed including the 1.2GW Hornsea One project in October and the 0.6GW Beatrice offshore windfarm in Q2 of 2019. But this was offset by a decline for nuclear (down 9TWh, 14%), due to ongoing outages for reactors at Hunterston in Scotland and Dungeness in Kent.

(Analysis of data held by trade organisation RenewableUK suggests some 0.6GW of onshore wind capacity also started operating in 2019, including the 0.2GW Dorenell scheme in Moray, Scotland.)

As a result of these movements, the UK’s windfarms overtook nuclear for the first time ever in 2019, becoming the country’s second-largest source of electricity generation, and earlier, wind and solar together surpassed nuclear in the UK as momentum built. This is shown in the figure below, with wind (green line, top panel) trading places with nuclear (purple) and gas (dark blue) down around 25% since 2010 but remaining the single-largest source.

 Annual electricity generation in the UK by fuel, terawatt hours, 2010-2019. Top panel: fuel by fuel. Bottom panel: cumulative total generation from all sources. Source: BEIS energy trends, BM Reports and Carbon Brief analysis. Chart by Carbon Brief using Highcharts.
The UK’s currently suspended nuclear plants are due to return to service in January and March, according to operator EDF, the French state-backed utility firm. However, as noted above, most of the UK’s nuclear fleet is set to retire during the 2020s, with only Sizewell B in Suffolk due to still be operating by 2030. Hunterston is scheduled to retire by 2023 and Dungeness by 2028.

Set against these losses, the UK has a pipeline of offshore windfarms, secured via “contracts for difference” with the government, at a series of auctions. The most recent auction, in September 2019, saw prices below £40 per megawatt hour – similar to current wholesale electricity prices.

However, the capacity contracted so far is not sufficient to meet the government’s target of 40GW by 2030, meaning further auctions – or some other policy mechanism – will be required.

Coal zero
As well as the switch between wind and nuclear, 2019 also saw coal fall below solar for the first time across a full year, echoing the 2016 moment when wind outgenerated coal across the UK, after it suffered another 60% reduction in electricity output. Just six coal plants remain in the UK, with Aberthaw B in Wales and Fiddlers Ferry in Cheshire closing in March.

Coal accounted for just 2% of UK generation in 2019, a record-low coal share since centralised electricity supplies started to operate in 1882. The fuel met 40% of UK needs as recently as 2012, but has plummeted thanks to falling demand, rising renewables, cheaper gas and higher CO2 prices.

The reduction in average coal generation hides the fact that the fuel is now often not required at all to meet the UK’s electricity needs. The chart below shows the number of days each year when coal output was zero in 2019 (red line) and the two previous years (blue).

 Cumulative number of days when UK electricity generation from renewable sources has been higher than that from fossil fuels. Source: BEIS energy trends, BM Reports and Carbon Brief analysis. Chart by Carbon Brief using Highcharts.
The 83 days in 2019 with zero coal generation amount to nearly a quarter of the year and include the record-breaking 18-day stretch without the fuel.

Great Britain has been running for a record TWO WEEKS without using coal to generate electricity – the first time this has happened since 1882.

The country’s grid has been coal-free for 45% of hours in 2019 so far.https://www.carbonbrief.org/countdown-to-2025-tracking-the-uk-coal-phase-out …

Coal generation was set for significant reductions around the world in 2019 – including a 20% reduction for the EU as a whole – according to analysis published by Carbon Brief in November.

Notably, overall UK electricity generation fell by another 9TWh in 2019 (3%), bringing the total decline to 58TWh since 2010. This is equivalent to more than twice the output from the Hinkley C scheme being built in Somerset. As Carbon Brief explained last year, falling demand has had a similar impact on electricity-sector CO2 emissions as the increase in output from renewables.

This is illustrated by the fact that the 9TWh reduction in overall generation translated into a 9TWh (6%) cut in fossil-fuel generation during 2019, with coal falling by 10TWh and gas rising marginally.

Increasingly renewable
As fossil-fuel output and overall generation have declined, the UK’s renewable sources of electricity have continued to increase. Their output has risen nearly five-fold in the past decade and their share of the UK total has increased from 7% in 2010 to 37% in 2019.

As a result, the UK’s increasingly renewable grid is seeing more minutes, hours and days during which the likes of wind, solar and biomass collectively outpace all fossil fuels put together, and on some days wind is the main source as well.

The chart below shows the number of days during each year when renewables generated more electricity than fossil fuels in 2019 (red line) and each of the previous four years (blue lines). In total, nearly two-fifths of days in 2019 crossed this threshold.

 Cumulative number of days when the UK has not generated any electricity from coal. Source: BEIS energy trends, BM Reports and Carbon Brief analysis. Chart by Carbon Brief using Highcharts.
There were also four months in 2019 when renewables generated more of the UK’s electricity than fossil fuels: March, August, September and December. The first ever such month came in September 2018 and more are certain to follow.

National Grid, which manages Great Britain’s high-voltage electricity transmission network, is aiming to be able to run the system without fossil fuels by 2025, at least for short periods. At present, it sometimes has to ask windfarm operators to switch off and gas plants to start running in order to keep the electricity grid stable.

Note that biomass accounted for 11% of UK electricity generation in 2019, nearly a third of the total from all renewables. Some two-thirds of the biomass output is from “plant biomass”, primarily wood pellets burnt at Lynemouth in Northumberland and the Drax plant in Yorkshire. The remainder was from an array of smaller sites based on landfill gas, sewage gas or anaerobic digestion.

The CCC says the UK should “move away” from large-scale biomass power plants, once existing subsidy contracts for Drax and Lynemouth expire in 2027.

Using biomass to generate electricity is not zero-carbon and in some circumstances could lead to higher emissions than from fossil fuels. Moreover, there are more valuable uses for the world’s limited supply of biomass feedstock, the CCC says, including carbon sequestration and hard-to-abate sectors with few alternatives.

Methodology
The figures in the article are from Carbon Brief analysis of data from BEIS Energy Trends chapter 5 and chapter 6, as well as from BM Reports. The figures from BM Reports are for electricity supplied to the grid in Great Britain only and are adjusted to include Northern Ireland.

In Carbon Brief’s analysis, the BM Reports numbers are also adjusted to account for electricity used by power plants on site and for generation by plants not connected to the high-voltage national grid. This includes many onshore windfarms, as well as industrial gas combined heat and power plants and those burning landfill gas, waste or sewage gas.

By design, the Carbon Brief analysis is intended to align as closely as possible to the official government figures on electricity generated in the UK, reported in BEIS Energy Trends table 5.1.

Briefly, the raw data for each fuel is in most cases adjusted with a multiplier, derived from the ratio between the reported BEIS numbers and unadjusted figures for previous quarters.

Carbon Brief’s method of analysis has been verified against published BEIS figures using “hindcasting”. This shows the estimates for total electricity generation from fossil fuels or renewables to have been within ±3% of the BEIS number in each quarter since Q4 2017. (Data before then is not sufficient to carry out the Carbon Brief analysis.)

For example, in the second quarter of 2019, a Carbon Brief hindcast estimates gas generation at 33.1TWh, whereas the published BEIS figure was 34.0TWh. Similarly, it produces an estimate of 27.4TWh for renewables, against a BEIS figure of 27.1TWh.

National Grid recently shared its own analysis for electricity in Great Britain during 2019 via its energy dashboard, which differs from Carbon Brief’s figures.


Related News

View more

Berlin urged to remove barriers to PV

Germany Solar Cap Removal would accelerate photovoltaics, storage, and renewables, replacing coal and nuclear during phaseout with 10GW per year toward 162GW by 2030, boosting grid resilience, O&M jobs, and domestic clean energy growth.


Key Points

A policy change to scrap the 52GW limit, enabling 10GW/year PV and storage to replace coal and nuclear capacity.

✅ Scrap 52GW cap to prevent post-2020 market slump

✅ Add 10GW PV annually; scale residential, commercial, grid storage

✅ Create jobs in planning, installation, and O&M through 2030


The German Solar Association (BSW) has called on the government to remove barriers to the development of new solar power capacity in Germany and storage capacity needed to replace coal and nuclear generation that is being phased out.

A 52GW cap should be scrapped, otherwise there is a risk that a market slump will occur in the solar industry after 2020, BSW said, especially as U.S. solar expansion plans signal accelerating global demand.

BSW managing director Carsten Körnig said: “Time is running out, and further delays are irresponsible. The 52GW mark will already be reached within a few months.”
A new report from BSW, in cooperation with Bonn-based marketing and social research company EuPD Research and The smarter E Europe initiative, said 10GW a year is needed as well as an increase in battery storage capacity.

This would lead to cumulative photovoltaic capacity of 162GW and 15GW residential, commercial and grid storage systems by 2030, in line with global renewable records being set, leading to new job opportunities.

The number of jobs in the domestic photovoltaic and storage industries could increase to 78,000 by the end of the next decade from today’s level of 26,400, aligning with forecasts of wind and solar reaching 50% by mid-century, said 'The Energy Transition in the Context of the Nuclear and Coal Phaseout – Perspectives in the Electricity Market to 2040' study.

Job growth would take place for the most part in the fields of planning, installation and operations and maintenance of PV systems, as solar uptake in Poland increases, the report said.

In maintenance alone, employment would increase from 9,200 to 26,000, with additional opened up by tapping into the market potential of medium- to long-term storage systems, alongside changing electricity prices in Northern Europe that favor flexibility, it said.

The report added that industry revenue could grow from €5bn to €12.5bn in the coming decade.

The report was supported by BayWa Re E3/DC, Fronius, Goldbeck Solar, IBC Solar, Panasonic, Sharp, Siemens, Sonnen, Suntech, Tesvolt and Varta.


Related News

View more

Could selling renewable energy be Alberta's next big thing?

Alberta Renewable Energy Procurement is surging as corporate PPAs drive wind and solar growth, with the Pembina Institute and the Business Renewables Centre linking buyers and developers in Alberta's energy-only market near Medicine Hat.


Key Points

A market-led approach where corporations use PPAs to secure wind and solar power from Alberta projects.

✅ Corporate PPAs de-risk projects and lock in clean power.

✅ Alberta's energy-only market enables efficient transactions.

✅ Skilled workforce supports wind, solar, legal, and financing.


Alberta has big potential when it comes to providing renewable energy, advocates say.

The Pembina Institute says the practice of corporations committing to buy renewable energy is just taking off in Canada, and Alberta has both the energy sector and the skilled workforce to provide it.

Earlier this week, a company owned by U.S. billionaire Warren Buffett announced a large new wind farm near Medicine Hat. It has a buyer for the power.

Sara Hastings-Simon, director of the Pembina's Business Renewables Centre, says this is part of a trend.

"We're talking about the practice of corporate institutions purchasing renewables to meet their own electricity demand. And this is a really well-established driver for renewable energy development in the U.S.," she said. "You may be hearing headlines like Google, Apple and others that are buying renewables and we're helping to bring this practice to Canada."

The Business Renewables Centre (BRC) is a not-for-profit working to accelerate corporate and institutional procurement of renewables in Canada. The group held its inaugural all members event in Calgary on Thursday.

Hastings-Simon says shareholders and investors are encouraging more use of solar and wind power in Canada.

"We have over 10 gigawatts of renewable energy projects in the pipeline that are ready for buyers. And so we see multinational companies coming to Canada to start to procure here, as well as Canadian companies understanding that this is an opportunity for them as well," Hastings-Simon said.

"It's really exciting to see business interests driving renewable energy development."

Sara Hastings-Simon is the director of the Pembina Institute's Business Renewables Centre, which seeks to build up Alberta's renewable energy industry. (Mike Symington/CBC)

Hastings-Simon says renewable procurement could help dispel the narrative that it's all about oil and gas in Alberta by highlighting Alberta as a powerhouse for both green energy and fossil fuels in Canada.

She says the practice started with a handful of tech companies in the U.S. and has become more mainstream there, even as Canada remains a solar laggard to some observers, with more and more large companies wanting to reduce their energy footprint.

He says his U.S.-based organization has been working for years to speed up and expand the renewables market for companies that want to address their own sustainability.

"We try and make that a little bit easier by building out a community that can help to really reinforce each other, share lessons learned, best practices and then drive for transactions to have actual material impact worldwide," he said.

"We're really excited to be working with the Pembina group and the BRC Canada team," he said. "We feel our best value for this is just to support them with our experiences and lessons. They've been basically doing the same thing for many years helping to grow and grow and cultivate the market."


Porter says Alberta's market is more than ready.

"There are some precedent transactions already so people know it can work," he said. "The way Alberta is structured, being an energy-only market is useful. And I think that there is a strong ecosystem of both budget developers and service providers … that can really help these transactions get over the line."

As procurement ramps up, Hastings-Simon says Alberta already has the skilled workers needed to fill renewable energy jobs across the province.

"We have a lot of the knowledge that's needed, and that's everybody from the construction down through the legal and financing — all those pieces of building big projects," she said. "We are seeing increasing interest in people that want to become involved in that industry, and so there is increasing demand for training in things like solar power installation and wind technicians."

Hastings-Simon predicts an increase in demand for both the services and the workers.

"As this industry ramps up, we're going to need to have more workers that are active in those areas," she said. "So I think we can see a very nice increase — both the demand and the number of folks that are able to work in this field."


Related News

View more

Why subsidies for electric cars are a bad idea for Canada

EV Subsidies in Canada influence greenhouse-gas emissions based on electricity grid mix; in Ontario and Quebec they reduce pollution, while fossil-fuel grids blunt benefits. Compare costs per tonne with carbon tax and renewable energy policies.


Key Points

Government rebates for electric vehicles, whose emissions impact and cost-effectiveness depend on provincial grid mix.

✅ Impact varies by grid emissions; clean hydro-nuclear cuts CO2.

✅ MEI estimates up to $523 per tonne vs $50 carbon price.

✅ Best value: tax carbon; target renewables, efficiency, hybrids.


Bad ideas sometimes look better, and sell better, than good ones – as with the proclaimed electric-car revolution that policymakers tout today. Not always, or else Canada wouldn’t be the mostly well-run place that it is. But sometimes politicians embrace a less-than-best policy – because its attractive appearance may make it more likely to win the popularity contest, right now, even though it will fail in the long run.

The most seasoned political advisers know it. Pollsters too. Voters, in contrast, don’t know what they don’t know, which is why bad policy often triumphs. At first glance, the wrong sometimes looks like it must be right, while better and best give the appearance of being bad and worst.

This week, the Montreal Economic Institute put out a study on the costs and benefits of taxpayer subsidies for electric cars. They considered the logic of the huge amounts of money being offered to purchasers in the country’s two largest provinces. In Quebec, if you buy an electric vehicle, the government will give you up to $8,000; in Ontario, buying an electric car or truck entitles you to a cheque from the taxpayer of between $6,000 and $14,000. The subsidies are rich because the cars aren’t cheap.

Will putting more electric cars on the road lower greenhouse-gas emissions? Yes – in some provinces, where they can be better for the planet when the grid is clean. But it all depends on how a province generates electricity. In places like Alberta, Saskatchewan, Nova Scotia and Nunavut territory, where most electricity comes from burning fossil fuels, an electric car may actually generate more greenhouse gases than one running on traditional gasoline. The tailpipe of an electric vehicle may not have any emissions. But quite a lot of emissions may have been generated to produce the power that went to the socket that charged it.

A few years ago, University of Toronto engineering professor Christopher Kennedy estimated that electric cars are only less polluting than the gasoline vehicles they replace when the local electrical grid produces a good chunk of its power from renewable sources – thereby lowering emissions to less than roughly 600 tonnes of CO2 per gigawatt hour.

Unfortunately, the electricity-generating systems in lots of places – from India to China to many American states – are well above that threshold. In those jurisdictions, an electric car will be powered in whole or in large part by electricity created from the burning of a fossil fuel, such as coal. As a result, that car, though carrying the green monicker of “electric,” is likely to be more polluting than a less costly model with an internal combustion or hybrid engine.

The same goes for the Canadian juridictions mentioned above. Their electricity is dirtier, so operating an electric car there won’t be very green. Alberta, for example, is aiming to generate 30 per cent of its electricity from renewable sources by 2030 – which means that the other 70 per cent of its electricity will still come from fossil fuels. (Today, the figure is even higher.) An Albertan trading in a gasoline car for an electric vehicle is making a statement – just not the one he or she likely has in mind.

In Ontario and Quebec, however, most electricity is generated from non-polluting sources, even though Canada still produced 18% from fossil fuels in 2019 overall. Nearly all of Quebec’s power comes from hydro, and more than 90 per cent of Ontario’s electricity is from zero-emission generation, mainly hydro and nuclear. British Columbia, Manitoba and Newfoundland and Labrador also produce the bulk of their electricity from hydro. Electric cars in those provinces, powered as they are by mostly clean electricity, should reduce emissions, relative to gas-powered cars.

But here’s the rub: Electric cars are currently expensive, and, as a recent survey shows, consequently not all that popular. Ontario and Quebec introduced those big subsidies in an attempt to get people to buy them. Those subsidies will surely put more electric cars on the road and in the driveways of (mostly wealthy) people. It will be a very visible policy – hey, look at all those electrics on the highway and at the mall!

However, that result will be achieved at great cost. According to the MEI, for Ontario to reach its goal of electrics constituting 5 per cent of new vehicles sold, the province will have to dish out up to $8.6-billion in subsidies over the next 13 years.

And the environmental benefits achieved? Again, according to the MEI estimate, that huge sum will lower the province’s greenhouse-gas emissions by just 2.4 per cent. If the MEI’s estimate is right, that’s far too many bucks for far too small an environmental bang.

Here’s another way to look at it: How much does it cost to reduce greenhouse-gas emissions by other means? Well, B.C.’s current carbon tax is $30 a tonne, or a little less than 7 cents on a litre of gasoline. It has caused GHG emissions per unit of GDP to fall in small but meaningful ways, thanks to consumers and businesses making millions of little, unspectacular decisions to reduce their energy costs. The federal government wants all provinces to impose a cost equivalent to $50 a tonne – and every economic model says that extra cost will make a dent in greenhouse-gas emissions, though in ways that will not involve politicians getting to cut any ribbons or hold parades.

What’s the effective cost of Ontario’s subsidy for electric cars? The MEI pegs it at $523 per tonne. Yes, that subsidy will lower emissions. It just does so in what appears to be the most expensive and inefficient way possible, rather than the cheapest way, namely a simple, boring and mildly painful carbon tax.

Electric vehicles are an amazing technology. But they’ve also become a way of expressing something that’s come to be known as “virtue signalling.” A government that wants to look green sees logic in throwing money at such an obvious, on-brand symbol, or touting a 2035 EV mandate as evidence of ambition. But the result is an off-target policy – and a signal that is mostly noise.


Related News

View more

Congressional Democrats push FERC to act on aggregated DERs

FERC DER Aggregation advances debates over distributed energy resources as Congress presses action on Order 841, grid resilience, and wholesale market access, including rooftop solar, storage, and virtual power plant participation across PJM and ISO-NE.


Key Points

FERC DER Aggregation enables grouped distributed resources to join wholesale markets, providing capacity and flexibility.

✅ Opens wholesale market access for aggregated DER portfolios

✅ Aligns with Order 841, storage, and grid resilience goals

✅ Raises jurisdictional questions between FERC and state regulators


The Monday letter from Congressional Democrats illustrates growing frustration in Washington over the lack of FERC action on multiple power sector issues, including the aging U.S. grid and related challenges.

Last May, after the FERC technical conference, 16 Democratic Senators wrote to then-Chairman Kevin McIntyre urging him to develop guidance for grid operators on aggregated DERs.

In July, McIntyre responded, saying that FERC was "diligently reviewing the record," but the commission has taken no action since.

Since then, "DER adoption and renewable energy aggregation have continued to grow," House and Senate lawmakers wrote in their identical Monday letters, "driven not only by state and federal policies, but consumer interest in choosing cost-competitive technologies such as rooftop solar, smart thermostats and customer-sited energy generation and storage, reflecting key utility trends in the sector."

The lawmakers wrote they were "encouraged" by FERC Chairman Neil Chatterjee's comments in June 2018, writing that he "specifically cited the role DERs will play in our continued grid transition."

In that speech at the S&P Global Platts 2018 Transmission Planning and Development Conference, Chatterjee noted "growing interest" in non-transmission alternatives, including "DERs and storage."

"How the Commission treats filings associated with those first-of-kind projects could prove an important factor in investors’ assessments of whether similar non-traditional projects are bankable or not — and more broadly signal whether FERC is open to innovation in the transmission sector,” he said.

In addition to the DER order and rehearing decision on Order 841, FERC has multiple other power sector initiatives that have not seen official action in months, even as major changes to electricity pricing are debated by stakeholders.

The highest profile is its open proceeding on grid resilience, set up last January after FERC rejected a coal and nuclear bailout proposal from the Department of Energy. In October, the CEO of the PJM Interconnection, the nation’s largest wholesale power market, urged FERC to issue a final order in the docket, calling for "leadership" from the commission.

Chatterjee, however, has not indicated when FERC could decide on the case. In December, Commissioner Rich Glick told a Washington audience he is "not entirely sure where the chairman wants to go with that proceeding yet."

Outside of resilience, FERC also has open reviews of both its pipeline certificate policy and implementation of the Public Utilities Regulatory Policy Act, a key law supporting renewable energy. McIntrye set those reviews in motion during his tenure as chairman, but after his death in January the timing of both remains unclear.

In recent months, Chatterjee has also delayed FERC votes on major export facilities for liquefied natural gas and a political spending case involving PJM after impasses between Republicans and Democrats on FERC.

Two members from each party currently sit on the commission. That allows Democrats to deadlock commission votes on natural gas facilities and other issues — a partisan divide on display this week when they clashed with the chairman over offshore wind.

As the commission considers final guidance on DERs, the boundaries of federal jurisdiction are likely to be a key issue. At the technical conference, states from the Midcontinent ISO argued FERC should allow them to choose whether to let aggregated DERs participate in retail and wholesale markets. Other states argued the value proposition of distributed resources may rely on that sort of dual participation.

Despite the lack of action from FERC, some grid operators are moving forward with aggregated distributed resources in New England market reform efforts and elsewhere, demonstrating momentum. Last week, a residential solar-plus-storage aggregation cleared the ISO-NE capacity auction for the first time, committing to provide 20 MW of capacity beginning in 2022.

On the Senate side, Sens. Sheldon Whitehouse, R.I., and Ed Markey, Mass., led the letter to FERC. In the House, Reps. Peter Welch, Vt., and Mike Levin, Calif., led the signatories.


Related News

View more

"It's freakishly cold": Deep freeze slams American energy sector

Texas Deep Freeze Energy Crisis strains grids as polar vortex triggers rolling blackouts, record natural gas and electricity prices, refinery shutdowns, WTI gains, and scarcity pricing across Texas, Oklahoma, SPP, and Mexico.


Key Points

A polar vortex slamming Texas energy: outages, record power prices, gas spikes, and reduced oil output.

✅ Record gas trades near $500/mmBtu; power hits $6,000/MWh

✅ WTI tops $60 as Texas shuts in ~1 million bpd

✅ Rolling blackouts across SPP; ERCOT scarcity pricing


A deep freeze is roiling electricity markets in more than a dozen U.S. states, leading to record-setting prices for electricity and natural gas, knocking oil production off line and shutting down some of North America’s largest refineries.

“It’s freakishly cold,” said Eric Fell, a senior natural gas analyst with Wood Mackenzie in Houston, where record cold temperatures and snow have blanketed the city, caused rolling power outages, shut down refineries and sent both natural gas and electricity prices soaring.

'It’s freakishly cold': Deep freeze slams North American energy sector

The polar vortex has led to freezing temperatures in every county in Texas, the largest energy-producing state in the U.S., and caused massive disruptions across the North American energy complex, triggering Texas power outages as far south as Mexico.

As the plunge in temperatures forced oil companies to shut in an estimated one million barrels of oil production in Texas on Monday, the West Texas Intermediate benchmark price rose above the US$60 per barrel threshold for the first time in a year to settle up 1 per cent, or US65 cents, at US$60.12 per barrel.

President Joe Biden declared an emergency on Monday, unlocking federal assistance to Texas.

People carry groceries from a local gas station on Monday in Austin, Texas. Winter storm Uri has brought historic cold weather to Texas, causing traffic delays and power outages. 

Frozen wind farms are just a small piece of Texas’s power grid woes right now.

Fell said regional natural gas and electricity prices in Oklahoma and Texas broke U.S. records over the weekend.

On Friday, Oklahoma gas transmission prices averaged US$350 per million British thermal units and Fell said one trade went as high as US$600 per mmBtu. In parts of the Texas panhandle and elsewhere, prices jumped to US$200, “all of which individually would have been new records,” Fell said, noting the previous record was US$160.

On Monday, natural gas for physical delivery in the U.S. was trading for as much as US$500 per mmBtu as demand for the heating and power plant fuel soared.  Spot gas has been trading for hundreds of dollars across the central U.S. since Thursday with a surge in heating demand triggering widespread blackouts and sending electricity prices soaring. The fuel normally trades in the region for less than US$3 per mmBtu.

Similarly, electricity prices in Texas surged to US$6,000 per megawatt hour on Monday, as U.S. power companies grapple with supply-chain constraints, which Fell said is “100 times the normal price.”

“You’re seeing scarcity pricing in power and gas. The only thing that’s different this time is it’s staying there – it’s not just an hour or two hours, it’s the whole day,” he said.

The blast of Arctic cold, which has blanketed Canada and much of the U.S., has created a massive draw on natural gas supplies, used both for home heating and industrial uses like electricity generation.

Little Rock, Ark.-based Southwest Power Pool, which coordinates electricity distribution for parts of 14 states including Oklahoma Kansas, Nebraska and even as far north as North Dakota, announced rolling blackouts across its network on Monday as a result of the power outages.

“In our history as a grid operator, this is an unprecedented event and marks the first time SPP has ever had to call for controlled interruptions of service” SPP’s executive vice-president and chief operating officer Lanny Nickell said in a release, adding the move was “a last resort” to “prevent circumstances from getting worse.”

The frigid conditions have led to a surge in natural gas prices across the continent, including in Alberta where the AECO benchmark price jumped to a seven-year high of $6.36 per thousand cubic feet last week, a price not seen since 2014.

Energy systems in Texas and Oklahoma, which are major energy exporters to other U.S. states, are built to withstand severe heat – not extreme cold. The result is a disruption to the gas supply at exactly the time the U.S. energy system is demanding those molecules.

“Given how far south it’s gone into Texas, this is where you have a lot of gas production that isn’t properly winterized,” said Jeremy McCrea, an analyst with Raymond James covering the natural gas industry.


Related News

View more

Sign Up for Electricity Forum’s Newsletter

Stay informed with our FREE Newsletter — get the latest news, breakthrough technologies, and expert insights, delivered straight to your inbox.

Electricity Today T&D Magazine Subscribe for FREE

Stay informed with the latest T&D policies and technologies.
  • Timely insights from industry experts
  • Practical solutions T&D engineers
  • Free access to every issue

Download the 2025 Electrical Training Catalog

Explore 50+ live, expert-led electrical training courses –

  • Interactive
  • Flexible
  • CEU-cerified