Turning sewage into renewable energy

By New York Times


Electrical Testing & Commissioning of Power Systems

Our customized live online or in‑person group training can be delivered to your staff at your location.

  • Live Online
  • 12 hours Instructor-led
  • Group Training Available
Regular Price:
$599
Coupon Price:
$499
Reserve Your Seat Today
New York CityÂ’s sewage presents a daunting and costly challenge: it creates foul odors and often contaminates waterways.

But the city is now casting its sewage treatment plants and the vast amounts of sludge, methane gas and other byproducts of the wastewater produced by New Yorkers, as an asset — specifically, as potential sources of renewable energy.

For the cityÂ’s Department of Environmental Protection, it is a shift. Until now, the agency has mainly played the role of water utility and environmental steward rather than energy producer.

But like other cities around the country looking to reduce both the costs of sewage treatment and disposal and the heat-trapping greenhouse gases emitted in the process, New York is beginning to look at its waste as an untapped resource.

Heating fuel can be extracted from sludge and butanol, an alternative fuel to gasoline, from the algae generated by wastewater. Sewage treatment plants could sell methane gas to provide power to homes. Such projects represent a more sustainable long-term approach to managing a wastewater treatment process that costs the city about $400 million annually, not including capital investments.

“There’s nothing in here that’s pie in the sky,” Caswell F. Holloway, the city’s commissioner of environmental protection, said of the plan. “While we’re early in the process, it’s real.”

New Yorkers currently produce some 1.3 billion tons of wastewater daily. The agency is seeking vendors to find uses for the resulting daily yield of 1,200 tons of sludge, a residual that is currently sent to landfills in Suffolk County, N.Y., and Virginia.

City officials, who hope to have a contract by 2013, said the solid could be harvested for gases that produce clean energy and could be used in more traditional ways, too, as fertilizer or as paving and building materials.

The biggest potential source of energy, officials said, is the methane gas from sewage treatment plantsÂ’ digesters. About half of the methane produced by the cityÂ’s plants is already used to meet about 20 percent of the energy demands of the cityÂ’s 14 sewage plants, whose electric bills run to a total of about $50 million a year. Now the city wants to market the other half, which is burned off and wasted.

Through a partnership with National Grid that is already in the works, officials said, the Newtown Creek Wastewater Treatment Plant in Brooklyn is expected to add enough methane gas to the cityÂ’s natural gas network next year to heat 2,500 homes.

City environmental officials said they were also seeking private partners to develop a plant to produce both electricity and heat or steam near its Wards Island Wastewater Treatment Plant the power would heat the plant and be sold to the market.

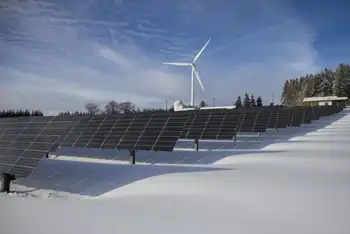
The agency is also studying proposals for solar and wind projects on Staten Island, including one that would place solar panels on the 200,000-square-foot roof of the Port Richmond Wastewater Treatment Plant, and another for a 1.5-megawatt wind turbine at the Oakwood Beach Wastewater Treatment Plant.

“If what you’ve got is lemons, of course you try to make lemonade,” said Eric. A. Goldstein, a lawyer with the Natural Resources Defense Council in New York who monitors the environmental agency. “It’s taking existing infrastructure and outfitting it to help solve other city problems.”

Related News

U.S. Electricity and natural gas prices explained

Energy Pricing Factors span electricity generation, transmission, and distribution costs, plus natural gas supply-demand, renewables, seasonal peaks, and wholesale pricing effects across residential, commercial, and industrial customers, usage patterns, weather, and grid constraints.


Key Points

They are the costs and market forces driving electricity and natural gas prices, from generation to delivery and demand.

✅ Generation, transmission, distribution shape electricity rates

✅ Gas prices hinge on supply, storage, imports/exports

✅ Demand shifts: weather, economy, and fuel alternatives


There are a lot of factors that affect energy prices globally. What’s included in the price to heat homes and supply them with electricity may be a lot more than some people may think.

Electricity
Generating electricity is the largest component of its price, according to the U.S. Energy Information Administration (EIA). Generation accounts for 56% of the price of electricity, while distribution and transmission account for 31% and 13% respectively.

Homeowners and businesses pay more for electricity than industrial companies, and U.S. electricity prices have recently surged, highlighting broader inflationary pressures. This is because industrial companies can take electricity at higher voltages, reducing transmission costs for energy companies.

“Industrial consumers use more electricity and can receive it at higher voltages, so supplying electricity to these customers is more efficient and less expensive. The price of electricity to industrial customers is generally close to the wholesale price of electricity,” EIA explains.

NYSEG said based on the average use of 600 kilowatt-hours per month, its customers spent the most money on delivery and transition charges in 2020, 57% or about $42, and residential electricity bills increased 5% in 2022 after inflation, according to national data. They also spent on average 35% (~$26) on supply charges and 8% (~$6) on surcharges.

Electricity prices are usually higher in the summer. Why? Because energy companies use sources of electricity that cost more money. It used to be that renewable sources, like solar and wind, were the most expensive sources of energy but increased technological advances have changed this, according to the International Energy Agency’s 2021 World Energy Outlook.

“In most markets, solar PV or wind now represents the cheapest available source of new electricity generation. Clean energy technology is becoming a major new area for investment and employment – and a dynamic arena for international collaboration and competition,” the report said.

Natural gas
The price of natural gas is driven by supply and demand. If there is more supply, prices are generally lower. If there is not as much supply, prices are generally higher the EIA explains. On the other side of the equation, more demand can also increase the price and less demand can decrease the price.

High natural gas prices mean people turn their home thermostats down a few degrees to save money, so the EIA said reduced demand can encourage companies to produce more natural gas, which would in turn help lower the cost. Lower prices will sometimes cause companies to reduce their production, therefore causing the price to rise.

The three major supply factors that affect prices: the amount of natural gas produced, how much is stored, and the volume of gas imported and exported. The three major demand factors that affect price are: changes in winter/summer weather, economic growth, and the broader energy crisis dynamics, as well as how much other fuels are available and their price, said EIA.

To think the price of natural gas is higher when the economy is thriving may sound counterintuitive but that’s exactly what happens. The EIA said this is because of increases in demand.


Related News

View more

Why an energy crisis and $5 gas aren't spurring a green revolution

U.S. Energy Transition Delays stem from grid bottlenecks, permitting red tape, solar tariff uncertainty, supply-chain shocks, and scarce affordable EVs, risking deeper fossil fuel lock-in despite climate targets for renewables, transmission expansion, and decarbonization.


Key Points

Delays driven by grid limits, permitting, and supply shocks that slow renewables, transmission, EVs, and decarbonization.

✅ Grid interconnection and transmission backlogs stall renewables

✅ Tariff probes and supply chains disrupt utility-scale solar

✅ Permitting, policy gaps, and EV costs sustain fossil fuel use


Big solar projects are facing major delays. Plans to adapt the grid to clean energy are confronting mountains of red tape. Affordable electric vehicles are in short supply.

The United States is struggling to squeeze opportunity out of an energy crisis that should have been a catalyst for cleaner, domestically produced power. After decades of putting the climate on the back burner, the country is finding itself unprepared to seize the moment and at risk of emerging from the crisis even more reliant on fossil fuels.

10 steps you can take to lower your carbon footprint
The problem is not entirely unique to the United States. Across the globe, climate leaders are warning that energy shortages including coal and nuclear disruptions prompted by Russia’s unprovoked invasion of Ukraine and high gas prices driven by inflation threaten to make the energy transition an afterthought — potentially thwarting efforts to keep global temperature rise under 1.5 degrees Celsius.

“The energy crisis exacerbated by the war in Ukraine has seen a perilous doubling down on fossil fuels by the major economies,” U.N. Secretary General António Guterres said at a conference in Vienna on Tuesday, according to prepared remarks. He warned governments and investors that a failure to immediately and more aggressively embrace clean energy could be disastrous for the planet.

U.S. climate envoy John F. Kerry suggested that nations are falling prey to a flawed logic that fossil fuels will help them weather this period of instability, undermining U.S. national security and climate goals, which has seen gas prices climb to a record-high national average of $5 per gallon. “You have this new revisionism suggesting that we have to be pumping oil like crazy, and we have to be moving into long-term [fossil fuel] infrastructure building,” he said at the Time100 Summit in New York this month. “We have to push back.”

Climate envoy John F. Kerry attends the Summit of the Americas in Los Angeles on June 8. Kerry has criticized the tendency to turn toward fossil fuels in times of uncertainty. (Apu Gomes/AFP/Getty Images)
In the United States — the world’s second-largest emitter of greenhouse gases after China — the hurdles go beyond the supply-chain crisis and sanctions linked to the war in Ukraine. The country’s lofty goals for all carbon pollution to be gone from the electricity sector by 2035 and for half the cars sold to be electric by 2030 are jeopardized by years of neglect of the electrical grid, regulatory hurdles that have set projects back years, and failures by Congress and policymakers to plan ahead.
The challenges are further compounded by plans to build costly new infrastructure for drilling and exporting natural gas that will make it even harder to transition away from the fossil fuel.

“We are running into structural challenges preventing consumers and businesses from going cleaner, even at this time of high oil and gas prices,” said Paul Bledsoe, a climate adviser in the Clinton administration who now works on strategy at the Progressive Policy Institute, a center-left think tank. “It is a little alarming that even now, Congress is barely talking about clean energy.”

Consumers are eager for more wind and solar. Companies looking to go carbon-neutral are facing growing waitlists for access to green energy, and a Pew Research Center poll in late January found that two-thirds of Americans want the United States to prioritize alternative energy over fossil fuel production.

But lawmakers have balked for more than a decade at making most of the fundamental economic and policy changes such as a clean electricity standard that experts widely agree are crucial to an orderly and accelerated energy transition. The United States does not have a tax on carbon, nor a national cap-and-trade program that would reorient markets toward lowering emissions. The unraveling in Congress of President Biden’s $1.75 trillion Build Back Better plan has added to the head winds that green-energy developers face, even as climate law results remain mixed.

Vice President Harris tours electric school buses at Meridian High School in Falls Church, Va., on May 20. (Mandel Ngan/AFP/Getty Images)
“There is literally nothing pushing this forward in the U.S. beyond the tax code and some state laws,” said Heather Zichal, a former White House climate adviser who is now the chief executive of the American Clean Power Association.

The effects of the U.S. government’s halting approach are being felt by solar-panel installers, who saw the number of projects in the most recent quarter fall to the lowest level since the pandemic began. There was 24 percent less solar installed in the first quarter of 2022 than in the same quarter of 2021.

The holdup largely stems from a Commerce Department investigation into alleged tariff-dodging by Chinese manufacturers. Faced with the potential for steep retroactive penalties, hundreds of industrial-scale solar projects were frozen in early April. Weak federal policies to encourage investment in solar manufacturing left American companies ill-equipped to fill the void.

“We shut down multiple projects and had to lay off dozens of people,” said George Hershman, chief executive of SOLV Energy, which specializes in large solar installations. SOLV, like dozens of other solar companies, is now scrambling to reassemble those projects after the administration announced a pause of the tariffs.

Meanwhile, adding clean electricity to the aging power grid has become an increasingly complicated undertaking, given the failure to plan for adequate transmission lines and long delays connecting viable wind and solar projects to the electricity network.


Related News

View more

U.S. Electric Vehicle Market Share Dips in Q1 2024

U.S. EV Market Share Dip Q1 2024 reflects slower BEV adoption, rising PHEV demand, affordability concerns, charging infrastructure gaps, tax credit shifts, range anxiety, and automaker strategy adjustments across the electric vehicle market.


Key Points

Q1 2024 EV and hybrid share slipped as BEV sales lag, PHEVs rise, and affordability and charging concerns temper demand.

✅ BEV share fell to 7.0% as affordable models remain limited

✅ PHEV sales rose 50% YoY, easing range anxiety concerns

✅ Policy shifts and charging gaps weigh on consumer adoption


The U.S. electric vehicle (EV) market, once a beacon of unbridled growth, appears to be experiencing a course correction. Data from the U.S. Energy Information Administration (EIA) reveals that the combined market share of electric vehicles (battery electric vehicles, or BEVs) and hybrids dipped slightly in the first quarter of 2024, marking the first decline since the onset of the COVID-19 pandemic, even as EU EV share rose during lockdowns in 2020.

This news comes as a surprise to many analysts who predicted continued exponential growth for the EV market. While overall sales of electric vehicles surged into 2024 and did increase by 7% compared to Q1 2023, this growth wasn't enough to keep pace with the overall rise in vehicle sales. The result: a decline in market share from 18.8% in Q4 2023 to 18.0% in Q1 2024.

Several factors may be contributing to this shift. One potential culprit is a slowdown in battery electric vehicle sales. BEVs saw their share of the market dip from 8.1% to 7.0% in the same period. This could be attributed to a lack of readily available affordable options, with many popular EV models still commanding premium prices and concerns that EV supply may miss demand in the near term.

Another factor could be the rising interest in plug-in hybrid electric vehicles (PHEVs). PHEV sales witnessed a significant jump of 50% year-over-year, reflecting how gas-electric hybrids are getting a boost from major automakers, potentially indicating a consumer preference for vehicles that offer both electric and gasoline powertrain options, addressing concerns about range anxiety often associated with BEVs.

Industry experts offer mixed interpretations of this data. Some downplay the significance of the dip, attributing it to a temporary blip, even though EVs remain behind gas cars in total sales. They point to the ongoing commitment from major automakers to invest in EV production and the potential for new, more affordable models to hit the market soon.

Others express more concern, citing Europe's recent EV slump and suggesting this might be a sign of maturing consumer preferences. They argue that simply increasing the number of EVs on the market might not be enough. Automakers need to address issues like affordability, charging infrastructure, and range anxiety to maintain momentum.

The role of government incentives also remains a question mark. The federal tax credit for electric vehicles is currently set to phase out gradually, potentially impacting consumer purchasing decisions in the future. Continued government support, through incentives or infrastructure development, could be crucial in maintaining consumer interest.

The coming quarters will be crucial in determining the long-term trajectory of the U.S. EV market, especially after the global electric car market's rapid expansion in recent years. Whether this is a temporary setback or a more lasting trend remains to be seen. Addressing consumer concerns, ensuring a diverse range of affordable EV options, and continued government support will all be essential in ensuring the continued growth of this critical sector.

This development also presents an opportunity for traditional automakers. By capitalizing on the growing PHEV market and addressing consumer concerns about affordability and range anxiety, they can carve out a strong position in the evolving automotive landscape.


Related News

View more

How Ukraine Will Keep the Lights On This Winter

Ukraine Winter Energy Strategy strengthens the power grid through infrastructure repairs, electricity imports, renewable integration, nuclear output, and conservation to ensure reliable heating, blackout mitigation, and grid resilience with international aid, generators, and transmission lines.


Key Points

A wartime plan to stabilize Ukraine's grid via repairs, imports, renewables, and nuclear to deliver reliable electricity.

✅ Repairs, imports, and demand management stabilize the grid.

✅ Renewables and nuclear reduce outage risks in winter.

✅ International aid supplies transformers, generators, expertise.


As Ukraine braces for the winter months, the question of how the country will keep the lights on has become a pressing concern, as the country fights to keep the lights on amid ongoing strikes. The ongoing war with Russia has severely disrupted Ukraine's energy infrastructure, leading to widespread damage to power plants, transmission lines, and other critical energy facilities. Despite these challenges, Ukraine has been working tirelessly to maintain its energy supply during the cold winter months, which are essential not only for heating but also for the functioning of homes, businesses, hospitals, and schools. Here's a closer look at the steps Ukraine is taking to keep the lights on this winter and ensure that its people have access to reliable electricity.

1. Repairing Damaged Infrastructure

One of the most immediate concerns for Ukraine's energy sector is the extensive damage inflicted on its power infrastructure by Russian missile and drone attacks. Since the war began in 2022, Ukraine has faced repeated attacks targeting power plants, substations, and power lines, including strikes on western regions that caused widespread outages across communities. These attacks have left parts of the country with intermittent or no electricity, and repairing the damage has been a monumental task.

However, Ukraine has made significant progress in restoring its energy infrastructure. Government agencies and energy companies have been working around the clock to repair power plants and transmission networks. Teams of technicians and engineers have been deployed to restore power to areas that have been hardest hit by Russian attacks, often under difficult and dangerous conditions. While some areas may continue to face outages, efforts to rebuild the energy grid are ongoing, with the government prioritizing critical infrastructure to ensure that hospitals, military facilities, and essential services have access to power.

2. Energy Efficiency and Conservation Measures

To cope with reduced energy availability and avoid overloading the grid, Ukrainian authorities have been encouraging energy efficiency and conservation measures. These efforts are particularly important during the winter when demand for electricity and heating is at its peak.

The government has implemented energy-saving programs, urging citizens and businesses to reduce their consumption and adopt new energy solutions that can be deployed quickly. Measures include limiting electricity use during peak hours, setting thermostats lower in homes and businesses, and encouraging the use of energy-efficient appliances. Ukrainian officials have also been promoting public awareness campaigns to educate people about the importance of energy conservation, which is crucial to avoid grid overload and ensure the distribution of power across the country.

3. Importing Energy from Abroad

To supplement domestic energy production, Ukraine has been working to secure electricity imports from neighboring countries. Ukraine has long been interconnected with energy grids in countries such as Poland, Slovakia, and Hungary, which allows it to import electricity during times of shortage. In recent months, Ukraine has ramped up efforts to strengthen these connections, ensuring that it can import electricity when domestic production is insufficient to meet demand, and in a notable instance, helped Spain during blackouts through coordinated cross-border support.

While electricity imports from neighboring countries provide a temporary solution, this is not without its challenges. The cost of importing electricity can be high, and the country’s ability to import large amounts of power depends on the availability of energy in neighboring nations; officials say there are electricity reserves and no scheduled outages if strikes do not resume. Ukraine has been actively seeking new energy partnerships and working with international organizations to secure access to electricity, including exploring the potential for importing energy from the European Union.

4. Harnessing Renewable Energy Sources

Another key part of Ukraine's strategy to keep the lights on this winter is tapping into renewable energy sources, particularly wind and solar power. While Ukraine’s energy sector has historically been dependent on fossil fuels, the country has been making strides in integrating renewable energy into its grid. Solar and wind energy are particularly useful in supplementing the national grid, especially during the winter months when demand is high.

Renewable energy sources are less vulnerable to missile strikes compared to traditional power plants, making them an attractive option for Ukraine's energy strategy. Although renewable energy currently represents a smaller portion of Ukraine’s overall energy mix, its contribution is expected to increase as the country invests more in clean energy infrastructure. In addition to reducing dependence on fossil fuels, this shift is aligned with Ukraine’s broader environmental goals and will be important for the long-term sustainability of its energy sector.

5. International Aid and Support

International support has been crucial in helping Ukraine keep the lights on during the war. Western allies, including the European Union and the United States, have provided financial assistance, technical expertise, and equipment to help restore the energy infrastructure, though Washington recently ended some grid restoration support as priorities shifted. In addition to rebuilding power plants and transmission lines, Ukraine has received advanced energy technologies and materials to strengthen its energy security.

The U.S. has sent electrical transformers, backup generators, and other essential equipment to help Ukraine restore its energy grid. The European Union has also provided both financial and technical assistance, supporting Ukraine’s efforts to integrate more renewable energy into its grid and enhancing the country’s ability to import electricity from neighboring states.

6. The Role of Nuclear Energy

Ukraine’s nuclear energy plants play a critical role in the country’s electricity supply. Before the war, nuclear power accounted for around 50% of Ukraine’s total electricity generation, and for communities near the front line, electricity is civilization that depends on reliable baseload. Despite the ongoing conflict, Ukrainian nuclear plants have remained operational, though they face heightened security risks due to the proximity of active combat zones.

In the winter months, nuclear plants are expected to continue providing a significant portion of Ukraine's electricity, which is essential for meeting the country's heating and power needs. The government has made efforts to ensure the safety and security of these plants, which remain a vital part of the country's energy strategy.

Keeping the lights on in Ukraine during the winter of 2024 is no small feat, given the war-related damage to energy infrastructure, rising energy demands, and ongoing security risks. However, the Ukrainian government has taken proactive steps to address these challenges, including repairing critical infrastructure, importing energy from neighboring countries, promoting energy efficiency, and expanding renewable energy sources. International aid and the continued operation of nuclear plants also play a vital role in ensuring a reliable energy supply. While challenges remain, Ukraine’s resilience and determination to overcome its energy crisis are clear, and the country is doing everything it can to keep the lights on through this difficult winter.


Related News

View more

Which of the cleaner states imports dirty electricity?

Hourly Electricity Emissions Tracking maps grid balancing areas, embodied emissions, and imports/exports, revealing carbon intensity shifts across PJM, ERCOT, and California ISO, and clarifying renewable energy versus coal impacts on health and climate.


Key Points

An hourly method tracing generation, flows, and embodied emissions to quantify carbon intensity across US balancing areas.

✅ Hourly traces of imports/exports and generation mix

✅ Consumption-based carbon intensity by balancing area

✅ Policy insights for renewables, coal, health costs


In the United States, electricity generation accounts for nearly 30% of our carbon emissions. Some states have responded to that by setting aggressive renewable energy standards; others are hoping to see coal propped up even as its economics get worse. Complicating matters further is the fact that many regional grids are integrated, and as America goes electric the stakes grow, meaning power generated in one location may be exported and used in a different state entirely.

Tracking these electricity exports is critical for understanding how to lower our national carbon emissions. In addition, power from a dirty source like coal has health and environment impacts where it's produced, and the costs of these aren't always paid by the parties using the electricity. Unfortunately, getting reliable figures on how electricity is produced and where it's used is challenging, even for consumers trying to find where their electricity comes from in the first place, leaving some of the best estimates with a time resolution of only a month.

Now, three Stanford researchers—Jacques A. de Chalendar, John Taggart, and Sally M. Benson—have greatly improved on that standard, and they have managed to track power generation and use on an hourly basis. The researchers found that, of the 66 grid balancing areas within the United States, only three have carbon emissions equivalent to our national average, and they have found that imports and exports of electricity have both seasonal and daily changes. de Chalendar et al. discovered that the net results can be substantial, with imported electricity increasing California's emissions/power by 20%.

Hour by hour
To figure out the US energy trading landscape, the researchers obtained 2016 data for grid features called balancing areas. The continental US has 66 of these, providing much better spatial resolution on the data than the larger grid subdivisions. This doesn't cover everything—several balancing areas in Canada and Mexico are tied in to the US grid—and some of these balancing areas are much larger than others. The PJM grid, serving Pennsylvania, New Jersey, and Maryland, for example, is more than twice as large as Texas' ERCOT, in a state that produces and consumes the most electricity in the US.

Despite these limitations, it's possible to get hourly figures on how much electricity was generated, what was used to produce it, and whether it was used locally or exported to another balancing area. Information on the generating sources allowed the researchers to attach an emissions figure to each unit of electricity produced. Coal, for example, produces double the emissions of natural gas, which in turn produces more than an order of magnitude more carbon dioxide than the manufacturing of solar, wind, or hydro facilities. These figures were turned into what the authors call "embodied emissions" that can be traced to where they're eventually used.

Similar figures were also generated for sulfur dioxide and nitrogen oxides. Released by the burning of fossil fuels, these can both influence the global climate and produce local health problems.

Huge variation
The results were striking. "The consumption-based carbon intensity of electricity varies by almost an order of magnitude across the different regions in the US electricity system," the authors conclude. The low is the Bonneville Power grid region, which is largely supplied by hydropower; it has typical emissions below 100kg of carbon dioxide per megawatt-hour. The highest emissions come in the Ohio Valley Electric region, where emissions clear 900kg/MW-hr. Only three regional grids match the overall grid emissions intensity, although that includes the very large PJM (where capacity auction payouts recently fell), ERCOT, and Southern Co balancing areas.

Most of the low-emissions power that's exported comes from the Pacific Northwest's abundant hydropower, while the Rocky Mountains area exports electricity with the highest associated emissions. That leads to some striking asymmetries. Local generation in the hydro-rich Idaho Power Company has embodied emissions of only 71kg/MW-hr, while its imports, coming primarily from Rocky Mountain states, have a carbon content of 625kg/MW-hr.

The reliance on hydropower also makes the asymmetry seasonal. Local generation is highest in the spring as snow melts, but imports become a larger source outside this time of year. As solar and wind can also have pronounced seasonal shifts, similar changes will likely be seen as these become larger contributors to many of these regional grids. Similar things occur daily, as both demand and solar production (and, to a lesser extent, wind) have distinct daily profiles.

The Golden State
California's CISO provides another instructive case. Imports represent less than 30% of its total electric use in 2016, yet California electricity imports provided 40% of its embodied emissions. Some of these, however, come internally from California, provided by the Los Angeles Department of Water and Power. The state itself, however, has only had limited tracking of imported emissions, lumping many of its sources as "other," and has been exporting its energy policies to Western states in ways that shape regional markets.

Overall, the 2016 inventory provides a narrow picture of the US grid, as plenty of trends are rapidly changing our country's emissions profile, including the rise of renewables and the widespread adoption of efficiency measures and other utility trends in 2017 that continue to evolve. The method developed here can, however, allow for annual updates, providing us with a much better picture of trends. That could be quite valuable to track things like how the rapid rise in solar power is altering the daily production of clean power.

More significantly, it provides a basis for more informed policymaking. States that wish to promote low-emissions power can use the information here to either alter the source of their imports or to encourage the sites where they're produced to adopt more renewable power. And those states that are exporting electricity produced primarily through fossil fuels could ensure that the locations where the power is used pay a price that includes the health costs of its production.


Related News

View more

When will the US get 1 GW of offshore wind on the grid?

U.S. Offshore Wind Capacity is set to exceed 1 GW by 2024, driven by BOEM approvals, federal leases, and resilient supply chains, with eastern states scaling renewable energy, turbines, and content despite COVID-19 disruptions.


Key Points

Projected gigawatt-scale offshore wind growth enabled by BOEM approvals, federal leases, and East Coast state demand.

✅ 17+ GW leased; only 1,870 MW in announced first phases.

✅ BOEM approvals are critical to reach >1 GW by 2024.

✅ Local supply chains mitigate COVID-19 impacts and lower costs.


Offshore wind in the U.S. will exceed 1 GW of capacity by 2024 and add more than 1 GW annually by 2027, a trajectory consistent with U.S. offshore wind power trends, according to a report released last week by Navigant Research.

The report calculated over 17 GW of offshore state and federal leases for wind production, reflecting forecasts that $1 trillion offshore wind market growth is possible. However, the owners of those leases have only announced first phase plans for 1,870 MW of capacity, leaving much of the projects in early stages with significant room to grow, according to senior research analyst Jesse Broehl.

The Business Network for Offshore Wind (BNOW) believes it is possible to hit 1 GW by 2023-24, according to CEO Liz Burdock. While the economy has taken a hit from the coronavirus pandemic, she said the offshore wind industry can continue growing as "the supply chain from Asia and Europe regains speed this summer, and the administration starts clearing" plans of construction.

BNOW is concerned with the economic hardship imposed on secondary and tertiary U.S. suppliers due to the global spread of COVID-19.

Offshore wind has been touted by many eastern states and governors as an opportunity to create jobs, with U.S. wind employment expected to expand, according to industry forecasts. Analysts see the growing momentum of projects as a way to further lower costs by creating a local supply chain, which could be jeopardized by a long-term shutdown and recession.

"The federal government must act now — today, not in December — and approve project construction and operation plans," a recent BNOW report said. Approving any of the seven projects before BOEM, which has recently received new lease requests, currently would allow small businesses to get to work "following the containment of the coronavirus," but approval of the projects next year "may be too late to keep them solvent."

The prospects for maintaining momentum in the industry falls largely to the Department of the Interior's Bureau of Ocean Energy Management (BOEM). The industry cannot hit the 1 GW milestone without project approvals by BOEM, which is revising processes to analyze federal permit applications in the context of "greater build out of offshore wind capacity," according to its website.

"It is heavily dependent on the project approval success," Burdock told Utility Dive.

Currently, seven projects are awaiting determinations from BOEM on their construction operation plans in Massachusetts, New York, where a major offshore wind farm was recently approved, New Jersey and Maryland, with more to be added soon, a BNOW spokesperson told Utility Dive.

To date, only one project has received BOEM approval for development in federal waters, a 12 MW pilot by Dominion Energy and Ørsted in Virginia. The two-turbine project is a stepping stone to a commercial-scale 2.6 GW project the companies say could begin installation as soon as 2024, and gave the developers experience with the permitting process.

In the U.S., developers have the capacity to develop 16.9 GW of offshore wind in federal U.S. lease areas, even as wind power's share of the electricity mix surges nationwide, Broehl told Utility Dive, but much of that is in early stages. The Navigant report did not address any impacts of coronavirus on offshore wind, he said.

Although Massachusetts has legislation in place to require utilities to purchase 1.6 GW of wind power by 2026, and several other projects are in early development stages, Navigant expects the first large offshore wind projects in the U.S. (exceeding 200 MW) will come online in 2022 or later, and the first projects with 400 MW or more capacity are likely to be built by 2024-2025, and lessons from the U.K.'s experience could help accelerate timelines. The U.S. would add about 1.2 GW in 2027, Broehl said.

The federal leasing activities along with the involvement from Eastern states and utilities "virtually guarantees that a large offshore wind market is going to take off in the U.S.," Broehl said.


Related News

View more

Sign Up for Electricity Forum’s Newsletter

Stay informed with our FREE Newsletter — get the latest news, breakthrough technologies, and expert insights, delivered straight to your inbox.

Electricity Today T&D Magazine Subscribe for FREE

Stay informed with the latest T&D policies and technologies.
  • Timely insights from industry experts
  • Practical solutions T&D engineers
  • Free access to every issue

Live Online & In-person Group Training

Advantages To Instructor-Led Training – Instructor-Led Course, Customized Training, Multiple Locations, Economical, CEU Credits, Course Discounts.

Request For Quotation

Whether you would prefer Live Online or In-Person instruction, our electrical training courses can be tailored to meet your company's specific requirements and delivered to your employees in one location or at various locations.