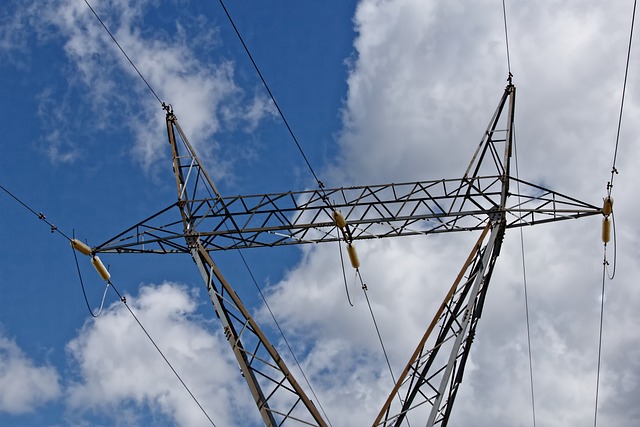
Canada Faces Critical Crunch in Electrical Supply

canada-faces-critical-crunch-electrical-supply

CSA Z462 Arc Flash Training - Electrical Safety Essentials

Our customized live online or in‑person group training can be delivered to your staff at your location.

  • Live Online
  • 6 hours Instructor-led
  • Group Training Available
Regular Price:
$249
Coupon Price:
$199
Reserve Your Seat Today

Canada Electricity Supply Crunch underscores grid reliability risks, aging infrastructure, and rising demand, pushing upgrades in transmission, energy storage, smart grid technology, and renewable energy integration to protect industry, consumers, and climate goals.


Key Points

A nationwide power capacity shortfall stressing the grid, raising outage risks and slowing the renewable transition.

✅ Demand growth and aging infrastructure strain transmission capacity

✅ Smart grid, storage, and interties improve reliability and flexibility

✅ Accelerated renewables and efficiency reduce fossil fuel reliance


Canada, known for its vast natural resources and robust energy sector, is now confronting a significant challenge: a crunch in electrical supply. A recent report from EnergyNow.ca highlights the growing concerns over Canada’s electricity infrastructure, revealing that the country is facing a critical shortage that could impact both consumers and industries alike. This development raises pressing questions about the future of Canada’s energy landscape and its implications for the nation’s economy and environmental goals.

The Current Electrical Supply Dilemma

According to EnergyNow.ca, Canada’s electrical supply is under unprecedented strain due to several converging factors. One major issue is the rapid pace of economic and population growth, particularly in urban centers. This expansion has increased demand for electricity, putting additional pressure on an already strained grid. Compounding this issue are aging infrastructure and a lack of sufficient investment in modernizing the electrical grid to meet current and future needs, with interprovincial frictions such as the B.C. challenge to Alberta's export restrictions further complicating coordination.

The report also points out that Canada’s reliance on certain types of energy sources, including fossil fuels, exacerbates the problem. While the country has made strides in renewable energy, including developments in clean grids and batteries across provinces, the transition has not kept pace with the rising demand for electricity. This imbalance highlights a crucial gap in Canada’s energy strategy that needs urgent attention.

Economic and Social Implications

The shortage in electrical supply has significant economic and social implications. For businesses, particularly those in energy-intensive sectors such as manufacturing and technology, the risk of power outages or unreliable service can lead to operational disruptions and financial losses. Increased energy costs due to supply constraints could also affect profit margins and competitiveness on both domestic and international fronts, with electricity exports at risk amid trade tensions.

Consumers are not immune to the impact of this electrical supply crunch. The potential for rolling blackouts or increased energy prices, as debates over electricity rates and innovation continue nationwide, can strain household budgets and affect overall quality of life. Additionally, inconsistent power supply can affect essential services, including healthcare facilities and emergency services, highlighting the critical nature of reliable electricity for public safety and well-being.

Investment and Infrastructure Upgrades

Addressing the electrical supply crunch requires significant investment in infrastructure and technology, and recent tariff threats have boosted support for Canadian energy projects that could accelerate these efforts. The EnergyNow.ca report underscores the need for modernizing the electrical grid to enhance capacity and resilience. This includes upgrading transmission lines, improving energy storage solutions, and expanding the integration of renewable energy sources such as wind and solar power.

Investing in smart grid technology is also essential. Smart grids use digital communication and advanced analytics to optimize electricity distribution, detect outages, and manage demand more effectively. By adopting these technologies, Canada can better balance supply and demand, reduce the risk of blackouts, and improve overall efficiency in energy use.

Renewable Energy Transition

Transitioning to renewable energy sources is a critical component of addressing the electrical supply crunch. While Canada has made progress in this area, the pace of change needs to accelerate under the new Clean Electricity Regulations for 2050 that set long-term targets. Expanding the deployment of wind, solar, and hydroelectric power can help diversify the energy mix and reduce reliance on fossil fuels. Additionally, supporting innovations in energy storage and grid management will enhance the reliability and sustainability of renewable energy.

The EnergyNow.ca report highlights several ongoing initiatives and projects aimed at increasing renewable energy capacity. However, these efforts must be scaled up and supported by both public policy and private investment to ensure that Canada can meet its energy needs and climate goals.

Policy and Strategic Planning

Effective policy and strategic planning are crucial for addressing the electrical supply challenges, with an anticipated electricity market reshuffle in at least one province signaling change ahead. Government action is needed to support infrastructure investment, incentivize renewable energy adoption, and promote energy efficiency measures. Collaborative efforts between federal, provincial, and municipal governments, along with private sector stakeholders, will be key to developing a comprehensive strategy for managing Canada’s electrical supply.

Public awareness and engagement are also important. Educating consumers about energy conservation practices and encouraging the adoption of energy-efficient technologies can contribute to reducing overall demand and alleviating some of the pressure on the electrical grid.

Conclusion

Canada’s electrical supply crunch is a pressing issue that demands immediate and sustained action. The growing demand for electricity, coupled with aging infrastructure and a lagging transition to renewable energy, poses significant challenges for the country’s economy and daily life. Addressing this issue will require substantial investment in infrastructure, advancements in technology, and effective policy measures. By taking a proactive and collaborative approach, Canada can navigate this crisis and build a more resilient and sustainable energy future.


Related News

Related News

New clean energy investment in developing nations slipped sharply last year: report

Developing Countries Clean Energy investment fell as renewable energy financing slowed in China; solar and wind growth lagged while coal power hit new highs, raising emissions risks for emerging markets and complicating climate change goals.


Key Points

Renewables investment and power trends in emerging nations: solar, wind, coal shifts, and steps toward decarbonization.

✅ Investment fell to $133b; China dropped to $86b

✅ Coal power rose to 6,900 TWh; 47% generation share

✅ New coal builds declined to 39 GW, decade low


New clean energy investment slid by more than a fifth in developing countries last year due to a slowdown in China, while the amount of coal-fired power generation jumped to a new high, reflecting global power demand trends, a recent annual survey showed.

Bloomberg New Energy Finance (BNEF) surveyed 104 emerging markets and found that developing nations were moving towards cleaner, low-emissions sources in many regions, but not fast enough to limit carbon dioxide emissions or the effects of climate change.

New investment in wind, solar and other clean energy projects dropped to $133 billion last year from $169 billion a year earlier, mainly due to a slump in Chinese investment, even as electricity investment globally surpasses oil and gas for the first time, the research showed.

China’s clean energy investment fell to $86 billion from $122 billion a year earlier, with dynamics in China's electricity sector also in focus. Investment by India and Brazil also declined, mainly due to lower costs for solar and wind.

However, the volume of coal-fired power generation produced and consumed in developing countries increased to a new high of 6,900 terrawatt hours (TWh) last year, even as renewables are poised to eclipse coal globally, from 6,400 TWh in 2017.

The increase of 500 TWh is equivalent to the power consumed in the U.S. state of Texas in one year, underscoring how surging electricity demand is putting power systems under strain. Coal accounted for 47% of all power generation across the 104 countries.

“The transition from coal toward cleaner sources in developing nations is underway,” said Ethan Zindler, head of Americas at BNEF. “But like trying to turn a massive oil tanker, it takes time.”

Despite the spike in coal-fired generation, the amount of new coal capacity which was added to the grid in developing countries declined, with Europe's renewables crowding out gas offering a contrasting pathway. New construction of coal plants fell to its lowest level in a decade last year of 39 gigawatts (GW).

The report comes a week ahead of United Nations climate talks in Madrid, Spain, where more than 190 countries will flesh out the details of an accord to limit global warming.


Related News

View more

Which of the cleaner states imports dirty electricity?

Hourly Electricity Emissions Tracking maps grid balancing areas, embodied emissions, and imports/exports, revealing carbon intensity shifts across PJM, ERCOT, and California ISO, and clarifying renewable energy versus coal impacts on health and climate.


Key Points

An hourly method tracing generation, flows, and embodied emissions to quantify carbon intensity across US balancing areas.

✅ Hourly traces of imports/exports and generation mix

✅ Consumption-based carbon intensity by balancing area

✅ Policy insights for renewables, coal, health costs


In the United States, electricity generation accounts for nearly 30% of our carbon emissions. Some states have responded to that by setting aggressive renewable energy standards; others are hoping to see coal propped up even as its economics get worse. Complicating matters further is the fact that many regional grids are integrated, and as America goes electric the stakes grow, meaning power generated in one location may be exported and used in a different state entirely.

Tracking these electricity exports is critical for understanding how to lower our national carbon emissions. In addition, power from a dirty source like coal has health and environment impacts where it's produced, and the costs of these aren't always paid by the parties using the electricity. Unfortunately, getting reliable figures on how electricity is produced and where it's used is challenging, even for consumers trying to find where their electricity comes from in the first place, leaving some of the best estimates with a time resolution of only a month.

Now, three Stanford researchers—Jacques A. de Chalendar, John Taggart, and Sally M. Benson—have greatly improved on that standard, and they have managed to track power generation and use on an hourly basis. The researchers found that, of the 66 grid balancing areas within the United States, only three have carbon emissions equivalent to our national average, and they have found that imports and exports of electricity have both seasonal and daily changes. de Chalendar et al. discovered that the net results can be substantial, with imported electricity increasing California's emissions/power by 20%.

Hour by hour
To figure out the US energy trading landscape, the researchers obtained 2016 data for grid features called balancing areas. The continental US has 66 of these, providing much better spatial resolution on the data than the larger grid subdivisions. This doesn't cover everything—several balancing areas in Canada and Mexico are tied in to the US grid—and some of these balancing areas are much larger than others. The PJM grid, serving Pennsylvania, New Jersey, and Maryland, for example, is more than twice as large as Texas' ERCOT, in a state that produces and consumes the most electricity in the US.

Despite these limitations, it's possible to get hourly figures on how much electricity was generated, what was used to produce it, and whether it was used locally or exported to another balancing area. Information on the generating sources allowed the researchers to attach an emissions figure to each unit of electricity produced. Coal, for example, produces double the emissions of natural gas, which in turn produces more than an order of magnitude more carbon dioxide than the manufacturing of solar, wind, or hydro facilities. These figures were turned into what the authors call "embodied emissions" that can be traced to where they're eventually used.

Similar figures were also generated for sulfur dioxide and nitrogen oxides. Released by the burning of fossil fuels, these can both influence the global climate and produce local health problems.

Huge variation
The results were striking. "The consumption-based carbon intensity of electricity varies by almost an order of magnitude across the different regions in the US electricity system," the authors conclude. The low is the Bonneville Power grid region, which is largely supplied by hydropower; it has typical emissions below 100kg of carbon dioxide per megawatt-hour. The highest emissions come in the Ohio Valley Electric region, where emissions clear 900kg/MW-hr. Only three regional grids match the overall grid emissions intensity, although that includes the very large PJM (where capacity auction payouts recently fell), ERCOT, and Southern Co balancing areas.

Most of the low-emissions power that's exported comes from the Pacific Northwest's abundant hydropower, while the Rocky Mountains area exports electricity with the highest associated emissions. That leads to some striking asymmetries. Local generation in the hydro-rich Idaho Power Company has embodied emissions of only 71kg/MW-hr, while its imports, coming primarily from Rocky Mountain states, have a carbon content of 625kg/MW-hr.

The reliance on hydropower also makes the asymmetry seasonal. Local generation is highest in the spring as snow melts, but imports become a larger source outside this time of year. As solar and wind can also have pronounced seasonal shifts, similar changes will likely be seen as these become larger contributors to many of these regional grids. Similar things occur daily, as both demand and solar production (and, to a lesser extent, wind) have distinct daily profiles.

The Golden State
California's CISO provides another instructive case. Imports represent less than 30% of its total electric use in 2016, yet California electricity imports provided 40% of its embodied emissions. Some of these, however, come internally from California, provided by the Los Angeles Department of Water and Power. The state itself, however, has only had limited tracking of imported emissions, lumping many of its sources as "other," and has been exporting its energy policies to Western states in ways that shape regional markets.

Overall, the 2016 inventory provides a narrow picture of the US grid, as plenty of trends are rapidly changing our country's emissions profile, including the rise of renewables and the widespread adoption of efficiency measures and other utility trends in 2017 that continue to evolve. The method developed here can, however, allow for annual updates, providing us with a much better picture of trends. That could be quite valuable to track things like how the rapid rise in solar power is altering the daily production of clean power.

More significantly, it provides a basis for more informed policymaking. States that wish to promote low-emissions power can use the information here to either alter the source of their imports or to encourage the sites where they're produced to adopt more renewable power. And those states that are exporting electricity produced primarily through fossil fuels could ensure that the locations where the power is used pay a price that includes the health costs of its production.


Related News

View more

Bruce Power cranking out more electricity after upgrade

Bruce Power Capacity Uprate boosts nuclear output through generator stator upgrades, turbine and transformer enhancements, and cooling pump improvements at Bruce A and B, unlocking megawatts and efficiency gains from legacy heavy water design capacity.


Key Points

Upgrades that raise Bruce Power capacity via stator, turbine, transformer, and cooling enhancements.

✅ Generator stator replacement increases electrical conversion efficiency

✅ Turbine and transformer upgrades enable higher MW output

✅ Cooling pump enhancements optimize plant thermal performance


Bruce Power’s Unit 3 nuclear reactor will squeeze out an extra 22 megawatts of electricity, thanks to upgrades during its recent planned outage for refurbishment.

Similar gains are anticipated at its three sister reactors at Bruce A generating station, which presents the opportunity for the biggest efficiency gains and broader economic benefits for Ontario, due to a design difference over Bruce B’s four reactors, Bruce Power spokesman John Peevers said.

Bruce A reactor efficiency gains stem mainly from the fact Bruce A’s non-nuclear side, including turbines and the generator, was sized at 88 per cent of the nuclear capacity, Peevers said, while early Bruce C exploration work advances.

This allowed 12 per cent of the energy, in the form of steam, to be used for heavy water production, which was discontinued at the plant years ago. Heavy water, or deuterium, is used to moderate the reactors.

That design difference left a potential excess capacity that Bruce Power is making use of through various non-nuclear enhancements. But the nuclear operator, which also made major PPE donations during the pandemic, will be looking at enhancements at Bruce B as well, Peevers said.

Bruce Power’s efficiency gain came from “technology advancements,” including a “generator-stator improvement project that was integral to the uprate,” and contributed to an operating record at the site, a Bruce Power news release said July 11.

Peevers said the stationary coils and the associated iron cores inside the generator are referred to as the stator. The stator acts as a conductor for the main generator current, while the turbine provides the mechanical torque on the shaft of the generator.

“Some of the other things we’re working on are transformer replacement and cooling pump enhancements, backed by recent manufacturing contracts, which also help efficiency and contribute to greater megawatt output,” Peevers said.

The added efficiency improvements raised the nuclear operator’s peak generating capacity to 6,430 MW, as projects like Pickering life extensions continue across Ontario.


Related News

View more

WY Utility's First Wind Farm Faces Replacement

Foote Creek I Wind Farm Repowering upgrades Wyoming turbines with new nacelles, towers, and blades, cutting 68 units to 12 while sustaining 41.6 MW, under PacifiCorp and Rocky Mountain Power's Energy Vision 2020 plan.


Key Points

Replacement at Foote Creek Rim I, cutting to 12 turbines while sustaining about 41.6 MW using modern 2-4.2 MW units.

✅ 12 turbines replace 68, output steady near 41.6 MW

✅ New nacelles, towers, blades; taller 500 ft turbines

✅ Part of PacifiCorp Energy Vision 2020 and Gateway West


A Wyoming utility company has filed a permit to replace its first wind farm—originally commissioned in 1998, composed of over 65 turbines—amid new gas capacity competing with nuclear in Ohio, located at Foote Creek Rim I. The replacement would downsize the number of turbines to 12, which would still generate roughly the same energy output.

According to the Star Tribune, PacifiCorp’s new installation would involve new nacelles, new towers and new blades. The permit was filed with Carbon County.


New WY Wind Farm

The replacement wind turbines will stand more than twice as tall as the old: Those currently installed stand 200 feet tall, whereas their replacements will tower closer to 500 feet. Though this move is part of the company’s overall plan to expand its state wind fleet as some utilities respond to declining coal returns in the Midwest, the work going into the Foote Creek site is somewhat special, noted David Eskelsen, spokesperson for Rocky Mountain Power, the western arm of PacifiCorp.

“Foote Creek I repowering is somewhat different from the repowering projects announced in the (Energy Vision) 2020 initiative,” he said. “Foote Creek is a complete replacement of the existing 68 foundations, towers, turbine nacelles and rotors (blades).”

Currently, the turbines at Foote Creek have 600 kilowatts capacity each; the replacements’ maximum production ranges from 2 megawatts to 4.2 megawatts each, with the total output remaining steady at 41.4 megawatts, a scale similar to a 30-megawatt wind expansion in Eastern Kings, though there will be a slight capacity increase to 41.6 megawatts, according to the Star Tribune.

As part of the wind farm repowering initiative, PacifiCorp is to become full owner and operator of the Foote Creek site. When the farm was originally built, an Oregon-based water and electric board was 21 percent owner; 37 percent of the project’s output was tied into a contract with the Bonneville Power Administration.

Otherwise, PacifiCorp is moving to further expand its state wind fleet in line with initiatives like doubling renewable electricity by 2030 in Saskatchewan, with the addition of three new wind farms—to be located in Carbon, Albany and Converse counties—which may add up to 1,150 megawatts of power.

According to PacifiCorp, the company has more than 1,000 megawatts of owned wind generation capability, along with long-term purchase agreements for more than 600 megawatts from other wind farms owned by other entities. Energy Vision 2020 refers to a $3.5 billion investment and company move that is looking to upgrade the company's existing wind fleet with newer technology, adding 1,150 megawatts of new wind resources by 2020 and a a new 140-mile Gateway West transmission segment in Wyoming, comparable to a transmission project in Missouri just energized.


Related News

View more

Trump's Canada Tariff May Spike NY Energy Prices

25% Tariff on Canadian Imports threatens New York energy markets, disrupting hydroelectric power and natural gas supply chains, raising electricity prices, increasing gas costs, and intensifying trade tensions, policy uncertainty, and cross-border logistics risks.


Key Points

A U.S. policy imposing 25% duties on Canadian goods, risking higher New York electricity and natural gas costs.

✅ Hydroelectric and gas imports face costlier cross-border flows

✅ Higher utility bills for NY households and businesses

✅ Supply chain volatility and policy uncertainty increase


President Donald Trump announced the imposition of a 25% tariff on all imports from Canada, citing concerns over drug trafficking and illegal immigration. This decision has raised significant concerns among experts and residents in New York, who warn that the tariff could lead to increased electricity and gas prices in the state.

Impact on New York's Energy Sector

New York relies heavily on energy imports from Canada, particularly electricity and natural gas. Canada is a major supplier of hydroelectric power to the northeastern United States, including New York, with its electricity exports at risk amid trade tensions. The imposition of a 25% tariff on Canadian goods could disrupt this supply chain, leading to higher energy costs for consumers and businesses in New York. Justin Wilcox, an energy analyst, stated, "If the tariff is implemented, it could lead to increased costs for electricity and gas, affecting both consumers and businesses."

Potential Economic Consequences

The increased energy costs could have broader economic implications for New York, and some experts advise against cutting Quebec's exports to avoid exacerbating market volatility. Higher electricity and gas prices may lead to increased operational costs for businesses, potentially resulting in higher prices for goods and services, while tariff threats have boosted support for Canadian energy projects that could reshape regional supply. This could exacerbate the cost-of-living challenges faced by residents and strain the state's economy.

Political and Diplomatic Reactions

The tariff has also sparked political and diplomatic reactions, including threats to cut U.S. electricity exports from Ontario that raised tensions. New York Governor Kathy Hochul expressed concern over the potential economic impact, stating, "We are closely monitoring the situation and are prepared to take necessary actions to protect New York's economy." Additionally, Canadian officials have expressed their disapproval of the tariff, and Ontario Premier Doug Ford's Washington meeting underscored ongoing discussions, emphasizing the importance of the trade relationship between the two countries.

Historical Context

This development is part of a broader pattern of trade tensions between the United States and its neighbors. In 2018, the U.S. imposed tariffs on Canadian steel and aluminum, leading to retaliatory measures from Canada. The current situation underscores the ongoing challenges in international trade relations, where a recent tariff threat delayed Quebec's green energy bill and highlighted the potential domestic impacts of such policies.

The imposition of a 25% tariff on Canadian imports by President Trump has raised significant concerns in New York regarding potential increases in electricity and gas prices. Experts warn that this could lead to higher costs for consumers and businesses, with broader economic implications for the state. As the situation develops, it will be crucial to monitor the responses from both state and federal officials, as well as how Canadians support tariffs on energy and minerals may influence policy, and the potential for diplomatic negotiations to address these trade tensions.


Related News

View more

Consumers Coalition wants Manitoba Hydro?s proposed rate increase rejected

Manitoba Hydro Interim Rate Increase faces PUB scrutiny as consumers coalition challenges a 5% electricity rate hike, citing drought planning, retained earnings, affordability, transparency, and impacts on fixed incomes and northern communities.


Key Points

A proposed 5% electricity rate hike under PUB review, opposed by consumers citing drought planning and affordability.

✅ Coalition backs 2% hike; 5% seen as undue burden

✅ PUB review sought; interim process lacks transparency

✅ Retained earnings, efficiencies cited to offset drought


The Consumers Coalition is urging the Public Utilities Board (PUB) to reject Manitoba Hydro’s current interim rate increase application, amid ongoing debates about Hydro governance and policy.

Hydro is requesting a five per cent jump in electricity rates starting on January 1, claiming drought conditions warrant the increase but the coalition disagrees, saying a two per cent increase would be sufficient.

The coalition, which includes Harvest Manitoba, the Consumers’ Association of Canada-Manitoba, and the Aboriginal Council of Winnipeg, said a 5 per cent rate increase would put an unnecessary strain on consumer budgets, especially for those on fixed incomes or living up north.

"We feel that, in many ways, Manitobans have already paid for this drought," said Gloria Desorcy, executive director of the Consumers’ Association of Canada - Manitoba.

The coalition argues that hydroelectric companies already plan for droughts and that hydro should be using past earnings to mitigate any losses.

The group claims drought conditions would have added about 0.8 per cent to Hydro’s bottom line. They said remaining revenues from a two per cent increase could then be used to offset the increased costs of major projects like the Keeyask generating station and service its growing debt obligations.

The group also said Hydro is financially secure and is projecting a positive net income of $112 million next year without rate increases, even as utility profits can swing with market conditions, assuming the drought doesn’t continue.

They argue Hydro can use retained earnings as a tool to mitigate losses, rather than relying on deferral accounting that shifts costs, and find further efficiencies within the corporation.

"So we said two per cent, which is much more palatable for consumers especially at the time when so many consumers are struggling with so many higher bills,” said Desorcy.

According to the coalition’s calculations, that works out to a $2-4 increase per month, and debates such as ending off-peak pricing in Ontario show how design affects bills, depending on whether electricity is used for heating, but it could be higher.

The coalition said their proposed two per cent rate increase should be applied to all Manitoba Hydro customers and have a set expiration date of January 1, 2023.

Another issue, according to the coalition, is the process of an interim rate application does not provide any meaningful transparency and accountability, whereas recent OEB decisions in Ontario have outlined more robust public processes.

Desorcy said the next step is up to the PUB, though board upheaval at Hydro One in Ontario shows how governance shifts can influence outcomes.

The board is expected to decide on the proposed increase in the next couple of weeks.


Related News

View more

Sign Up for Electricity Forum’s Newsletter

Stay informed with our FREE Newsletter — get the latest news, breakthrough technologies, and expert insights, delivered straight to your inbox.

Electricity Today T&D Magazine Subscribe for FREE

Stay informed with the latest T&D policies and technologies.
  • Timely insights from industry experts
  • Practical solutions T&D engineers
  • Free access to every issue

Live Online & In-person Group Training

Advantages To Instructor-Led Training – Instructor-Led Course, Customized Training, Multiple Locations, Economical, CEU Credits, Course Discounts.

Request For Quotation

Whether you would prefer Live Online or In-Person instruction, our electrical training courses can be tailored to meet your company's specific requirements and delivered to your employees in one location or at various locations.