Gaining power from the sun

By Needles Desert Star


Substation Relay Protection Training

Our customized live online or in‑person group training can be delivered to your staff at your location.

  • Live Online
  • 12 hours Instructor-led
  • Group Training Available
Regular Price:
$699
Coupon Price:
$599
Reserve Your Seat Today
As she looks toward retirement, Kippy Poulson is planning for a future with lower electric bills.

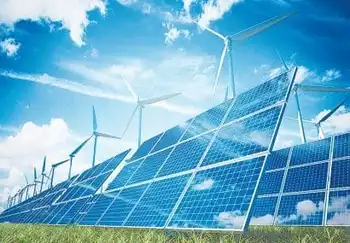
On Dec. 18, 24 photo-voltaic panels on the roof of a barn in Poulson's back yard were connected to the grid-tied electrical service panel of her home on the south side of Needles.

The panels are expected to generate 60 to 65 percent of Poulson's electricity needs annually. She wants to make sure that she will be able to afford her electric bill after retirement.

“I feel that electricity is just going to keep getting worse and worse and worse,” said Poulson. “I might as well start now.”

The system Poulson installed consists of 24 panels, capable of generating 208 watts of direct current each. The panels are connected to an inverter, which turns the DC power into alternating current, that appliances in the house can use. The inverter then feeds the power into the house's electric service panel.

When the sun is shining and Poulson is not using all the juice, her electrical meter will run backwards building credit with the utility department.

The system was not cheap, but Poulson expects to make her money back before long. “I expect it'll take 15 to 25 years,” she said. “But, it could be 10 years if power keeps going up out of sight.”

Glenn Roehl, of Bare Land Developers/Sunquest Solar, installed the system.

Systems costs around $8 per watt, installed, with a minimum of approximately 2,000 watts, according to Roehl.

“This system came out to just under $40,000,” said Roehl.

The system took more than a month to plan out and two days to install. Luckily, Poulson had a large south-facing pitched roof to install the panels on. “For her particular application, this is a perfect set up,” said Roehl.

Photo-voltaic systems are tailored for individual user's needs and the space available. “What I do,” said Roehl, “is look at the energy consumption of the home owner, and then look at how much energy they want to save.”

Once he figures out how much energy the customer wants, Roehl can look at the space required to generate the energy and begin to design a system.

The panels on Poulson's house take up 400 square feet on the back roof of her barn, and are completely out of sight from the house. “I was lucky, because I have the perfect roof for it,” said Poulson.

Poulson started investigating PV systems months ago, after deciding that the cost of electricity was going to continue to increase. “I just said, it's time to do it, and do it now,” she said.

“In 10 years, I could be really sorry or I could be really happy,” said Poulson, depending on the price of energy. “I'll get my money back, even if nothing changes.”

Poulson is hoping that she will be able to recoup around $7,000 of the systems cost quickly, with a $2,000 federal tax credit and a $5,000 grant from the city.

“The city was very reasonable,” said Poulson. “They were very easy to do business with.”

The city is mandated by the state to make grants available to citizens of Needles to install PV solar systems.

Dave Brownlee, administrative assistant to the city manager of Needles, said that Poulson's system is the first of it's kind in Needles. “Kippy's is the maiden voyage for that,” he said.

According to Brownlee Kippy won't be alone for long: five more family's are ready to take advantage of the sun's energy to offset their utility bills.

“The city has budgeted $50,000 for rebates for this fiscal year,” said Brownlee.

Related News

COVID-19: Daily electricity demand dips 15% globally, says report

COVID-19 Impact on Electricity Demand, per IEA data, shows 15% global load drop from lockdowns, with residential use up, industrial and service sectors down; fossil fuel generation fell as renewables and photovoltaics gained share.


Key Points

An overview of how lockdowns cut global power demand, boosted residential use, and increased the renewable share.

✅ IEA review shows at least 15% dip in daily global electricity load

✅ Lockdowns cut commercial and industrial demand; homes used more

✅ Fossil fuels fell as renewables and PV generation gained share


The daily demand for electricity dipped at least 15 per cent across the globe, according to Global Energy Review 2020: The impacts of the COVID-19 crisis on global energy demand and CO2 emissions, a report published by the International Energy Agency (IEA) in April 2020, even as global power demand surged above pre-pandemic levels.

The report collated data from 30 countries, including India and China, that showed partial and full lockdown measures adopted by them were responsible for this decrease.

Full lockdowns in countries — including France, Italy, India, Spain, the United Kingdom where daily demand fell about 10% and the midwest region of the United States (US) — reduced this demand for electricity.


Reduction in electricity demand after lockdown measures (weather corrected)


Source: Global Energy Review 2020: The impacts of the COVID-19 crisis on global energy demand and CO2 emissions, IEA


Drivers of the fall

There was, however, a spike in residential demand for electricity as a result of people staying and working from home. This increase in residential demand, though, was not enough to compensate for reduced demand from industrial and commercial operations.

The extent of reduction depended not only on the duration and stringency of the lockdown, but also on the nature of the economy of the countries — predominantly service- or industry-based — the IEA report said.

A higher decline in electricity demand was noted in countries where the service sector — including retail, hospitality, education, tourism — was dominant, compared to countries that had industrial economies.

The US, for example — where industry forms only 20 per cent of the economy — saw larger reductions in electricity demand, compared to China, where power demand dropped as the industry accounts for more than 60 per cent of the economy.

Italy — the worst-affected country from COVID-19 — saw a decline greater than 25 per cent when compared to figures from last year, even as power demand held firm in parts of Europe during later lockdowns.

The report said the shutting down of the hospitality and tourism sectors in the country — major components of the Italian economy — were said to have had a higher impact, than any other factor, for this fall.


Reduced fossil fuel dependency

Almost all of the reduction in demand was reportedly because of the shutting down of fossil fuel-based power generation, according to the report. Instead, the share of electricity supply from renewables in the entire portfolio of energy sources, increased during the pandemic, reflecting low-carbon electricity lessons observed during COVID-19.

This was due to a natural increase in wind and photovoltaic power generation compared to 2019 along with a drop in overall electricity demand that forced electricity producers from non-renewable sources to decrease their supplies, before surging electricity demand began to strain power systems worldwide.

The Power System Operation Corporation of India also reported that electricity production from coal — India’s primary source of electricity — fell by 32.2 per cent to 1.91 billion units (kilowatt-hours) per day, in line with India's electricity demand decline reported during the pandemic, compared to the 2019 levels.


Related News

View more

Was there another reason for electricity shutdowns in California?

PG&E Wind Shutdown and Renewable Reliability examines PSPS strategy, wildfire risk, transmission line exposure, wind turbine cut-out speeds, grid stability, and California's energy mix amid historic high-wind events and supply constraints across service areas.


Key Points

An overview of PG&E's PSPS decisions, wildfire mitigation, and how wind cut-out limits influence grid reliability.

✅ Wind turbines reach cut-out near 55 mph, reducing generation.

✅ PSPS mitigates ignition from damaged transmission infrastructure.

✅ Baseload diversity improves resilience during high-wind events.


According to the official, widely reported story, Pacific Gas & Electric (PG&E) initiated power shutoffs across substantial portions of its electric transmission system in northern California as a precautionary measure.

Citing high wind speeds they described as “historic,” the utility claims that if it didn’t turn off the grid, wind-caused damage to its infrastructure could start more wildfires.

Perhaps that’s true. Perhaps. This tale presumes that the folks who designed and maintain PG&E’s transmission system are unaware of or ignored the need to design it to withstand severe weather events, and that the Federal Energy Regulatory Commission (FERC) and North American Electric Reliability Corp. (NERC) allowed the utility to do so.

Ignorance and incompetence happens, to be sure, but there’s much about this story that doesn’t smell right—and it’s disappointing that most journalists and elected officials are apparently accepting it without question.

Take, for example, this statement from a Fox News story about the Kincade Fires: “A PG&E meteorologist said it’s ‘likely that many trees will fall, branches will break,’ which could damage utility infrastructure and start a fire.”

Did you ever notice how utilities cut wide swaths of trees away when transmission lines pass through forests? There’s a reason for that: When trees fall and branches break, the grid can still function, and even as the electric rhythms of New York City shifted during COVID-19, operators planned for variability.

So, if badly designed and poorly maintained infrastructure isn’t the reason PG&E cut power to millions of Californians, what might have prompted them to do so? Could it be that PG&E’s heavy reliance on renewable energy means they don’t have the power to send when a “historic” weather event occurs, especially as policymakers weigh the postponed closure of three power plants elsewhere in California?


Wind Speed Limits

The two most popular forms of renewable energy come with operating limitations, which is why some energy leaders urge us to keep electricity options open when planning the grid. With solar power, the constraint is obvious: the availability of sunlight. One doesn’t generate solar power at night and energy generation drops off with increasing degrees of cloud cover during the day.

The main operating constraint of wind power is, of course, wind speed, and even in markets undergoing 'transformative change' in wind generation, operators adhere to these technical limits. At the low end of the scale, you need about a 6 or 7 miles-per-hour wind to get a turbine moving. This is called the “cut-in speed.” To generate maximum power, about a 30 mph wind is typically required. But, if the wind speed is too high, the wind turbine will shut down. This is called the “cut-out speed,” and it’s about 55 miles per hour for most modern wind turbines.

It may seem odd that wind turbines have a cut-out speed, but there’s a very good reason for it. Each wind turbine rotor is connected to an electric generator housed in the turbine nacelle. The connection is made through a gearbox that is sized to turn the generator at the precise speed required to produce 60 Hertz AC power.

The blades of the wind turbine are airfoils, just like the wings of an airplane. Adjusting the pitch (angle) of the blades allows the rotor to maintain constant speed, which, in turn, allows the generator to maintain the constant speed it needs to safely deliver power to the grid. However, there’s a limit to blade pitch adjustment. When the wind is blowing so hard that pitch adjustment is no longer possible, the turbine shuts down. That’s the cut-out speed.

Now consider how California’s power generation profile has changed. According to Energy Information Administration data, the state generated 74.3 percent of its electricity from traditional sources—fossil fuels and nuclear, amid debates over whether to classify nuclear as renewable—in 2001. Hydroelectric, geothermal, and biomass-generated power accounted for most of the remaining 25.7 percent, with wind and solar providing only 1.98 percent of the total.

By 2018, the state’s renewable portfolio had jumped to 43.8 percent of total generation, with clean power increasing and wind and solar now accounting for 17.9 percent of total generation. That’s a lot of power to depend on from inherently unreliable sources. Thus, it wouldn’t be at all surprising to learn that PG&E didn’t stop delivering power out of fear of starting fires, but because it knew it wouldn’t have power to deliver once high winds shut down all those wind turbines


Related News

View more

Sustaining U.S. Nuclear Power And Decarbonization

Existing Nuclear Reactor Lifetime Extension sustains carbon-free electricity, supports deep decarbonization, and advances net zero climate goals by preserving the US nuclear fleet, stabilizing the grid, and complementing advanced reactors.


Key Points

Extending licenses keeps carbon-free nuclear online, stabilizes grid, and accelerates decarbonization toward net zero.

✅ Preserves 24/7 carbon-free baseload to meet climate targets

✅ Avoids emissions and replacement costs from premature retirements

✅ Complements advanced reactors; reduces capital and material needs


Nuclear power is the single largest source of carbon-free energy in the United States and currently provides nearly 20 percent of the nation’s electrical demand. As a result, many analyses have investigated the potential of future nuclear energy contributions in addressing climate change and investing in carbon-free electricity across the sector. However, few assess the value of existing nuclear power reactors.

Research led by Pacific Northwest National Laboratory (PNNL) Earth scientist Son H. Kim, with the Joint Global Change Research Institute (JGCRI), a partnership between PNNL and the University of Maryland, has added insight to the scarce literature and is the first to evaluate nuclear energy for meeting deep decarbonization goals amid rising credit risks for nuclear power identified by Moody's. Kim sought to answer the question: How much do our existing nuclear reactors contribute to the mission of meeting the country’s climate goals, both now and if their operating licenses were extended?

As the world races to discover solutions for reaching net zero as part of the global energy transition now underway, Kim’s report quantifies the economic value of bringing the existing nuclear fleet into the year 2100. It outlines its significant contributions to limiting global warming.

Plants slated to close by 2050 could be among the most important players in a challenge requiring all available carbon-free technology solutions—emerging and existing—alongside renewable electricity in many regions, the report finds. New nuclear technology also has a part to play, and its contributions could be boosted by driving down construction costs.  

“Even modest reductions in capital costs could bring big climate benefits,” said Kim. “Significant effort has been incorporated into the design of advanced reactors to reduce the use of all materials in general, such as concrete and steel because that directly translates into reduced costs and carbon emissions.”

Nuclear power reactors face an uncertain future, and some utilities face investor pressure to release climate reports as well.
The nuclear power fleet in the United States consists of 93 operating reactors across 28 states. Most of these plants were constructed and deployed between 1970-1990. Half of the fleet has outlived its original operating license lifetime of 40 years. While most reactors have had their licenses renewed for an additional 20 years, and some for another 20, the total number of reactors that will receive a lifetime extension to operate a full 80 years from deployment is uncertain.

Other countries also rely on nuclear energy. In France, for example, nuclear energy provides 70 percent of the country’s power supply. They and other countries must also consider extending the lifetime, retiring, or building new, modern reactors while navigating Canadian climate policy implications for electricity grids. However, the U.S. faces the potential retirement of many reactors in a short period—this could have a far stronger impact than the staggered closures other countries may experience.

“Our existing nuclear power plants are aging, and with their current 60-year lifetimes, nearly all of them will be gone by 2050. It’s ironic. We have a net zero goal to reach by 2050, yet our single largest source of carbon-free electricity is at risk of closure, as seen in New Zealand's electricity transition debates,“ said Kim.


Related News

View more

Solar PV and wind power in the US continue to grow amid favourable government plans

US Renewable Power Outlook 2030 projects surging capacity, solar PV and wind growth, grid modernization, and favorable tax credits, detailing market trends, CAGR, transmission expansion, and policy drivers shaping clean energy generation and consumption.


Key Points

A forecast of US power capacity, generation, and consumption, highlighting solar, wind, tax credits, and grid modernization.

✅ Targets 48.4% renewable capacity share by 2030

✅ Strong growth in solar PV and onshore wind installations

✅ Investment and tax credits drive grid and transmission upgrades


GlobalData’s latest report, ‘United States Power Market Outlook to 2030, Update 2021 – Market Trends, Regulations, and Competitive Landscape’ discusses the power market structure of the United States and provides historical and forecast numbers for capacity, generation and consumption up to 2030. Detailed analysis of the country’s power market regulatory structure, competitive landscape and a list of major power plants are provided. The report also gives a snapshot of the power sector in the country on broad parameters of macroeconomics, supply security, generation infrastructure, transmission and distribution infrastructure, about a quarter of U.S. electricity from renewables in recent years, electricity import and export scenario, degree of competition, regulatory scenario, and future potential. An analysis of the deals in the country’s power sector is also included in the report.

Renewable power held a 19% share of the US’s total power capacity in 2020, and in that year renewables became the second-most prevalent source in the U.S. electricity mix by generation; this share is expected to increase significantly to 48.4% by 2030. Favourable policies introduced by the US Government will continue to drive the country’s renewable sector, particularly solar photovoltaics (PV) and wind power, with wind now the most-used renewable source in the U.S. generation mix. Installed renewable capacity* increased from 16.5GW in 2000 to 239.2GW in 2020, growing at a compound annual growth rate (CAGR) of 14.3%. By 2030, the cumulative renewable capacity is expected to rise to 884.6GW, growing at a CAGR of 14% from 2020 to 2030. Despite increase in prices of renewable equipment, such as solar modules, in 2021, the US renewable sector will show strong growth during the 2021 to 2030 period as this increase in equipment prices are short term due to supply chain disruptions caused by the Covid-19 pandemic.

The expansion of renewable power capacity during the 2000 to 2020 period has been possible due to the introduction of federal schemes, such as Production Tax Credits, Investment Tax Credits and Manufacturing Tax Credits. These have massively aided renewable installations by bringing down the cost of renewable power generation and making it at par with power generated from conventional sources. Over the last few years, the cost of solar PV and wind power installations has declined sharply, and by 2023 wind, solar, and batteries made up most of the utility-scale pipeline across the US, highlighting investor confidence. Since 2010, the cost of utility-scale solar PV projects decreased by around 82% while onshore wind installations decreased by around 39%. This has supported the rapid expansion of the renewable market. However, the price of solar equipment has risen due to an increase in raw material prices and supply shortages. This may slightly delay the financing of some solar projects that are already in the pipeline.

The US will continue to add significant renewable capacity additions during the forecast period as industry outlooks point to record solar and storage installations over the coming years, to meet its target of reaching 80% clean energy by 2030. In November 2021, President Biden signed a $1tr Infrastructure Bill, within which $73bn is designated to renewables. This includes not just renewable capacity building, but also strengthening the country’s power grid and laying new high voltage transmission lines, both of which will be key to driving solar and wind power capacity additions as wind power surges in the U.S. electricity mix nationwide.

The US was one of the worst hit countries in the world due to the Covid-19 pandemic in 2020. With respect to the power sector, the electricity consumption in the country declined by 2.5% in 2020 as compared to 2019, even as renewable electricity surpassed coal in 2022 in the generation mix, highlighting continued structural change. Power plants that were under construction faced delays due to unavailability of components due to supply chain disruptions and unavailability of labour due to travel restrictions.

According to the US Energy Information Administration, 61 power projects, having a total capacity of 2.4GWm which were under construction during March and April 2020 were delayed because of the Covid-19 pandemic. Among renewable power technologies, solar PV and wind power projects were the most badly affected due to the pandemic.

In March and April 2020, 53 solar PV projects, having a total capacity of 1.3GW, and wind power projects, having a total capacity of 1.2GW, were delayed due to the Covid-19 pandemic. Moreover, several states suspended renewable energy auctions due to the pandemic.

For instance, New York State Energy Research and Development Authority (NYSERDA) had issued a new offshore wind solicitation for 1GW and up to 2.5GW in April 2020, but this was suspended due to the Covid-19 pandemic. In July 2020, the authority relaunched the tender for 2.5GW of offshore wind capacity, with a submission deadline in October 2020.

To ease the financial burden on consumers during the pandemic, more than 1,000 utilities in the country announced disconnection moratoria and implemented flexible payment plans. Duke Energy, American Electric Power, Dominion Power and Southern California Edison were among the major utilities that voluntarily suspended disconnections.


Related News

View more

'Unlayering' peak demand could accelerate energy storage adoption

Duration Portfolio Energy Storage aligns layered peak demand with right-sized batteries, enabling peak shaving, gas peaker replacement, and solar-plus-storage synergy while improving grid flexibility, reliability, and T&D deferral through two- to four-hour battery durations.


Key Points

An approach that layers battery durations to match peaks, cut costs, replace peakers, and boost grid reliability.

✅ Layers 2- to 4-hour batteries by peak duration

✅ Enables solar-plus-storage and peak shaving

✅ Cuts T&D upgrades, emissions, and fuel costs


The debate over energy storage replacing gas-fired peakers has raged for years, but a new approach that shifts the terms of the argument could lead to an acceleration of storage deployments.

Rather than looking at peak demand as a single mountainous peak, some analysts now advocate a layered approach that allows energy storage to better match peak needs and complement ongoing efforts to improve solar and wind power across the grid.

"You don’t have to have batteries that run to infinity."

Some developers of solar-plus-storage projects, bolstered by cheap batteries, say they can already compete head-to-head with gas-fired peakers. "I can beat a gas peaker anywhere in the country today with a solar-plus-storage power plant," Tom Buttgenbach, president and CEO of developer 8minutenergy Renewables, recently told S&P Global.

Customers are very busy these days and rebate programs need to fit the speed of their life. Participation should be quick, easy, and accessible anywhere.

Others disagree. Storage is not disruptive for generation, but will be disruptive for transmission and distribution, Kris Zadlo, executive vice president and chief development officer at Invenergy, told the audience at a Bloomberg New Energy Finance conference last spring. Invenergy, like many renewable power developers, develops generation, energy storage and transmission projects.

But there is another path that avoids the pitfalls of positions on either end of the all-or-none approach. "Do the analysis of the need itself," Ray Hohenstein, market applications director at Fluence, told Utility Dive. If the need is only two hours in duration, it may be best served by a two-hour battery. "You don’t have to have batteries that run to infinity."


Storage vs. fossil fuel peakers

Energy storage has several benefits over traditional fossil fuel peaking plants, Hohenstein said. It is instantaneous, it has no emissions and requires no fuel, and has limited infrastructure needs. It can also help the grid absorb higher levels of renewable generation by soaking up excess output, such as solar power at noon, and many planned storage additions will be paired with solar in the next few years. But the one thing energy storage cannot do, he said, is provide limitless energy.

So, instead of looking at replacing an individual peaker, Hohenstein advocated a "duration portfolio" approach that uses energy storage to shave peak load.

If the need is for 150 MW of resources that will never need to run for more than two hours at a time, then a battery is "quite cheap," significantly less than a four or eight-hour battery, said Hohenstein. "If you fill up your peak by duration layer, it could be more cost effective."


NREL research driver

Fluence’s approach is informed by research by Paul Denholm and Robert Margolis at the National Renewable Energy Laboratory (NREL), released last spring.

The NREL researchers looked at the California market where they said 11 GW of fossil fuel capacity is expected to be retired by 2029 because of new once-through-cooling requirements that are taking effect. A lot of that capacity is peaking capacity and, according to NREL’s analysis, a large fraction could be replaced with four-hour energy storage, assuming continued storage cost reductions and growth in solar installations.

The key in NREL’s research was the level of solar power penetration. There is a "synergistic" relationship between solar penetration and storage deployment, the researchers wrote, and other studies suggest wind and solar could meet 80% of U.S. demand as these trends continue.


Related News

View more

Alberta Carbon tax is gone, but consumer price cap on electricity will remain

Alberta Electricity Rate Cap stays despite carbon tax repeal, keeping the Regulated Rate Option at 6.8 cents/kWh. Levy funds cover market gaps as the UCP reviews NDP policies to maintain affordable utility bills.


Key Points

Program capping RRO power at 6.8 cents/kWh, using levy funds to offset market prices while the UCP reviews policy.

✅ RRO cap fixed at 6.8 cents/kWh for eligible customers

✅ Levy funds pay generators when market prices exceed the cap

✅ UCP reviewing NDP policies to ensure affordable rates


Alberta's carbon tax has been cancelled, but a consumer price cap on electricity — which the levy pays for — is staying in place for now.

June electricity rates are due out on Monday, about four days after the new UCP government did away with the carbon charge on natural gas and vehicle fuel.

Part of the levy's revenue was earmarked by the previous NDP government to keep power prices at or below 6.8 cents per kilowatt hour under new electricity rules set by the province.

"The Regulated Rate Option cap of 6.8 cents/kWh was implemented by the previous government and currently remains in effect. We are reviewing all policies put in place by the former government and will make decisions that ensure more affordable electricity rates for job-creators and Albertans," said a spokesperson for Alberta's energy ministry in an emailed statement.

Albertans with regulated rate contracts and all City of Medicine Hat utility customers only pay that amount or less, though some Alberta ratepayers have faced deferral-related arrears.

If the actual market price rises above that, the difference is paid to generators directly from levy funds, a buffer that matters as experts warn prices are set to soar later this year.

The government has paid more than $55 million to utilities over the past year ending in March 2019, due to that electricity price cap being in place.

Alberta Energy says the price gap program will continue, at least for the time being, amid electricity policy changes being considered.


Related News

View more

Sign Up for Electricity Forum’s Newsletter

Stay informed with our FREE Newsletter — get the latest news, breakthrough technologies, and expert insights, delivered straight to your inbox.

Electricity Today T&D Magazine Subscribe for FREE

Stay informed with the latest T&D policies and technologies.
  • Timely insights from industry experts
  • Practical solutions T&D engineers
  • Free access to every issue

Live Online & In-person Group Training

Advantages To Instructor-Led Training – Instructor-Led Course, Customized Training, Multiple Locations, Economical, CEU Credits, Course Discounts.

Request For Quotation

Whether you would prefer Live Online or In-Person instruction, our electrical training courses can be tailored to meet your company's specific requirements and delivered to your employees in one location or at various locations.