
CSA Z463 Electrical Maintenance -
Our customized live online or in‑person group training can be delivered to your staff at your location.

- Live Online
- 6 hours Instructor-led
- Group Training Available
Regular Price:
$249
Coupon Price:
$199
CALGARY
—
Alberta Electricity Demand Record surges during a deep freeze, as AESO reports peak load in megawatts and ENMAX notes increased usage in Calgary and Edmonton, with thermostats up amid a cold snap straining power grid.
The Situation Explained
It is the highest electricity peak load recorded by AESO, reflecting maximum grid usage during cold snaps.
AESO reports 11,729 MW peak at about 7 p.m. Tuesday
Record surpassed prior January mark by 31 MW
Calgary low -29 C; Edmonton -30 C; wind chill near -40
ENMAX cites Calgary average demand ~1,400 MW during cold snap
Demand up about 13% week over week; conservation urged
Albertans are cranking up their thermostats and blasting heat into their homes at overwhelmingly high rates as the deep freeze continues across the region.
It’s so cold that the province set a new all-time record Tuesday evening for electricity usage.
According to the Alberta Electric System Operator (AESO), as electricity prices spike in Alberta during extreme demand, 11,729 MW of power was used around 7 p.m. Tuesday, passing the previous record set in January of last year by 31 MW.
Temperatures reached a low of -29 C in Calgary, where rising electricity bills have strained budgets, on Tuesday while Edmonton saw a low of -30 C, according to Environment Canada. Wind chill made it feel closer to -40.
“That increase — 31 Megawatts — is sizeable and about the equivalent of a moderately sized generation facility,” said AESO communications director, Mike Deising.
“We do see higher demand in winter because it’s cold and it’s dark and that’s really exactly what we’re seeing right now as demand goes up, people turn on their lights and turn up their furnaces,” and with the UCP scrapping the price cap earlier that’s really exactly what we’re seeing right now as demand goes up, people turn on their lights and turn up their furnaces.”
Deising adds Alberta’s electricity usage over the last year has actually been much lower than average, though experts urge Albertans to lock in rates amid expected volatility, despite more people staying home during the pandemic.
That trend was continuing into 2021, but as Alberta's rising electricity prices draw attention, it’s expected that more records could be broken.
“If the cold snap continues we may likely set another record (Wednesday) or (Thursday), depending on what happens with the temperatures,” he said.
Meanwhile, ENMAX has reported an average real-time system demand of 1,400 MW for the city of Calgary.
That amount is still a far cry from the current season record of 1,619 MW (Aug. 18, 2020), the all-time winter record of 1,653MW (Dec. 2, 2013), and the all-time summer record of 1,692 MW (Aug. 10, 2018).
ENMAX says electricity demand has increased quite significantly over the past week — by about 13 per cent — since the cold snap set in.
As a result, the energy company is once again rolling out its ‘Winter Wise’ campaign in an effort to encourage Calgarians to manage both electricity and natural gas use in the winter, even as a consumer price cap on power bills is enabled by new legislation.
Related News
Related News
Trump's Canada Tariff May Spike NY Energy Prices
25% Tariff on Canadian Imports threatens New York energy markets, disrupting hydroelectric power and natural…
View more
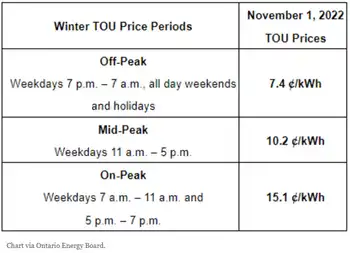
Electricity rates are about to change across Ontario
Ontario Electricity Rate Changes lower OEB Regulated Price Plan costs, adjust Time-of-Use winter hours and…
View more
American Households Struggle with Sky-High Energy Bills During Extreme Summer Heat
US Summer Energy Bills Crisis is driven by record heatwaves, soaring electricity prices, AC cooling…
View more

Ontario unveils new tax breaks, subsidized hydro plan to spur economic recovery from COVID-19
Ontario COVID-19 Business Tax Relief outlines permanent Employer Health Tax exemptions, lower Business Education Tax…
View more

N.S. senior suspects smart meter to blame for shocking $666 power bill
Nova Scotia Power smart meter billing raises concerns amid estimated billing, catch-up bills, and COVID-19…
View more
Could selling renewable energy be Alberta's next big thing?
Alberta Renewable Energy Procurement is surging as corporate PPAs drive wind and solar growth, with…
View more
Sign Up for Electricity Forum’s Newsletter
Stay informed with our FREE Newsletter — get the latest news, breakthrough technologies, and expert insights, delivered straight to your inbox.
Electricity Today T&D Magazine Subscribe for FREE

Stay informed with the latest T&D policies and technologies.
- Timely insights from industry experts
- Practical solutions T&D engineers
- Free access to every issue
