Solar plant goes to Goodyear

By East Valley Tribune


Substation Relay Protection Training

Our customized live online or in‑person group training can be delivered to your staff at your location.

  • Live Online
  • 12 hours Instructor-led
  • Group Training Available
Regular Price:
$699
Coupon Price:
$599
Reserve Your Seat Today
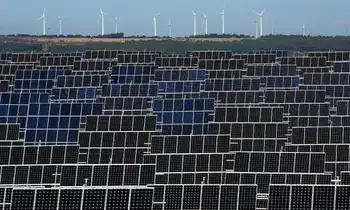
Goodyear in the West Valley has been selected as the location for the first U.S. solar-panel manufacturing plant by Suntech Power Holdings, according to the Greater Phoenix Economic Council.

The much-anticipated announcement was made by the large China-based producer of solar energy equipment company at a solar energy conference in downtown Phoenix.

Suntech announced on November 15 that it would set up its first American manufacturing plant in the Phoenix area but did not designate the specific location.

Goodyear was one of six Valley cities considered by the company for the plant, which eventually could employ up to 250 workers. It was a loss for East Valley cities Chandler and Tempe, which reportedly had been in the running.

The plant, which is expected to begin production by the end of this year, will supply solar modules to the North American market with an initial annual production capacity of 30 megawatts, Suntech said.

The Wuxi, China-based company said it chose the Phoenix area because of a research relationship with Arizona State University, the stateÂ’s renewable energy requirements for utilities and a supportive business climate.

Suntech is one of several solar companies considering setting up solar manufacturing facilities in Arizona after the state legislature approved income and property tax reductions for firms that set up operations in the state.

Related News

Basin Electric and Clenera Renewable Energy Announce Power Purchase Agreement for Montana Solar Project

Cabin Creek Solar Project Montana delivers 150 MW of utility-scale solar under a Power Purchase Agreement, with Basin Electric and Clenera supplying renewable energy, enhancing grid reliability, and reducing carbon emissions for 30,000 homes.


Key Points

A 150 MW solar PPA near Baker by Basin Electric and Clenera, delivering reliable renewable power and carbon reduction.

✅ 150 MW across two 75 MW sites near Baker, Montana

✅ PPA supports Basin Electric's diverse, cost-effective portfolio

✅ Cuts 265,000 tons CO2 and powers 30,000 homes


A new solar project in Montana will provide another 150 megawatts (MW) of affordable, renewable power to Basin Electric customers and co-op members across the region.

Basin Electric Power Cooperative (Basin Electric) and Clenera Renewable Energy, announced today the execution of a Power Purchase Agreement (PPA) for the Cabin Creek Solar Project. Cabin Creek is Basin Electric's second solar PPA, and the result of the cooperative's continuing goal of providing a diverse mix of energy sources that are cost-effective for its members.

When completed, Cabin Creek will consist of two, 75-MW projects in southeastern Montana, five miles west of Baker. According to Clenera, the project will eliminate 265,000 tons of carbon dioxide per year and power 30,000 homes, while communities such as the Ermineskin First Nation advance their own generation efforts.

"Renewable technology has advanced dramatically in recent years, with rapid growth in Alberta underscoring broader trends, which means even more affordable power for Basin Electric's customers," said Paul Sukut, CEO and general manager of Basin Electric. "Basin Electric is excited to purchase the output from this project to help serve our members' growing energy needs. Adding solar further promotes our all-of-the-above energy solution as we generate energy using a diverse resource portfolio including coal, natural gas, and other renewable resources to provide reliable, affordable, and environmentally safe generation.

"Clenera is proud to partner with Basin Electric Power Cooperative to support the construction of the Cabin Creek Solar projects in Montana," said Jared McKee, Clenera's director of Business Development. "We truly believe that Basin Electric will be a valuable partner as we aim to deliver today's new era of reliable, battery storage increasingly enabling round-the-clock service, affordable, and clean energy."

"We're pleased that Southeast Electric will be home to the Cabin Creek Solar Project," said Jack Hamblin, manager of Southeast Electric Cooperative, a Basin Electric Class C member headquartered in Ekalaka, Montana. "This project is one more example of cooperatives working together to use economies of scale to add affordable generation for all their members - similar to what was done 70 years ago when cooperatives were first built."

Basin Electric Class A member Upper Missouri Power Cooperative, headquartered in Sidney, Montana, provides wholesale power to Southeast Electric and 10 other distribution cooperatives in western North Dakota and eastern Montana. "It is encouraging to witness the development of cost-competitive energy, including projects in Alberta contracted at lower cost than natural gas that demonstrate market shifts, like the Cabin Creek Solar Project, which will be part of the energy mix we purchase from Basin Electric for our member systems, said Claire Vigesaa, Upper Missouri's general manager. "The energy needs in our region are growing and this project will help us serve both our members, and our communities as a whole."

Cabin Creek will bring significant economic benefits to the local area. According to Clenera, the project will contribute $8 million in property taxes to Fallon County and $5 million for the state of Montana over 35 years. They say it will also create approximately 300 construction jobs and two to three full-time jobs.

"This project underscores the efforts by Montana's electric cooperatives to continue to embrace more carbon-free technology," said Gary Wiens, CEO of Montana Electric Cooperatives' Association. "It also demonstrates Basin Electric's commitment to seek development of renewable energy projects in our state. It's exciting that these two projects combined are 50 times larger than our current largest solar array in Montana."

Cabin Creek is anticipated to begin operations in late 2023.


Related News

View more

Wind and Solar Energy Surpass Coal in U.S. Electricity Generation

Wind and Solar Surpass Coal in U.S. power generation, as EIA data cites falling LCOE, clean energy incentives, grid upgrades, and battery storage driving renewables growth, lower emissions, jobs, and less fossil fuel reliance.


Key Points

An EIA-noted milestone where U.S. renewables outproduce coal, driven by lower LCOE, policy credits, and grid upgrades.

✅ EIA data shows wind and solar exceed coal generation

✅ Falling LCOE boosts project viability across the grid

✅ Policies and storage advances strengthen reliability


In a landmark shift for the energy sector, wind and solar power have recently surpassed coal in electricity generation in the United States. This milestone, reported by Warp News, marks a significant turning point in the country’s energy landscape and underscores the growing dominance of renewable energy sources.

A Landmark Achievement

The achievement of wind and solar energy generating more electricity than coal is a landmark moment in the U.S. energy sector. Historically, coal has been a cornerstone of electricity production, providing a substantial portion of the nation's power needs. However, recent data reveals a transformative shift, with renewables surpassing coal for the first time in 130 years, as renewable energy sources, particularly wind and solar, have begun to outpace coal in terms of electricity generation.

The U.S. Energy Information Administration (EIA) reported that in recent months, wind and solar combined produced more electricity than coal, including a record 28% share in April, reflecting a broader trend towards cleaner energy sources. This development is driven by several factors, including advancements in renewable technology, decreasing costs, and a growing commitment to reducing greenhouse gas emissions.

Technological Advancements and Cost Reductions

One of the key drivers behind this shift is the rapid advancement in wind and solar technologies, as wind power surges in the U.S. electricity mix across regions. Improvements in turbine and panel efficiency have significantly increased the amount of electricity that can be generated from these sources. Additionally, technological innovations have led to lower production costs, making wind and solar energy more competitive with traditional fossil fuels.

The cost of solar panels and wind turbines has decreased dramatically over the past decade, making renewable energy projects more economically viable. According to Warp News, the levelized cost of electricity (LCOE) from solar and wind has fallen to levels that are now comparable to or lower than coal-fired power. This trend has been pivotal in accelerating the transition to renewable energy sources.

Policy Support and Investment

Government policies and incentives have also played a crucial role in supporting the growth of wind and solar energy, with wind now the most-used renewable electricity source in the U.S. helping drive deployment. Federal and state-level initiatives, such as tax credits, subsidies, and renewable energy mandates, have encouraged investment in clean energy technologies. These policies have provided the financial and regulatory support necessary for the expansion of renewable energy infrastructure.

The Biden administration’s focus on addressing climate change and promoting clean energy has further bolstered the transition. The Infrastructure Investment and Jobs Act and the Inflation Reduction Act, among other legislative efforts, have allocated significant funding for renewable energy projects, grid modernization, and research into advanced technologies.

Environmental and Economic Implications

The surpassing of coal by wind and solar energy has significant environmental and economic implications, building on the milestone when renewables became the second-most prevalent U.S. electricity source in 2020 and set the stage for further gains. Environmentally, it represents a major step forward in reducing carbon emissions and mitigating climate change. Coal-fired power plants are among the largest sources of greenhouse gases, and transitioning to cleaner energy sources is essential for meeting climate targets and improving air quality.

Economically, the shift towards wind and solar energy is creating new opportunities and industries. The growth of the renewable energy sector is generating jobs in manufacturing, installation, and maintenance. Additionally, the decreased reliance on imported fossil fuels enhances energy security and stabilizes energy prices.

Challenges and Future Outlook

Despite the progress, there are still challenges to address. The intermittency of wind and solar power requires advancements in energy storage and grid management to ensure a reliable electricity supply. Investments in battery storage technologies and smart grid infrastructure are crucial for overcoming these challenges and integrating higher shares of renewable energy into the grid.

Looking ahead, the trend towards renewable energy is expected to continue, with renewables projected to soon provide about one-fourth of U.S. electricity as deployment accelerates, driven by ongoing technological advancements, supportive policies, and a growing commitment to sustainability. As wind and solar power become increasingly cost-competitive and efficient, their role in the U.S. energy mix will likely expand, further displacing coal and other fossil fuels.

Conclusion

The surpassing of coal by wind and solar energy in U.S. electricity generation is a significant milestone in the transition to a cleaner, more sustainable energy future. This achievement highlights the growing importance of renewable energy sources and the success of technological advancements and supportive policies in driving this transition. As the U.S. continues to invest in and develop renewable energy infrastructure, the move away from coal represents a crucial step towards achieving environmental goals and fostering economic growth in the clean energy sector.


Related News

View more

Some in Tennessee could be without power for weeks after strong storms hit

Middle Tennessee Power Outages disrupt 100,000+ customers as severe thunderstorms, straight-line winds, downed trees, and debris challenge Nashville crews, slow restoration amid COVID-19, and threaten more hail, flash flooding, and damaging gusts.


Key Points

Blackouts across Nashville after severe storms and winds, leaving customers without power and facing restoration delays.

✅ Straight-line winds 60-80 mph toppled trees and power lines

✅ 130,000+ customers impacted; some outages may last 1-2 weeks

✅ Restoration slowed by debris, COVID-19 protocols, and new storms


Some middle Tennessee residents could be without electricity for up to two weeks after strong thunderstorms swept through the area Sunday, knocking out power for more than 100,000 customers, a scale comparable to Los Angeles outages after a station fire.

"Straight line winds as high as 60-80 miles per hour knocked down trees, power lines and power polls, interrupting power to 130,000 of our 400,000+ customers," Nashville Electric said in a statement Monday. The utility said the outage was one of the largest on record, though Carolina power outages recently left a quarter-million without power as well.

"Restoration times will depend on individual circumstances. In some cases, power could be out for a week or two" as challenges related to coronavirus and the need for utilities adapt to climate change complicated crews' responses and more storms were expected, the statement said. "This is unfortunate timing on the heels of a tornado and as we deal with battling COVID-19."

Metropolitan Nashville and Davidson County Mayor John Cooper also noted that the power outages were especially inconvenient, a challenge similar to Hong Kong families without power during Typhoon Mangkhut, as people were largely staying home to slow the spread of coronavirus. He also pointed out that the storms came on the two month anniversary of the Nashville tornado that left at least two dozen people dead.

"Crews are working diligently to restore power and clear any debris in neighborhoods," Cooper said.

He said that no fatalities were reported in the county but sent condolences to Spring Hill, whose police department reported that firefighter Mitchell Earwood died during the storm due to "a tragic weather-related incident" while at his home and off duty. He had served with the fire department for 10 years.

The Metro Nashville Department of Public Works said it received reports of more than 80 downed trees in Davidson County.

Officials also warn that copper theft can be deadly when electrical infrastructure is damaged after storms.

The National Weather Service Nashville said a 72 mph wind gust was measured at Nashville International Airport — the fifth fastest on record.

The weather service warned that strong storms with winds of up to 75 mph, large hail, record-long lightning bolt potential seen in the U.S., and isolated flash flooding could hit middle Tennessee again Monday afternoon and night.

"Treat Severe Thunderstorm Warnings the same way you would Tornado Warnings and review storm safety tips before you JUST TAKE SHELTER," the NWS instructs. "70 mph is 70 mph whether it's spinning around in a circle or blowing in a straight line."


Related News

View more

Hydro One announces pandemic relief fund for Hydro One customers

Hydro One Pandemic Relief Fund offers COVID-19 financial assistance, payment flexibility, and Winter Relief to Ontario electricity customers facing hardship, with disconnection protection and customer support to help manage bills during the health crisis.


Key Points

COVID-19 aid offering bill credits, payment flexibility, and disconnection protection for electricity customers.

✅ Financial assistance and bill credits for hardship cases

✅ Flexible payment plans and extended Winter Relief

✅ No-disconnect policy and dedicated customer support hours


We are pleased to announce a Pandemic Relief Fund to assist customers affected by the novel coronavirus (COVID-19). As part of our commitment to customers, we will offer financial assistance as well as increased payment flexibility to customers experiencing hardship. The fund is designed to support customers impacted by these events and those that may experience further impacts.

In addition to this, we've also extended our Winter Relief program, aligning with our ban on disconnections policy so no customer experiencing any hardship has to worry about potential disconnection.

We recognize that this is a difficult time for everyone and we want our customers to know that we’re here to support them. We hope this fund and the added measures, such as extended off-peak rates that help provide our customers peace of mind so they can concentrate on what matters most — keeping their loved ones safe.

If you are concerned about paying your bill, are experiencing hardship or have been impacted by the pandemic, including electricity relief announced by the province, we want to help you. Call us to discuss the fund and see what options are available for you.


CUSTOMER CONTACT CENTRE HOURS
Call us at 1-888-664-9376

Monday to Friday from 7:30 a.m. to 8:00 p.m.

Saturdays from 9:00 a.m. to 3:00 p.m.


KEEPING ONTARIANS AND OUR ELECTRICITY SYSTEM SAFE
We recognize the critical role we play in powering communities across the province and our support for the Province of Ontario during COVID-19. This is a responsibility to employees, customers, businesses and the people of Ontario that we take very seriously.

Since the novel coronavirus (COVID-19) outbreak began, Hydro One’s Pandemic Team along with our leadership, have been actively monitoring the issues to ensure we can continue to deliver the service Ontarians depend on while keeping our employees, customers and the public safe, even as there has been no cut in peak hydro rates yet for self-isolating customers across Ontario. While the risk in Ontario remains low, we believe we can best protect our people and our operations by taking proactive measures.

As information continues to evolve, our leadership team along with the Pandemic Planning Team and our Emergency Operations Centre are committed to maintaining business continuity while minimizing risk to employees and communities.

Over the days and weeks to come, we will work with the sector and government, which is preparing to extend disconnect moratoriums across the province, to enhance safety protocols and champion the needs of electricity customers in Ontario.


Related News

View more

Which of the cleaner states imports dirty electricity?

Hourly Electricity Emissions Tracking maps grid balancing areas, embodied emissions, and imports/exports, revealing carbon intensity shifts across PJM, ERCOT, and California ISO, and clarifying renewable energy versus coal impacts on health and climate.


Key Points

An hourly method tracing generation, flows, and embodied emissions to quantify carbon intensity across US balancing areas.

✅ Hourly traces of imports/exports and generation mix

✅ Consumption-based carbon intensity by balancing area

✅ Policy insights for renewables, coal, health costs


In the United States, electricity generation accounts for nearly 30% of our carbon emissions. Some states have responded to that by setting aggressive renewable energy standards; others are hoping to see coal propped up even as its economics get worse. Complicating matters further is the fact that many regional grids are integrated, and as America goes electric the stakes grow, meaning power generated in one location may be exported and used in a different state entirely.

Tracking these electricity exports is critical for understanding how to lower our national carbon emissions. In addition, power from a dirty source like coal has health and environment impacts where it's produced, and the costs of these aren't always paid by the parties using the electricity. Unfortunately, getting reliable figures on how electricity is produced and where it's used is challenging, even for consumers trying to find where their electricity comes from in the first place, leaving some of the best estimates with a time resolution of only a month.

Now, three Stanford researchers—Jacques A. de Chalendar, John Taggart, and Sally M. Benson—have greatly improved on that standard, and they have managed to track power generation and use on an hourly basis. The researchers found that, of the 66 grid balancing areas within the United States, only three have carbon emissions equivalent to our national average, and they have found that imports and exports of electricity have both seasonal and daily changes. de Chalendar et al. discovered that the net results can be substantial, with imported electricity increasing California's emissions/power by 20%.

Hour by hour
To figure out the US energy trading landscape, the researchers obtained 2016 data for grid features called balancing areas. The continental US has 66 of these, providing much better spatial resolution on the data than the larger grid subdivisions. This doesn't cover everything—several balancing areas in Canada and Mexico are tied in to the US grid—and some of these balancing areas are much larger than others. The PJM grid, serving Pennsylvania, New Jersey, and Maryland, for example, is more than twice as large as Texas' ERCOT, in a state that produces and consumes the most electricity in the US.

Despite these limitations, it's possible to get hourly figures on how much electricity was generated, what was used to produce it, and whether it was used locally or exported to another balancing area. Information on the generating sources allowed the researchers to attach an emissions figure to each unit of electricity produced. Coal, for example, produces double the emissions of natural gas, which in turn produces more than an order of magnitude more carbon dioxide than the manufacturing of solar, wind, or hydro facilities. These figures were turned into what the authors call "embodied emissions" that can be traced to where they're eventually used.

Similar figures were also generated for sulfur dioxide and nitrogen oxides. Released by the burning of fossil fuels, these can both influence the global climate and produce local health problems.

Huge variation
The results were striking. "The consumption-based carbon intensity of electricity varies by almost an order of magnitude across the different regions in the US electricity system," the authors conclude. The low is the Bonneville Power grid region, which is largely supplied by hydropower; it has typical emissions below 100kg of carbon dioxide per megawatt-hour. The highest emissions come in the Ohio Valley Electric region, where emissions clear 900kg/MW-hr. Only three regional grids match the overall grid emissions intensity, although that includes the very large PJM (where capacity auction payouts recently fell), ERCOT, and Southern Co balancing areas.

Most of the low-emissions power that's exported comes from the Pacific Northwest's abundant hydropower, while the Rocky Mountains area exports electricity with the highest associated emissions. That leads to some striking asymmetries. Local generation in the hydro-rich Idaho Power Company has embodied emissions of only 71kg/MW-hr, while its imports, coming primarily from Rocky Mountain states, have a carbon content of 625kg/MW-hr.

The reliance on hydropower also makes the asymmetry seasonal. Local generation is highest in the spring as snow melts, but imports become a larger source outside this time of year. As solar and wind can also have pronounced seasonal shifts, similar changes will likely be seen as these become larger contributors to many of these regional grids. Similar things occur daily, as both demand and solar production (and, to a lesser extent, wind) have distinct daily profiles.

The Golden State
California's CISO provides another instructive case. Imports represent less than 30% of its total electric use in 2016, yet California electricity imports provided 40% of its embodied emissions. Some of these, however, come internally from California, provided by the Los Angeles Department of Water and Power. The state itself, however, has only had limited tracking of imported emissions, lumping many of its sources as "other," and has been exporting its energy policies to Western states in ways that shape regional markets.

Overall, the 2016 inventory provides a narrow picture of the US grid, as plenty of trends are rapidly changing our country's emissions profile, including the rise of renewables and the widespread adoption of efficiency measures and other utility trends in 2017 that continue to evolve. The method developed here can, however, allow for annual updates, providing us with a much better picture of trends. That could be quite valuable to track things like how the rapid rise in solar power is altering the daily production of clean power.

More significantly, it provides a basis for more informed policymaking. States that wish to promote low-emissions power can use the information here to either alter the source of their imports or to encourage the sites where they're produced to adopt more renewable power. And those states that are exporting electricity produced primarily through fossil fuels could ensure that the locations where the power is used pay a price that includes the health costs of its production.


Related News

View more

TC Energy confirms Ontario pumped storage project is advancing

Ontario Pumped Storage advances as Ontario's largest energy storage project, delivering clean electricity, long-duration capacity, and grid reliability for peak demand, led by TC Energy and Saugeen Ojibway Nation, with IESO review underway.


Key Points

A long-duration storage project in Meaford storing clean power for peak demand, supporting Ontario's emission-free grid.

✅ Stores clean electricity to power 1M homes for 11 hours

✅ Partnership: TC Energy and Saugeen Ojibway Nation

✅ Pending IESO review and OEB regulation decisions


In a bid to accelerate the province's ambitions for clean economic growth, TC Energy Corporation has announced significant progress in the development of the Ontario Pumped Storage Project. The Government of Ontario in Canada has unveiled a plan to address growing energy needs as a sustainable road map aimed at achieving an emission-free electricity sector, and as part of this plan, the Ministry of Energy is set to undertake a final evaluation of the proposed Ontario Pumped Storage Project. A decision is expected to be reached by the end of the year.

Ontario Pumped Storage is a collaborative effort between TC Energy and the Saugeen Ojibway Nation. The project is designed to be Ontario's largest energy storage initiative, capable of storing clean electricity to power one million homes for 11 hours. As the province strives to transition to a cleaner electricity grid by embracing clean power across sectors, long duration storage solutions like Ontario Pumped Storage will play a pivotal role in providing reliable, emission-free power during peak demand periods.

The success of the Project hinges on the approval of TC Energy's board of directors and a fruitful partnership agreement with the Saugeen Ojibway Nation. TC Energy is aiming for a final investment decision in 2024, as Ontario confronts an electricity shortfall in the coming years, with the anticipated in-service date being in the early 2030s, pending regulatory and corporate approvals.

“Ontario Pumped Storage will be a critical component of Ontario’s growing clean economy and will deliver significant benefits and savings to consumers,” said Corey Hessen, Executive Vice-President and President, TC Energy, Power and Energy Solutions. “Ontario continues to attract major investments that will have large power needs — many of which are seeking zero-emission energy before they invest. We are pleased the government is advancing efforts to recognize the significant role that long duration storage plays — firming resources, including new gas plants under provincial consideration, will become increasingly valuable in supporting a future emission-free electricity system.” 

The Municipality of Meaford also expressed its support for the project, recognizing the positive impact it could have on the local economy and the overall electricity system of Ontario. Additionally, various stakeholders, including LiUNA OPDC, LiUNA Local 183, and the Ontario Chamber of Commerce, lauded the potential for job creation, training opportunities, and resilient energy infrastructure as Ontario seeks new wind and solar power to ease a coming electricity supply crunch.

The timeline for Ontario Pumped Storage's progress includes a final analysis by the Independent Electricity System Operator (IESO) to confirm its role in Ontario's electricity system and in balancing demand and emissions during the transition, to be completed by 30 September 2023. Concurrently, the Ministry of Energy will engage in consultations on the potential regulation of the Project via the Ontario Energy Board, while debates over clean, affordable electricity intensify ahead of the Ontario election, with a final determination scheduled for 30 November 2023.


Related News

View more

Sign Up for Electricity Forum’s Newsletter

Stay informed with our FREE Newsletter — get the latest news, breakthrough technologies, and expert insights, delivered straight to your inbox.

Electricity Today T&D Magazine Subscribe for FREE

Stay informed with the latest T&D policies and technologies.
  • Timely insights from industry experts
  • Practical solutions T&D engineers
  • Free access to every issue

Live Online & In-person Group Training

Advantages To Instructor-Led Training – Instructor-Led Course, Customized Training, Multiple Locations, Economical, CEU Credits, Course Discounts.

Request For Quotation

Whether you would prefer Live Online or In-Person instruction, our electrical training courses can be tailored to meet your company's specific requirements and delivered to your employees in one location or at various locations.