Substation Relay Protection Training
Our customized live online or in‑person group training can be delivered to your staff at your location.

- Live Online
- 12 hours Instructor-led
- Group Training Available
Regular Price:
$699
Coupon Price:
$599
TORONTO
—
Canada Electrification Costs: report estimates $580B-$1.4T to scale renewable energy, wind, solar, and storage capacity to 2050, shifting from natural gas toward net-zero emissions and raising average household energy spending by $1,300-$3,200 annually.
In This Story
Projected national expense to expand renewables and electrify energy systems by 2050, impacting household energy bills.
$580B-$1.4T forecast for 2020-2050 energy transition
278-422 GW wind, solar, storage capacity by 2050
Household costs up $1,300-$3,200 per year on average
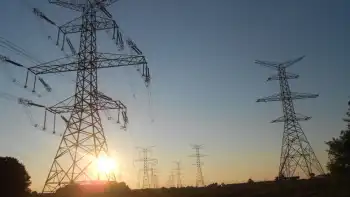
The Canadian Gas Association says building renewable electricity capacity to replace just half of Canada's current fossil fuel-generated energy, a shift with significant policy implications for grids across provinces, could increase national costs by as much as $1.4 trillion over the next 30 years.
In a report, it contends, echoing an IEA report on net-zero, that growing electricity's contribution to Canada's energy mix from its current 19 per cent to about 60 per cent, a step critical to meeting climate pledges that policymakers emphasize, will require an expansion from 141 gigawatts today to between 278 and 422 GW of renewable wind, solar and storage capacity by 2050.
It says that will increase national energy costs by between $580 billion and $1.4 trillion between 2020 and 2050, a projection consistent with recent reports of higher electricity prices in Alberta amid policy shifts, translating into an average increase in Canadian household spending of $1,300 to $3,200 per year.
The study, prepared by consulting firm ICF for the association, assumes electrification begins in 2020 and is applied in all feasible applications by 2050, with investments in the electricity system, guided by the implications of decarbonizing the grid for reliability and cost, proceeding as existing natural gas and electric end use equipment reaches normal end of life.
Association CEO Tim Egan says the numbers are "pretty daunting" and support the integration of natural gas with electric, amid Canada's race to net-zero commitments, instead of using an electric-only option as the most cost-efficient way for Canada to reach environmental policy goals.
But Keith Stewart, senior energy strategist with Greenpeace Canada, says scientists are calling for the world to get to net-zero emissions by 2050, and Canada's net-zero by 2050 target underscores that urgency to avoid "catastrophic" levels of warming, so investing in natural gas infrastructure to then shut it down seems a "very expensive option."
Related News
Related News
Quebec and other provinces heading toward electricity shortage: report
Canada Electricity Shortage threatens renewable energy transition as EV adoption and building decarbonization surge; Hydro-Quebec…
View more

Commission unveils Grids Package to speed transmission and distribution upgrades
European Grids Package sets out accelerated permits and digital tools to modernize transmission and distribution…
View more
Hydro One employees support Province of Ontario in the fight against COVID-19
Hydro One COVID-19 Quarantine Support connects Ontario's Ministry of Health with trained customer service teams…
View more
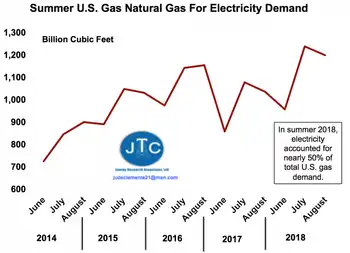
Nonstop Records For U.S. Natural-Gas-Based Electricity
U.S. Natural Gas Power Demand is surging for electricity generation amid summer heat, with ERCOT,…
View more
Canada in top 10 for hydropower jobs, but doesn't rank on other renewables
Canada Renewable Energy Jobs rank top 10 in hydropower, says IRENA, but trail in solar…
View more
Electricity prices rise more than double EU average in first half of 2021
Estonia energy prices 2021 show sharp electricity hikes versus the EU average, mixed natural gas…
View more
Sign Up for Electricity Forum’s Newsletter
Stay informed with our FREE Newsletter — get the latest news, breakthrough technologies, and expert insights, delivered straight to your inbox.
Electricity Today T&D Magazine Subscribe for FREE

Stay informed with the latest T&D policies and technologies.
- Timely insights from industry experts
- Practical solutions T&D engineers
- Free access to every issue

