Minnesota Signs Deal With Manitoba Hydro
WINNIPEG -- - The Minnesota Public Utilities Commission has unanimously approved a $1.7 billion power export deal with Manitoba Hydro.
It allows Minneapolis-based Xcel Energy to import power from Manitoba Hydro, despite the objections of aboriginal groups.
The 500-megawatt, 10-year deal was given the go-ahead.
It's an extension of an existing deal and will allow power to be exported until 2015.
Approval by Canada's National Energy Board is pending.
The Minnesota decision is a blow to the Pimicikamak Cree Nation of Cross Lake, Manitoba. They had asked the commission to first call a formal hearing into the social and economic impact of historic hydro development on their homeland.
Related News
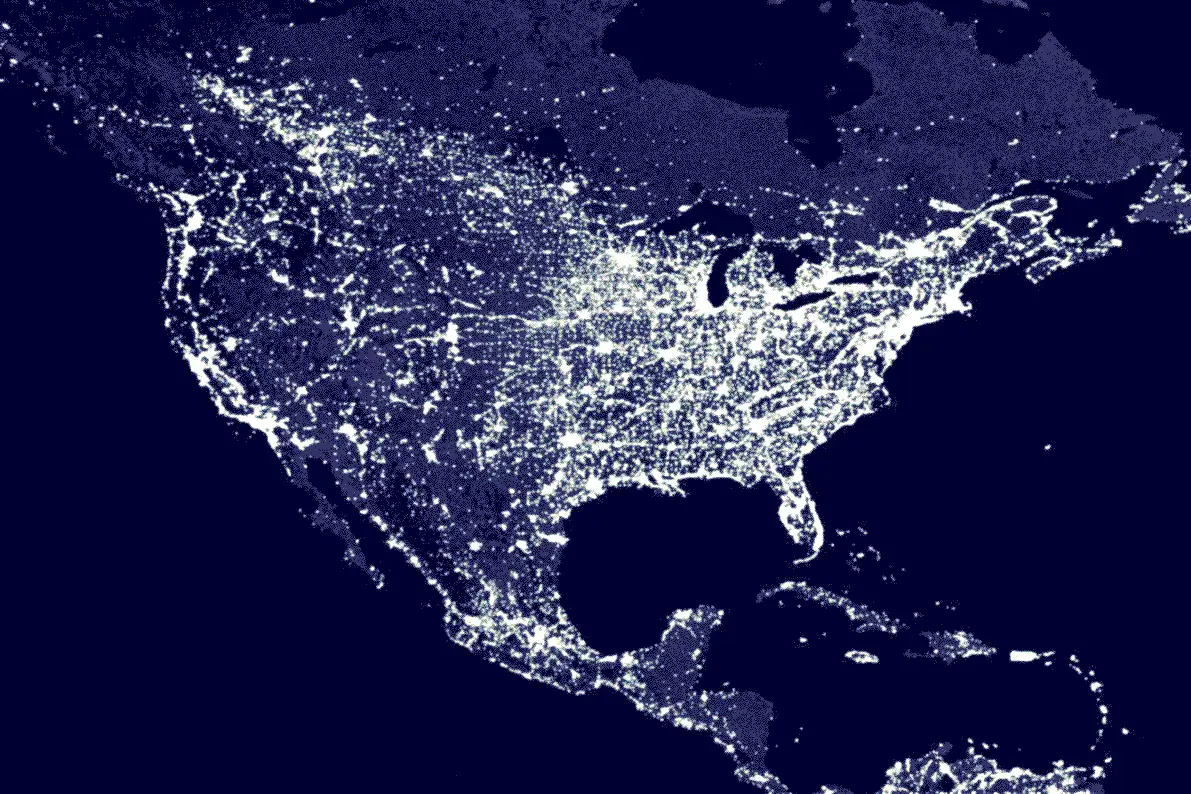
Military Is Ramping Up Preparation For Major U.S. Power Grid Hack
WASHINGTON - DARPA RADICS Power Grid Security targets DoD resilience to cyber attacks, delivering early warning, detection, isolation, and characterization tools, plus a secure emergency network to protect critical infrastructure and speed grid restoration and communications.
Key Points
A DoD/DARPA initiative to detect, contain, and rapidly recover the U.S. grid from sophisticated cyber attacks.
✅ Early warning separates attacks from routine outages
✅ Pinpoints intrusion points and malware used
✅ Builds secure emergency network for rapid restoration
The U.S. Department of Defense is growing increasingly concerned about hackers taking down our power grid and crippling the nation, reflecting…