Investing in coal plants carries real risk

By The Bond Buyer


Substation Relay Protection Training

Our customized live online or in‑person group training can be delivered to your staff at your location.

  • Live Online
  • 12 hours Instructor-led
  • Group Training Available
Regular Price:
$699
Coupon Price:
$599
Reserve Your Seat Today
Andrew Ackerman's January 13 article "Climate Disclosure Sought" accurately reflects the current state of public debate on disclosure of financial risk to investors in tax-exempt bonds that support new and existing coal-fired electric generation plants. It is a debate fraught with paradox and risk.

Federal energy experts, the Rural Utility Service, have stopped allowing federal tax dollars to be invested in these coal plants because they are risky investments. In large measure this is due to impending costs imposed due to new carbon regulations.

Federal finance experts at the Treasury Department have ignored this energy expertise and issued no guidance to bond investors, as if the risk to a federal tax dollar were somehow different than a bondholder's dollar.

Our credit rating agencies seem equally confused. In your article a representative of Moody's defends a recent bond disclosure for a new coal plant because the offering document contains some discussion of carbon risk. The disclosure he defends ignores the same worrisome set of credit risks that Moody's warned about in February 2008 in a special report on climate risk.

Developers of coal plants and utilities face not only the risk of new carbon regulations and the costs from them, but they also face compliance costs with regard to sulfur dioxide, mercury and other air pollution requirements.

The recent ash spill in Tennessee has added future regulation of ash disposal onto the list of new costs. The volatility of future coal costs have been raised as a matter of concern by federal agencies as well.

Moody's and Standard & Poor's have raised the issue of "cumulative risk" in their reports. Future carbon regulation alone creates a significant financial risk to coal as a future resource for electricity generation. However, as a pure financial play it is the combination of regulatory burdens and shifting market realities related to coal generation that requires a full explanation for investors.

The recent changes in the nation's fortunes related to its natural gas supply have placed the rising cost of coal into stark relief against its competition: wind, solar, natural gas and energy efficiency. Progress Energy's recent decision to close much of its existing coal fleet rests on its own cost-benefit analysis of these risks.

Comprehensive disclosure of information to bond investors is essential to smooth market functioning. This needs to include untidy facts like the federal government pulling out of financing coal plants, as well as disclosure of the cumulative costs from factoring the real cost of coal into the price of electricity, even if it shows that coal-plant investments are no longer competitive.

Related News

Bruce nuclear reactor taken offline as $2.1B project 'officially' begins

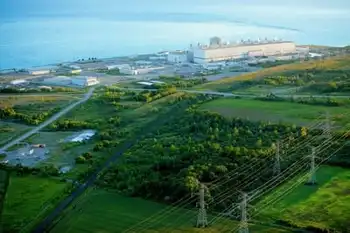
Bruce Power Unit 6 refurbishment replaces major reactor components, shifting supply to hydroelectric and natural gas, sustaining Ontario jobs, extending plant life to 2064, and managing radioactive waste along Lake Huron, on-time and on-budget.


Key Points

A 4-year, $2.1B reactor overhaul within a 13-year, $13B program to extend plant life to 2064 and support Ontario jobs.

✅ Unit 6 offline 4 years; capacity shift to hydro and gas

✅ Part of 13-year, $13B program; extends life to 2064

✅ Creates jobs; manages radioactive waste at Lake Huron


The world’s largest nuclear fleet, became a little smaller Monday morning. Bruce Power has began the process to take Unit 6 offline to begin a $2.1 billion project, supported by manufacturing contracts with key suppliers, to replace all the major components of the reactor.

The reactor, which produces enough electricity to power 750,000 homes and reflects higher output after upgrades across the site, will be out of service for the next four years.

In its place, hydroelectric power and natural gas will be utilized more.

Taking Unit 6 offline is just the “official” beginning of a 13-year, $13-billion project to refurbish six of Bruce Power’s eight nuclear reactors, as Ontario advances the Pickering B refurbishment as well on its grid.

Work to extend the life of the nuclear plant started in 2016, and the company recently marked an operating record while supporting pandemic response, but the longest and hardest part of the project - the major component replacement - begins now.

“The Unit 6 project marks the next big step in a long campaign to revitalize this site,” says Mike Rencheck, Bruce Power’s president and CEO.

The overall project is expected to last until 2033, and mirrors life extensions at Pickering supporting Ontario’s zero-carbon goals, but will extend the life of the nuclear plant until 2064.

Extending the life of the Bruce Power nuclear plant will sustain 22,000 jobs in Ontario and add $4 billion a year in economic activity to the province, say Bruce Power officials.

About 2,000 skilled tradespeople will be required for each of the six reactor refurbishments - 4,200 people already work at the sprawling nuclear plant near Kincardine.

It will also mean tons of radioactive nuclear waste will be created that is currently stored in buildings on the Bruce Power site, along the shores of Lake Huron.

Bruce Power restarted two reactors back in 2012, and in later years doubled a PPE donation to support regional health partners. That project was $2-billion over-budget, and three years behind schedule.

Bruce Power officials say this refurbishment project is currently on-time and on-budget.


Related News

View more

Electricity Demand In The Time Of COVID-19

COVID-19 Impact on U.S. Power Demand shows falling electricity load, lower wholesale prices, and resilient utilities in competitive markets, with regional differences tied to weather, renewable energy, stay-at-home orders, and hedging strategies.


Key Points

It outlines reduced load and prices, while regulatory design and hedging support utility stability across regions.

✅ Load down in NY, New England, PJM; weather drives South up.

✅ Wholesale prices fall 8-10% in key markets.

✅ Decoupling, contracts, hedging support utility earnings.


On March 27, Bloomberg New Energy Finance (BNEF) released a report on electricity demand and wholesale market prices impact from COVID-19 fallout. The model compares expected load based largely on weather with actual observed electricity demand changes.

So far, the hardest hit power grid is New York, with load down 7 and prices off by 10 percent. That’s expected, given New York City is the current epicenter of the US health crisis.

Next is New England, with 5 percent lower demand and 8 percent reduced wholesale prices for the week from March 19-25. BNEF says the numbers could go higher following advisories and orders issued March 24 for some 70 percent of the region’s population to stay at home.

Demand on the biggest grid in the US, the PJM (Pennsylvania/Jersey/Maryland), is 4 percent lower, with prices dropping 8 percent, as recent capacity auction payouts fell sharply. BNEF believes there will be more impact as stay at home orders are ramped up in several states.

California’s power demand for March 19-25 was 5 percent below what BNEF’s model expects without COVID-19 impact. That reflects a full week of stay-at-home orders from Governor Newsom issued March 19.

Health officials in Los Angeles and elsewhere expect a spike in COVID-19 cases in coming weeks. But BNEF’s model now actually projects rising electricity load for the state, due to what it calls "freakishly mild weather a year ago."

Rounding out the report, power demand is up for a band of southern states stretching from Florida to the desert Southwest, with weather more than offsetting public response to COVID-19 so far. BNEF says the Northwest’s grid "has not yet been highly impacted," while the Southeast is "generally in line" with pre-virus expectations.

Clearly, all of this data can change quickly and radically. Only California and New York are currently in full shutdown mode. Following them are New England (70 percent), the Midwest (65 percent), Texas (50 percent), PJM (50 percent) and the Northwest (50 percent).

In contrast, only small parts of Florida, the Southeast and Southwest are restricting movement. That could mean a big future increase for shut-ins, with heightened risks of electricity shut-offs that burden households and a corresponding impact on power demand.

Also, weather will play a major role on what happens to actual electricity demand, just as it always does. A very hot summer, for example, could offset virus-related shut-ins, just as it apparently is now in states like Texas. And it should be pointed out that regions vary widely by exposure to recession-sensitive sources of demand, such as heavy industry.

Most important for investors, however, is the built in protection US utility earnings enjoy from declining power demand, even amid broader energy crisis pressures facing the sector. For one thing, US power grids in California, ERCOT (Texas), MISO (Midwest), New England, New York and PJM have wholesale power markets, where producers compete for sales and the lowest bidder sets the price.

In those states, most regulated utilities don’t produce power at all. In fact, companies’ revenue is decoupled entirely from demand in California, as well as much of New England. In the roughly three-dozen states where utilities still operate as integrated monopolies, demand does affect revenue, and in many regions flat electricity demand already persists. But the cost of electricity is passed through directly to customers, whether produced or purchased.

A number of US electric companies have invested in renewable energy facilities as part of broader electrification trends nationwide. These sell their output under long-term contracts primarily with other utilities and government entities.

This isn’t a risk free business: For the past year, generators selling electricity to bankrupt PG&E Corp (PCG) have had their cash trapped at the power plant level as surety for lenders. But even PG&E has honored its contracts. And with states continuing aggressive mandates for renewable energy adoption, growth doesn’t appear at risk to COVID-19 fallout either.

The wholesale price of power from natural gas, coal and many nuclear plants was already sliding before COVID-19, due to renewables adoption and low natural gas prices, even as coal and nuclear disruptions raise reliability concerns. But here too, big producers like Exelon Corp (EXC) and Vistra Energy (VST) have employed aggressive price hedging near term, with regulated utilities and retail businesses protecting long-term health, respectively.

Bottom line: It’s early days for the COVID-19 crisis and much can still change. But so far at least, the US power industry is absorbing the blow of reduced demand, just as it’s done in previous crises.

That means future selloffs in the ongoing bear market are buying opportunities for best in class electric utilities, not a reason to sell. For top candidates, see the Conrad’s Utility Investor Portfolios and Dream Buy List in the March issue. 


Related News

View more

Toshiba, Tohoku Electric Power and Iwatani start development of large H2 energy system

Fukushima Hydrogen Energy System leverages a 10,000 kW H2 production hub for grid balancing, demand response, and renewable integration, delivering hydrogen supply across Tohoku while supporting storage, forecasting, and flexible power management.


Key Points

A 10,000 kW H2 project in Namie for grid balancing, renewable integration, and regional hydrogen supply.

✅ 10,000 kW H2 production hub in Namie, Fukushima

✅ Balances renewable-heavy grids via demand response

✅ Supported by NEDO; partners Toshiba, Tohoku Electric, Iwatani


Toshiba Corporation, Tohoku Electric Power Co. and Iwatani Corporation have announced they will construct and operate a large-scale hydrogen (H2) energy system in Japan, based on a 10,000 kilowat class H2 production facility, which reflects advances in PEM hydrogen R&D worldwide.

The system, which will be built in Namie-Cho, Fukushima, will use H2 to offset grid loads and deliver H2 to locations in Tohoku and beyond, while complementary approaches like power-to-gas storage in Europe demonstrate broader storage options, and will seek to demonstrate the advantages of H2 as a solution in grid balancing and as a H2 gas supply.

The product has won a positive evaluation from Japan’s New Energy and Industrial Technology Development Organisation (NEDO), and its continued support for the transition to the technical demonstration phase. The practical effectiveness of the large-scale system will be determined by verification testing in financial year 2020, even as interest grows in nuclear beyond electricity for complementary services.

The main objectives of the partners are to promote expanded use of renewable energy in the electricity grid, including UK offshore wind investment by Japanese utilities, in order to balance supply and demand and process load management; and to realise a new control system that optimises H2 production and supply with demand forecasting for H2.

Hiroyuki Ota, General Manager of Toshiba’s Energy Systems and Solutions Company, said, “Through this project, Toshiba will continue to provide comprehensive H2 solutions, encompassing all processes from the production to utilisation of hydrogen.”

Manager of Tohoku Electric Power Co., Ltd, Mitsuhiro Matsumoto, added, “We will study how to use H2 energy systems to stabilize electricity grids with the aim of increasing the use of renewable energy and contributing to Fukushima.”

Moriyuki Fujimoto, General Manager of Iwatani Corporation, commented, “Iwatani considers that this project will contribute to the early establishment of a H2 economy that draws on our experience in the transportation, storage and supply of industrial H2, and the construction and operation of H2stations.”

Japan’s Ministry of Economy, Trade and Industry’s ‘Long-term Energy Supply and Demand Outlook’ targets increasing the share of renewable energy in Japan’s overall power generation mix from 10.7% in 2013 to 22-24% by 2030. Since output from renewable energy sources is intermittent and fluctuates widely with the weather and season, grid management requires another compensatory power source, as highlighted by a near-blackout event in Japan. The large hydrogen energy system is expected to provide a solution for grids with a high penetration of renewables.


Related News

View more

No time to be silent on NZ's electricity future

New Zealand Renewable Energy Strategy examines decarbonisation, GHG emissions, and net energy as electrification accelerates, expanding hydro, geothermal, wind, and solar PV while weighing intermittency, storage, materials, and energy security for a resilient power system.


Key Points

A plan to expand electricity generation, balancing decarbonisation, net energy limits, and energy security.

✅ Distinguishes decarbonisation targets from renewable capacity growth

✅ Highlights net energy limits, intermittency, and storage needs

✅ Addresses materials, GHG build-out costs, and energy security


The Electricity Authority has released a document outlining a plan to achieve the Government’s goal of more than doubling the amount of electricity generated in New Zealand over the next few decades.

This goal is seen as a way of both reducing our greenhouse gas (GHG) emissions overall, as everything becomes electrified, and ensuring we have a 100 percent renewable energy system at our disposal. Often these two goals are seen as being the same – to decarbonise we must transition to more renewable energy to power our society.

But they are quite different goals and should be clearly differentiated. GHG emissions could be controlled very effectively by rationing the use of a fossil fuel lockdown approach, with declining rations being available over a few years. Such a direct method of controlling emissions would ensure we do our bit to remain within a safe carbon budget.

If we took this dramatic step we could stop fretting about how to reduce emissions (that would be guaranteed by the rationing), and instead focus on how to adapt our lives to the absence of fossil fuels.

Again, these may seem like the same task, but they are not. Decarbonising is generally thought of in terms of replacing fossil fuels with some other energy source, signalling that a green recovery must address more than just wind capacity. Adapting our lives to the absence of fossil fuels pushes us to ask more fundamental questions about how much energy we actually need, what we need energy for, and the impact of that energy on our environment.

MBIE data indicate that between 1990 and 2020, New Zealand almost doubled the total amount of energy it produced from renewable energy sources - hydro, geothermal and some solar PV and wind turbines.

Over this same time period our GHG emissions increased by about 25 percent. The increase in renewables didn’t result in less GHG emissions because we increased our total energy use by almost 50 percent, mostly by using fossil fuels. The largest fossil fuel increases were used in transport, agriculture, forestry and fisheries (approximately 60 percent increases for each).

These data clearly demonstrate that increasing renewable energy sources do not necessarily result in reduced GHG emissions.

The same MBIE data indicate that over this same time period, the amount of Losses and Own Use category for energy use more than doubled. As of 2020 almost 30 percent of all energy consumed in New Zealand fell into this category.

These data indicate that more renewable energy sources are historically associated with less energy actually being available to do work in society.

While the category Losses and Own Use is not a net energy analysis, the large increase in this category makes the call for a system-wide net energy analysis all the more urgent.

Net energy is the amount of energy available after the energy inputs to produce and deliver the energy is subtracted. There is considerable data available indicating that solar PV and wind turbines have a much lower net energy surplus than fossil fuels.

And there is further evidence that when the intermittency and storage requirements are engineered into a total renewable energy system, the net energy of the entire system declines sharply. Could the Losses and Other Uses increase over this 30-year period be an indication of things to come?

Despite the importance of net energy analysis in designing a national energy system which is intended to provide energy security and resilience, there is not a single mention of net energy surplus in the EA reference document.

So over the last 30 years, New Zealand has doubled its renewable energy capacity, and at the same time increased its GHG emissions and reduced the overall efficiency of the national energy system.

And we are now planning to more than double our renewable energy system yet again over the next 30 years, even as zero-emissions electricity by 2035 is being debated elsewhere. We need to ask if this is a good idea.

How can we expand New Zealand’s solar PV and wind turbines without using fossil fuels? We can’t.

How could we expand our solar PV and wind turbines without mining rare minerals and the hidden costs of clean energy they entail, further contributing to ecological destruction and often increasing social injustices? We can't.

Even if we could construct, deliver, install and maintain solar PV and wind turbines without generating more GHG emissions and destroying ecosystems and poor communities, this “renewable” infrastructure would have to be replaced in a few decades. But there are at least two major problems with this assumed scenario.

The rare earth minerals required for this replacement will already be exhausted by the initial build out. Recycling will only provide a limited amount of replacements.

The other challenge is that a mostly “renewable” energy system will likely have a considerably lower net energy surplus. So where, in 2060, will the energy come from to either mine or recycle the raw materials, and to rebuild, reinstall and maintain the next iteration of a renewable energy system?

There is currently no plan for this replacement. It is a serious misnomer to call these energy technologies “renewable”. They are not as they rely on considerable raw material inputs and fossil energy for their production and never ending replacement.

New Zealand is, of course, blessed with an unusually high level of hydro electric and geothermal power. New Zealand currently uses over 170 GJ of total energy per capita, 40 percent of which is “renewable”. This provides approximately 70 GJ of “renewable” energy per capita with our current population.

This is the average global per capita energy level from all sources across all nations, as calls for 100% renewable energy globally emphasize. Several nations operate with roughly this amount of total energy per capita that New Zealand can generate just from “renewables”.

It is worth reflecting on the 170 GJ of total energy use we currently consume. Different studies give very different results regarding what levels are necessary for a good life.

For a complex industrial society such as ours, 100 GJ pc is said to be necessary for a high levels of wellbeing, determined both subjectively (life satisfaction/ happiness measures), and objectively (e.g. infant mortality levels, female morbidity as an index of population health, access to nutritious food and educational and health resources, etc). These studies do not take into account the large amount of energy that is wasted either through inefficient technologies, or frivolous use, which effective decarbonization strategies seek to reduce.

Other studies that consider the minimal energy needed for wellbeing suggest a much lower level of per capita energy consumption is required. These studies take a different approach and focus on ensuring basic wellbeing is maintained, but not necessarily with all the trappings of a complex industrial society. Their results indicate a level of approximately 20 GJ per capita is adequate.

In either case, we in New Zealand are wasting a lot of energy, both in terms of the efficiency of our technologies (see the Losses and Own Use info above), and also in our uses which do not contribute to wellbeing (think of the private vehicle travel that could be done by active or public transport – if we had good infrastructure in place).

We in New Zealand need a national dialogue about our future. And energy availability is only one aspect. We need to discuss what our carrying capacity is, what level of consumption is sustainable for our population, and whether we wish to make adjustments in either our per capita consumption or our population. Both together determine whether we are on the sustainable side of carrying capacity. Currently we are on the unsustainable side, meaning our way of life cannot endure. Not a good look for being a good ancestor.

The current trajectory of the Government and Electricity Authority appears to be grossly unsustainable. At the very least they should be able to answer the questions posed here about the GHG emissions from implementing a totally renewable energy system, the net energy of such a system, and the related environmental and social consequences.

Public dialogue is critical to collectively working out our future. Allowing the current profit-driven trajectory to unfold is a recipe for disasters for our children and grandchildren.

Being silent on these issues amounts to complicity in allowing short-term financial interests and an addiction to convenience jeopardise a genuinely secure and resilient future. Let’s get some answers from the Government and Electricity Authority to critical questions about energy security.


Related News

View more

U.S. Residents Averaged Fewer Power Outages in 2022

2022 U.S. Power Outage Statistics show lower SAIDI as fewer major events hit, with SAIFI trends, electric reliability, outage duration and frequency shaped by hurricanes, winter storms, vegetation, and utility practices across states.


Key Points

They report SAIDI and SAIFI for 2022, showing outage duration, frequency, and impacts of major weather events.

✅ 2022 SAIDI averaged 5.6 hours; SAIFI averaged 1.4 interruptions.

✅ Fewer major events lowered outage duration versus 2021.

✅ Hurricanes and winter storms drove long outages in several states.


In 2022, U.S. electricity consumers on average experienced about 5.5 hours of power disruptions, a decrease from nearly two hours compared to 2021. This information comes from the latest Annual Electric Power Industry Report. The reduction in yearly power interruptions primarily resulted from fewer significant events in 2022 compared to the previous year, and utility disaster planning continues to support grid resilience as severe weather persists.

Since 2013, excluding major events, the annual average duration of power interruptions has consistently hovered around two hours. Factors contributing to major power disruptions include weather-related incidents, vegetation interference near power lines, and specific utility practices, while pandemic-related grid operations influenced workforce planning more than outage frequency. To assess the reliability of U.S. electric utilities, two key indexes are utilized:

  • The System Average Interruption Duration Index (SAIDI) calculates the total length (in hours) an average customer endures non-brief power interruptions over a year.
  • The System Average Interruption Frequency Index (SAIFI) tracks the number of times interruptions occur.

The influence of major events on electrical reliability is gauged by comparing affected states' SAIDI and SAIFI values against the U.S. average, which was 5.6 hours of outages and 1.4 outages per customer in 2022. The year witnessed 18 weather-related disasters in the U.S., each resulting in over $1 billion in damages, and COVID-19 grid assessments indicated the electricity system was largely safe from pandemic impacts. Noteworthy major events include:

  • Hurricane Ian in September 2022, leaving over 2.6 million Floridian customers without electricity, with restoration in some areas taking weeks rather than days.
  • Hurricane Nicole in November 2022, causing over 300,000 Florida customers to lose power.
  • Winter Storm Elliott in December 2022, affecting over 1.5 million customers in multiple states including Texas where utilities struggled after Hurricane Harvey to restore service, and Florida, and bringing up to four feet of snow in parts of New York.

In 2022, states like Florida, West Virginia, Maine, Vermont, and New Hampshire experienced the most prolonged power interruptions, with New Hampshire averaging 10.3 hours and Florida 19.1 hours, and FPL's Irma storm response illustrates how restoration can take days or weeks in severe cases. Conversely, the District of Columbia, Delaware, Rhode Island, Nebraska, and Iowa had the shortest total interruptions, with the District of Columbia averaging just 34 minutes and Iowa 85 minutes.

The frequency of outages, unlike their duration, is more often linked to non-major events. Across the nation, Alaska recorded the highest number of power disruptions per customer (averaging 3.5), followed by several heavily forested states like Tennessee and Maine. Power outages due to falling tree branches are common, particularly during winter storms that burden tree limbs and power lines, as seen in a North Seattle outage affecting 13,000 customers. The District of Columbia stood out with the shortest and fewest outages per customer.


Related News

View more

Victims of California's mega-fire will sue electricity company

PG&E Wildfire Lawsuit alleges utility negligence, inadequate infrastructure maintenance, and faulty transmission lines, as victims seek compensation. Regulators investigate the blaze, echoing class actions after Victoria's Black Saturday mega-fires and utility oversight failures.


Key Points

PG&E Wildfire Lawsuit alleges utility negligence and power line faults, seeking victim compensation amid investigations.

✅ Alleged failure to maintain transmission infrastructure

✅ Spark reports and regulator filings before blaze erupted

✅ Class action parallels with Australia's Black Saturday


Victims of California's most destructive wildfire have filed a lawsuit accusing Pacific Gas & Electric Co. of causing the massive blaze, a move that follows the utility's 2018 Camp Fire guilty plea in a separate case.

The suit filed on Tuesday in state court in California accuses the utility of failing to maintain its infrastructure and properly inspect and manage its power transmission lines, amid prior reports that power lines may have sparked fires in California.

The utility's president said earlier the company doesn't know what caused the fire, but is cooperating with the investigation by state agencies, and other utilities such as Southern California Edison have faced wildfire lawsuits in California.

PG&E told state regulators last week that it experienced a problem with a transmission line in the area of the fire just before the blaze erupted.

A landowner near where the blaze began said PG&E notified her the day before the wildfire that crews needed to come onto her property because some wires were sparking, and the company later promoted its wildfire assistance program for victims seeking aid.

A massive class action after Australia's last mega-fire, Victoria's Black Saturday in 2009, saw $688.5 million paid in compensation to thousands of claimants affected by the Kilmore-Kinglake and Murrindindi-Marysville fires, partly by electricity company SP Ausnet, and partly by government agencies, while in California PG&E's bankruptcy plan won support from wildfire victims addressing compensation claims.


Related News

View more

Sign Up for Electricity Forum’s Newsletter

Stay informed with our FREE Newsletter — get the latest news, breakthrough technologies, and expert insights, delivered straight to your inbox.

Electricity Today T&D Magazine Subscribe for FREE

Stay informed with the latest T&D policies and technologies.
  • Timely insights from industry experts
  • Practical solutions T&D engineers
  • Free access to every issue

Live Online & In-person Group Training

Advantages To Instructor-Led Training – Instructor-Led Course, Customized Training, Multiple Locations, Economical, CEU Credits, Course Discounts.

Request For Quotation

Whether you would prefer Live Online or In-Person instruction, our electrical training courses can be tailored to meet your company's specific requirements and delivered to your employees in one location or at various locations.