Florida Court Blocks Push to Break Electricity Monopolies


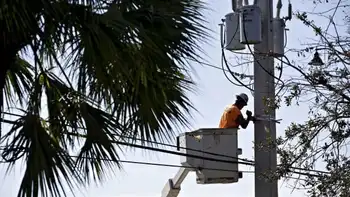
florida lineman

NFPA 70b Training - Electrical Maintenance

Our customized live online or in‑person group training can be delivered to your staff at your location.

  • Live Online
  • 12 hours Instructor-led
  • Group Training Available
Regular Price:
$599
Coupon Price:
$499
Reserve Your Seat Today

Florida Electricity Deregulation Ruling highlights the Florida Supreme Court decision blocking a ballot measure on retail choice, preserving utility monopolies for NextEra and Duke Energy, while similar deregulation efforts arise in Virginia and Arizona.


Key Points

A high court decision removing a retail choice ballot measure, keeping Florida utility monopolies intact for incumbents.

✅ Petition language deemed misleading for 2020 ballot

✅ Preserves NextEra and Duke Energy market dominance

✅ Similar retail choice pushes in VA and AZ


Florida’s top court ruled against a proposed constitutional amendment that would have allowed customers to pick their electricity provider, even as Florida solar incentives face rejection by state leaders, threatening monopolies held by utilities such as NextEra Energy Inc. and Duke Energy Corp.

In a ruling Thursday, the court said the petition’s language is “misleading” and doesn’t comply with requirements to be included on the 2020 ballot, reflecting debates over electricity pricing changes at the federal level. The measure’s sponsor, Citizens for Energy Choice, said the move ends the initiative, even as electricity future advocacy continues nationwide.

“While we were confident in our plan to gather the remaining signatures required, we cannot overcome this last obstacle,” the group’s chair, Alex Patton, noting ongoing energy freedom in the South efforts, said in a statement.

The proposed measure was one of several efforts underway to deregulate U.S. electricity markets, including New York’s review of retail energy markets this year. Earlier this week, two Virginia state lawmakers unveiled a bill to allow residents and businesses to pick their electricity provider, threatening Dominion Energy Inc.’s longstanding local monopoly. And in Arizona, where Arizona Public Service Co. has long reigned, regulators are considering a similar move, while in New England Hydro-Quebec’s export bid has been energized by a court decision.

Related News

Cheap material converts heat to electricity

Polycrystalline Tin Selenide Thermoelectrics enable waste heat recovery with ZT 3.1, matching single crystals while cutting costs, powering greener car engines, industrial furnaces, and thermoelectric generators via p-type and emerging n-type designs.


Key Points

Low-cost tin selenide devices that turn waste heat into power, achieving ZT 3.1 and enabling p-type and n-type modules.

✅ Oxygen removal prevents heat-leaking tin oxide grain skins.

✅ Polycrystalline ingots match single-crystal ZT 3.1 at lower cost.

✅ N-type tin selenide in development to pair with p-type.


So-called thermoelectric generators turn waste heat into electricity without producing greenhouse gas emissions, providing what seems like a free lunch. But despite helping power the Mars rovers, the high cost of these devices has prevented their widespread use. Now, researchers have found a way to make cheap thermoelectrics that work just as well as the pricey kind. The work could pave the way for a new generation of greener car engines, industrial furnaces, and other energy-generating devices.

“This looks like a very smart way to realize high performance,” says Li-Dong Zhao, a materials scientist at Beihang University who was not involved with the work. He notes there are still a few more steps to take before these materials can become high-performing thermoelectric generators. However, he says, “I think this will be used in the not too far future.”

Thermoelectrics are semiconductor devices placed on a hot surface, like a gas-powered car engine or on heat-generating electronics using thin-film converters to capture waste heat. That gives them a hot side and a cool side, away from the hot surface. They work by using the heat to push electrical charges from one to the other, a process of turning thermal energy into electricity that depends on the temperature gradient. If a device allows the hot side to warm up the cool side, the electricity stops flowing. A device’s success at preventing this, as well as its ability to conduct electrons, feeds into a score known as the figure of merit, or ZT.

 Over the past 2 decades, researchers have produced thermoelectric materials with increasing ZTs, while related advances such as nighttime solar cells have broadened thermal-to-electric concepts. The record came in 2014 when Mercouri Kanatzidis, a materials scientist at Northwestern University, and his colleagues came up with a single crystal of tin selenide with a ZT of 3.1. Yet the material was difficult to make and too fragile to work with. “For practical applications, it’s a non-starter,” Kanatzidis says.

So, his team decided to make its thermoelectrics from readily available tin and selenium powders, an approach that, once processed, makes grains of polycrystalline tin selenide instead of the single crystals. The polycrystalline grains are cheap and can be heated and compressed into ingots that are 3 to 5 centimeters long, which can be made into devices. The polycrystalline ingots are also more robust, and Kanatzidis expected the boundaries between the individual grains to slow the passage of heat. But when his team tested the polycrystalline materials, the thermal conductivity shot up, dropping their ZT scores as low as 1.2.

In 2016, the Northwestern team discovered the source of the problem: an ultrathin skin of tin oxide was forming around individual grains of polycrystalline tin selenide before they were pressed into ingots. And that skin acted as an express lane for the heat to travel from grain to grain through the material. So, in their current study, Kanatzidis and his colleagues came up with a way to use heat to drive any oxygen away from the powdery precursors, leaving pristine polycrystalline tin selenide, whereas other devices can generate electricity from thin air using ambient moisture.

The result, which they report today in Nature Materials, was not only a thermal conductivity below that of single-crystal tin selenide but also a ZT of 3.1, a development that echoes nighttime renewable devices showing electricity from cold conditions. “This opens the door for new devices to be built from polycrystalline tin selenide pellets and their applications to be explored,” Kanatzidis says.

Getting through that door will still take some time. The polycrystalline tin selenide the team makes is spiked with sodium atoms, creating what is known as a “p-type” material that conducts positive charges. To make working devices, researchers also need an “n-type” version to conduct negative charges.

Zhao’s team recently reported making an n-type single-crystal tin selenide by spiking it with bromine atoms. And Kanatzidis says his team is now working on making an n-type polycrystalline version. Once n-type and p-type tin selenide devices are paired, researchers should have a clear path to making a new generation of ultra-efficient thermoelectric generators. Those could be installed everywhere from automobile exhaust pipes to water heaters and industrial furnaces to scavenge energy from some of the 65% of fossil fuel energy that winds up as waste heat. 


Related News

View more

India Electricity Prices are Spiking

India spot electricity prices surged on Q3 demand, lifting power tariffs in the spot market as discoms scrambled for supply; Sembcorp SGPL boosted PLF and short-term PPA realizations, benefiting from INR per kWh peaks.


Key Points

India spot electricity prices hit Q3 records amid demand spikes, lifting tariffs and aiding Sembcorp SGPL via PLF gains.

✅ Record 10.6 cents/kWh average; 15-minute peak 20.7 cents/kWh

✅ SGPL shifted output to short-term PPA at 7.3 cents/kWh

✅ PLF ramped above 90%, cutting core losses by 30-40%


Electricity prices in India, now the third-largest electricity producer globally, bolted to a record high of 10.6 cents/kWh (INR5.1/kWh) in Q3.

A jolt in Indian spot electricity prices could save Sembcorp Industries' Indian business from further losses, even though demand has occasionally slumped in recent years, UOB Kay Hian said.

The firm said spot electricity prices in India bolted to a record high of 10.6 cents/kWh (INR5.1/kWh) in Q3 and even hit a 15-minute peak of 20.7 cents/kWh (9.9/kWh). The spike was due to a power supply crunch on higher electricity demand from power distribution companies, alongside higher imported coal volumes as domestic supplies shrank.

As an effect, Sembcorp Industries' Sembcorp Gayatri Power Limited's (SGPL) losses of $26m in Q1 and $29m in Q2 could narrow down by as much as 30-40%.

On a net basis, SGPL will recognise a significantly higher electricity tariff in 3Q17. By tactically shutting down its Unit #3 for maintenance, Unit #4 effectively had its generation contracted out at the higher short-term PPA tariff of around 7.3 cents/kWh (Rs3.5/kWh).

SGPL also capitalised on the price spike in 3Q17 as it ramped up its plant load factor (PLF) to more than 90%.

“On the back of this, coupled with the effects of reduced finance costs, we expect SGPL’s 3Q17 quarterly core loss to shrink by 30-40% from previous quarters,” UOB Kay Hian said.

Whilst electricity prices have corrected to 7.1 cents/kWh (INR3.4/kWh), the firm said it could still remain elevated on structural factors, even as coal and electricity shortages ease nationwide.

Sembcorp Industries' India operations brought in a robust performance for Q3. PLF for Thermal Powertech Corporation India Limited (TPCIL) hit 91%, whilst it reached 73% for SGPL, echoing the broader trend of thermal PLF up across the sector.


Related News

View more

German renewables deliver more electricity than coal and nuclear power for the first time

Germany renewable energy milestone 2019 saw wind, solar, hydropower, and biomass outproduce coal and nuclear, as low gas prices and high CO2 costs under the EU ETS reshaped the electricity mix, per Fraunhofer ISE.


Key Points

It marks H1 2019 when renewables supplied 47.3% of Germany's electricity, surpassing coal and nuclear.

✅ Driven by high CO2 prices and cheap natural gas

✅ Wind and solar output rose; coal generation declined sharply

✅ Flexible gas plants outcompeted inflexible coal units


In Lippendorf, Saxony, the energy supplier EnBW is temporarily taking part of a coal-fired power plant offline. Not because someone ordered it — it simply wasn't paying off. Gas prices are low, CO2 prices are high, and with many hours of sunshine and wind, renewable methods are producing a great deal of electricity as part of Germany's energy transition now reshaping operations. And in the first half of the year there was plenty of sun and wind.

The result was a six-month period in which renewable energy sources, a trend echoed by the EU wind and solar record across the bloc, produced more electricity than coal and nuclear power plants together. For the first time 47.3% of the electricity consumers used came from renewable sources, while 43.4% came from coal-fired and nuclear power plants.

In addition to solar and wind power, renewable sources also include hydropower and biomass. Gas supplied 9.3%, reflecting how renewables are crowding out gas across European power markets, while the remaining 0.4% came from other sources, such as oil, according to figures published by the Fraunhofer Institute for Solar Energy Systems in July.

Fabian Hein from the think tank Agora Energiewende stresses that the situation is only a snapshot in time, with grid expansion woes still shaping outcomes. For example, the first half of 2019 was particularly windy and wind power production rose by around 20% compared to the first half of 2018.

Electricity production from solar panels rose by 6%, natural gas by 10%, while the share of nuclear power in German electricity consumption has remained virtually unchanged despite a nuclear option debate in climate policy.

Coal, on the other hand, declined. Black coal energy production fell by 30% compared to the first half of 2018, lignite fell by 20%. Some coal-fired power plants were even taken off the grid, even as coal still provides about a third of Germany's electricity. It is difficult to say whether this was an effect of the current market situation or whether this is simply part of long-term planning, says Hein.


Activists storm German mine in anti-coal protest

It is clear, however, that an increased CO2 price has made the ongoing generation of electricity from coal more expensive. Gas-fired power plants also emit CO2, but less than coal-fired power plants. They are also more efficient and that's why gas-fired power plants are not so strongly affected by the CO2 price

The price is determined at a European level and covers power plants and energy intensive industries in Europe. Other areas, such as heating or transport are not covered by the CO2 price scheme. Since a reform of CO2 emissions trading in 2017, the price has risen sharply. Whereas in September 2016 it was just over €5 ($5.6), by the end of June 2019 it had climbed to over €26.


Ups and downs

Gas as a raw material is generally more expensive than coal. But coal-fired power plants are more expensive to build. This is why operators want to run them continuously. In times of high demand, and therefore high prices, gas-fired power plants are generally started up, as seen when European power demand hit records during recent heatwaves, since it is worth it at these times.

Gas-fired power plants can be flexibly ramped up and down. Coal-fired power plants take 11 hours or longer to get going. That's why they can't be switched on quickly for short periods when prices are high, like gas-fired power plants. In the first half of the year, however, coal-fired power plants were also ramped up and down more often because it was not always worthwhile to let the power plant run around the clock.

Because gas prices were particularly low in the first half of 2019, some gas-fired power plants were more profitable than coal-fired plants. On June 29, 2019, the gas price at the Dutch trading point TTF was around €10 per megawatt hour. A year earlier, it had been almost €20. This is partly due to the relatively mild winter, as there is still a lot of gas in reserve, confirmed a spokesman for the Federal Association of the Energy and Water Industries (BDEW). There are also several new export terminals for liquefied natural gas. Additionally, weaker growth and trade wars are slowing demand for gas. A lot of gas comes to Europe, where prices are still comparatively high, reported the Handelsblatt newspaper.

The increase in wind and solar power and the decline in nuclear power have also reduced CO2 emissions. In the first half of 2019, electricity generation emitted around 15% less CO2 than in the same period last year, reported BDEW. However, the association demands that the further expansion of renewable energies should not be hampered. The target of 65% renewable energy can only be achieved if the further expansion of renewable energy sources is accelerated.


Related News

View more

Which of the cleaner states imports dirty electricity?

Hourly Electricity Emissions Tracking maps grid balancing areas, embodied emissions, and imports/exports, revealing carbon intensity shifts across PJM, ERCOT, and California ISO, and clarifying renewable energy versus coal impacts on health and climate.


Key Points

An hourly method tracing generation, flows, and embodied emissions to quantify carbon intensity across US balancing areas.

✅ Hourly traces of imports/exports and generation mix

✅ Consumption-based carbon intensity by balancing area

✅ Policy insights for renewables, coal, health costs


In the United States, electricity generation accounts for nearly 30% of our carbon emissions. Some states have responded to that by setting aggressive renewable energy standards; others are hoping to see coal propped up even as its economics get worse. Complicating matters further is the fact that many regional grids are integrated, and as America goes electric the stakes grow, meaning power generated in one location may be exported and used in a different state entirely.

Tracking these electricity exports is critical for understanding how to lower our national carbon emissions. In addition, power from a dirty source like coal has health and environment impacts where it's produced, and the costs of these aren't always paid by the parties using the electricity. Unfortunately, getting reliable figures on how electricity is produced and where it's used is challenging, even for consumers trying to find where their electricity comes from in the first place, leaving some of the best estimates with a time resolution of only a month.

Now, three Stanford researchers—Jacques A. de Chalendar, John Taggart, and Sally M. Benson—have greatly improved on that standard, and they have managed to track power generation and use on an hourly basis. The researchers found that, of the 66 grid balancing areas within the United States, only three have carbon emissions equivalent to our national average, and they have found that imports and exports of electricity have both seasonal and daily changes. de Chalendar et al. discovered that the net results can be substantial, with imported electricity increasing California's emissions/power by 20%.

Hour by hour
To figure out the US energy trading landscape, the researchers obtained 2016 data for grid features called balancing areas. The continental US has 66 of these, providing much better spatial resolution on the data than the larger grid subdivisions. This doesn't cover everything—several balancing areas in Canada and Mexico are tied in to the US grid—and some of these balancing areas are much larger than others. The PJM grid, serving Pennsylvania, New Jersey, and Maryland, for example, is more than twice as large as Texas' ERCOT, in a state that produces and consumes the most electricity in the US.

Despite these limitations, it's possible to get hourly figures on how much electricity was generated, what was used to produce it, and whether it was used locally or exported to another balancing area. Information on the generating sources allowed the researchers to attach an emissions figure to each unit of electricity produced. Coal, for example, produces double the emissions of natural gas, which in turn produces more than an order of magnitude more carbon dioxide than the manufacturing of solar, wind, or hydro facilities. These figures were turned into what the authors call "embodied emissions" that can be traced to where they're eventually used.

Similar figures were also generated for sulfur dioxide and nitrogen oxides. Released by the burning of fossil fuels, these can both influence the global climate and produce local health problems.

Huge variation
The results were striking. "The consumption-based carbon intensity of electricity varies by almost an order of magnitude across the different regions in the US electricity system," the authors conclude. The low is the Bonneville Power grid region, which is largely supplied by hydropower; it has typical emissions below 100kg of carbon dioxide per megawatt-hour. The highest emissions come in the Ohio Valley Electric region, where emissions clear 900kg/MW-hr. Only three regional grids match the overall grid emissions intensity, although that includes the very large PJM (where capacity auction payouts recently fell), ERCOT, and Southern Co balancing areas.

Most of the low-emissions power that's exported comes from the Pacific Northwest's abundant hydropower, while the Rocky Mountains area exports electricity with the highest associated emissions. That leads to some striking asymmetries. Local generation in the hydro-rich Idaho Power Company has embodied emissions of only 71kg/MW-hr, while its imports, coming primarily from Rocky Mountain states, have a carbon content of 625kg/MW-hr.

The reliance on hydropower also makes the asymmetry seasonal. Local generation is highest in the spring as snow melts, but imports become a larger source outside this time of year. As solar and wind can also have pronounced seasonal shifts, similar changes will likely be seen as these become larger contributors to many of these regional grids. Similar things occur daily, as both demand and solar production (and, to a lesser extent, wind) have distinct daily profiles.

The Golden State
California's CISO provides another instructive case. Imports represent less than 30% of its total electric use in 2016, yet California electricity imports provided 40% of its embodied emissions. Some of these, however, come internally from California, provided by the Los Angeles Department of Water and Power. The state itself, however, has only had limited tracking of imported emissions, lumping many of its sources as "other," and has been exporting its energy policies to Western states in ways that shape regional markets.

Overall, the 2016 inventory provides a narrow picture of the US grid, as plenty of trends are rapidly changing our country's emissions profile, including the rise of renewables and the widespread adoption of efficiency measures and other utility trends in 2017 that continue to evolve. The method developed here can, however, allow for annual updates, providing us with a much better picture of trends. That could be quite valuable to track things like how the rapid rise in solar power is altering the daily production of clean power.

More significantly, it provides a basis for more informed policymaking. States that wish to promote low-emissions power can use the information here to either alter the source of their imports or to encourage the sites where they're produced to adopt more renewable power. And those states that are exporting electricity produced primarily through fossil fuels could ensure that the locations where the power is used pay a price that includes the health costs of its production.


Related News

View more

Cabinet Of Ministers Of Ukraine - Prime Minister: Our Goal In The Energy Sector Is To Synchronize Ukraine's Integrated Power System With Entso-e

Ukraine's EU Energy Integration aims for ENTSO-E synchronization, electricity market liberalization, EU Green Deal alignment, energy efficiency upgrades, hydrogen development, and streamlined grid connections to accelerate reform, market pricing, and sustainable growth.


Key Points

Ukraine's EU Energy Integration syncs with ENTSO-E, liberalizes power markets, and aligns with the EU Green Deal.

✅ ENTSO-E grid synchronization and cross-border trade readiness

✅ Electricity market liberalization and market-based pricing

✅ EU Green Deal alignment: efficiency, hydrogen, coal regions


Ukraine's goal in the energy sector is to ensure the maximum integration of energy markets with EU markets, and in line with the EU plan to dump Russian energy that is reshaping the region, synchronization of Ukraine's integrated energy system with ENTSO-E while leaning on electricity imports as needed to maintain stability. Prime Minister Denys Shmyhal emphasized in his statement at the Fourth Ukraine Reform Conference underway through July 7-8 in Vilnius, the Republic of Lithuania.

The Head of Government presented a plan of reforms in Ukraine until 2030. In particular, energy sector reform and environmental protection, according to the PM, include the liberalization of the electricity market, with recent amendments to the market law guiding implementation, the simplification of connection to the electrical grid system and the gradual transition to market electricity prices, alongside potential EU emergency price measures under discussion, and the monetization of subsidies for vulnerable groups.

"Ukraine shares and fully supports the EU's climate ambitions and aims to synchronize its policies in line with the EU Green Deal, including awareness of Hungary's energy alignment with Russia to ensure coherent regional planning. The interdepartmental working group has determined priority areas for cooperation with the European Union: energy efficiency, hydrogen, transformation of coal regions, waste management," said the Prime Minister.

According to Denys Shmyhal, Ukraine has supported the EU's climate ambitions to move towards climate-neutral development by 2050 within the framework of the European Green Deal and should become an integral part of it in order not only to combat the effects of climate change in synergy with the EU but, as the country prepares for winter energy challenges and strengthens resilience, within the economic strategy development aimed to enhance security and create new opportunities for Ukrainian business, with continued energy security support from partners bolstering implementation.


Related News

View more

Energy-insecure households in the U.S. pay 27% more for electricity than others

Community Solar for Low-Income Homes expands energy equity by delivering renewable energy access, predictable bill savings, and tax credit benefits to renters and energy-insecure households, accelerating distributed generation and storage adoption nationwide.


Key Points

A program model enabling renters and LMI households to subscribe to off-site solar and save on utility bills.

✅ Earn bill credits from shared solar generation.

✅ Expands access for renters and LMI subscribers.

✅ Often paired with storage and IRA tax credit adders.


On a square-foot basis, the issue of inequality is made worse by higher costs for energy usage in the nation. Efforts like community solar programs such as Maryland community solar are underway to boost low-income participation in the cost benefits of renewable energy.

The Energy Information Administration (EIA) shows that households that are considered energy insecure, or those that have the inability to adequately meet basic household energy costs, are paying more for electricity than their wealthier counterparts. 

On average in the United States in 2020, households were billed about $1.04 per square foot for all energy sources. For homes that did not report energy insecurity, that average was $0.98 per square foot, while homes with energy insecurity issues paid an average of $1.24 per square foot for energy. This means that U.S. residents that need the most support on their energy bills are stuck with costs 27% higher than their neighbors on square-foot-basis.

EIA said energy-insecure households have reduced or forgone basic necessities to pay energy bills, kept their houses at unsafe temperatures because of energy cost concerns, or been unable to repair heating or cooling equipment because of cost.

In 2020, households with income less than $10,000 a year were billed an average of $1.31 per square foot for energy, while households making $100,000 or more were billed an average of $0.96 per square foot, said EIA. Renters paid considerably more ($1.28 per square foot) than owners ($0.98 per square foot). There were also considerable differences between regions, with New England solar growth sparking grid upgrade debates, ethnic groups and races, and insulation levels, as seen below.

The energy transition toward renewables like solar has offered price stability, amid record solar and storage growth nationwide, but thus far energy-insecure communities have relatively been left behind. A recent Berkeley Lab report, Residential Solar-Adopter Income and Demographic Trends, indicates that even though the rate of solar adoption among low-income residents is increasing (from 5% in 2010 to 11% in 2021), that segment of energy consumers remains under-represented among solar adopters, relative to its share of the population.


Community solar efforts

As such, the United States is targeting communities most impacted by energy costs that have not benefitted from the transition, highlighting “Energy Communities” that are eligible for an additional 10% tax credit through funds made possible by the Inflation Reduction Act.

Additionally, a push for community solar development is taking place nationwide to extend access to affordable solar energy to renters and other residents that aren’t able to leverage finances to invest in predictable, low-cost residential solar systems. The Biden Administration set a goal this year to sign up 5 million community solar households, achieving $1 billion in bill savings by 2025. The community solar model only represents about 8% of the total distributed solar capacity in the nation. This target would entail a jump from 3 GW installed capacity to 20 GW by the target year. The Department of Energy estimates community solar subscribers save an average of 20% on their bills.

California this year passed AB 2316, the Community Renewable Energy Act takes aim at four acute problems in the state’s power market: reliability amid rising outage risks, rates, climate and equity. The law creates a community renewable energy program, including community solar-plus-storage, supported by cheaper batteries, to overcome access barriers for nearly half of Californians who rent or have low incomes. Community solar typically involves customers subscribing to an off-site solar facility, receiving a utility bill credit for the power it generates.

“Community renewable energy is a proven powerful tool to help close California’s clean energy gap, bringing much needed relief to millions struggling with high housing costs and utility debt,” said Alexis Sutterman, energy equity program manager at the California Environmental Justice Alliance.

The program has energy equity baked into its structure, working to make sure Californians of all income levels participate in the benefits of the energy transition. Not only does it open solar access to renters, the law ensures that at least 51% of subscribers are low-income customers, which is expected to make projects eligible for a 10% tax credit adder under the IRA.

“The money’s on the table now,” said Jeff Cramer, president and chief executive of the Coalition for Community Solar Access. “While there are groups pushing for solar access for all, and states with strong legislation, there are other pockets of interest in surprising places in the United States. For example, Louisiana has no policy for community solar or support for low-income residents going solar but the city of New Orleans has its own utility commission with a community solar program. In Nebraska, forward-looking co-operatives have created community solar projects.

Community solar markets are active in 22 states, with more expected to come online in the future as states pursue 100% clean energy targets across the country. However, the market is expected to require strong community outreach efforts to foster trust and gain subscribers.

“There is a distrust of community solar initially in LMI communities as many have been burned before by retail energy false promises,” said Eric LaMora, executive director, community solar, Nautilus Solar on a panel at the Solar Energy Industries Association Finance, Tax, and Buyers seminar. “People are suspicious but there really are no hooks with community solar.”

LMI residents are leery to provide tax records or much documents at all in order to sign up for community solar, LaMora said. “We were surprised to see less of a default rate with LMI residents. We attribute this to the fact that they see significant savings on their electric bill, making it easier to pay each month,” he said.


Related News

View more

Sign Up for Electricity Forum’s Newsletter

Stay informed with our FREE Newsletter — get the latest news, breakthrough technologies, and expert insights, delivered straight to your inbox.

Electricity Today T&D Magazine Subscribe for FREE

Stay informed with the latest T&D policies and technologies.
  • Timely insights from industry experts
  • Practical solutions T&D engineers
  • Free access to every issue

Live Online & In-person Group Training

Advantages To Instructor-Led Training – Instructor-Led Course, Customized Training, Multiple Locations, Economical, CEU Credits, Course Discounts.

Request For Quotation

Whether you would prefer Live Online or In-Person instruction, our electrical training courses can be tailored to meet your company's specific requirements and delivered to your employees in one location or at various locations.