U.S. gives loan guarantee for largest solar plant

By Reuters


Electrical Testing & Commissioning of Power Systems

Our customized live online or in‑person group training can be delivered to your staff at your location.

  • Live Online
  • 12 hours Instructor-led
  • Group Training Available
Regular Price:
$599
Coupon Price:
$499
Reserve Your Seat Today
The U.S. Energy Department said recently it awarded a $967 million loan guarantee to an NRG Energy subsidiary to help pay for the world's biggest solar power plant using photovoltaic panels.

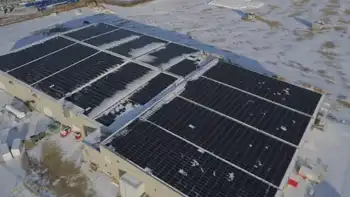
The loan guarantee will support the construction of the 290-megawatt Agua Caliente Solar generating facility in Yuma County, Arizona that will use thin solar panels.

The facility will help the Obama administration meets its goal to double the amount of U.S. electricity generated from renewable energy sources like solar and wind power.

"Solar projects like this are helping the U.S. to compete globally for the clean energy jobs of today and the future," said U.S. Energy Secretary Steven Chu.

"Together, we will create hundreds of jobs and reduce the nation's fossil fuel dependence and carbon intensity," said Tom Doyle, president of NRG Solar.

Pacific Gas & Electric Company will purchase power generated at the solar plant and deliver it to its customers in California. The plant is expected to be built by 2014.

Related News

B.C. electricity demand hits an all-time high

BC Hydro Peak Electricity Demand reached a record 10,902 megawatts during a cold snap, driven by home heating. Peak hours surged; load shifting and energy conservation can ease strain on the grid and lower bills.


Key Points

Record winter peak of 10,902 MW, set during a cold snap, largely from home heating demand at peak hours.

✅ All-time high load: 10,902 MW between 5 and 6 p.m., Dec. 27.

✅ Cold snap increased home heating demand during peak hours.

✅ Shift laundry and dishwashers off-peak; use programmable thermostats.


BC Hydro says the province set a new record for peak electricity demand on Monday as temperatures hit extreme lows, and Quebec shattered consumption records during similar cold weather.

Between 5 and 6 p.m. on Dec. 27, demand for electricity hit an all-time high of 10,902 megawatts, which is higher than the previous record of 10,577 megawatts set in 2020, and follows a record-breaking year in 2021 for the utility.

“The record represents a single moment in the hour when demand for electricity was the highest yesterday,” says Simi Heer, BC Hydro spokesperson, in a statement. “Most of the increase is likely due to additional home heating required during this cold snap.”

In addition to the peak demand record on Monday, BC Hydro has observed an overall increase in electricity demand since Friday, and has noted that cryptocurrency mining electricity use is an emerging load in the province as well. Monday’s hourly peak demand was 18 per cent higher than Friday’s, while Calgary's electricity use soared during a frigid February, underscoring how cold snaps strain regional grids.

“BC Hydro has enough supply options in place to meet increasing electricity demand,” adds Heer, and pointed to customer supports like a winter payment plan for households managing higher bills. “However, if British Columbians want to help ease some of the demand on the system during peak times, we encourage shifting activities like doing laundry or running dishwashers to earlier in the day or later in the evening.”

BC Hydro is also offering energy conservation tips for people looking to lower their electricity use and their electricity bills, noting that Earth Hour once saw electricity use rise in the province:

Manage your home heating actively by turning the heat down when no one his home or when everyone is sleeping. Consider installing a programmable thermostat to automatically adjust temperatures at different times based on your family's activities, and remember that in warmer months wasteful air conditioning can add $200 to summer energy bills. BC Hydro recommends the following temperatures:

16 degrees Celsius when sleeping or away from home
21 degrees Celsius when relaxing, watching TV
18 degrees Celsius when doing housework or cleaning


Related News

View more

Neste increases the use of wind power at its Finnish production sites to nearly 30%

Neste wind power agreement boosts renewable electricity in Finland, partnering with Ilmatar and Fortum to supply Porvoo and Naantali sites, cutting Scope 2 emissions and advancing a 2035 carbon-neutral production target via long-term PPAs.


Key Points

A PPA to source wind power for sites, cutting Scope 2 emissions and supporting Neste's 2035 carbon-neutral goal.

✅ 10-year PPA with Ilmatar; + Fortum boosts renewable electricity share.

✅ Supplies ~7% of Porvoo-Naantali electricity; capacity >20 MW.

✅ Cuts Scope 2 emissions by ~55 kt CO2e per year toward 2035 neutrality.


Neste is committed to reaching carbon neutral production by 2035, mirroring efforts such as Olympus 100% renewable electricity commitments across industry.

As part of this effort, the company is increasing the use of renewable electricity at its production sites in Finland, reflecting trends such as Ireland's green electricity targets across Europe, and has signed a wind power agreement with Ilmatar, a wind power company. The agreement has been made together with Borealis, Neste's long-term partner in the Kilpilahti area in Porvoo, Finland.

As a result of the agreement with Ilmatar, as well as that signed with Fortum at the end of 2019, and in line with global growth such as Enel's 450 MW wind project in the U.S., nearly 30% of the energy used at Neste's production sites in Porvoo and Naantali will be renewable wind power in 2022.

'Neste's purpose is to create a healthier planet for our children. Our two climate commitments play an important role in living up to this ambition, and one of them is to reach carbon neutral production by 2035. It is an enormous challenge and requires several concrete measures and investments, including innovations like offshore green hydrogen initiatives. Wind power, including advances like UK offshore wind projects, is one of the over 70 measures we have identified to reduce our production's greenhouse gas emissions,' Neste's President and CEO Peter Vanacker says.

With the ten year contract, Neste is committed to purchase about one-third of the production of Ilmatar's two wind farms, reflecting broader market moves such as BC Hydro wind deals in Canada. The total capacity of the agreement is more than 20 MW, and the energy produced will correspond to around 7% of the electricity consumption at Neste's sites in Porvoo and Naantali. The wind power deliveries are expected to begin in 2022.

The two wind power agreements help Neste to reduce the indirect greenhouse gas emissions (Scope 2 emissions defined by the Greenhouse Gas Protocol) of electricity purchases at its Finnish production sites, a trend mirrored by Dutch green electricity growth across Europe, annually by approximately 55 kilotons. 55 kt/a CO2e equals annual carbon footprint of more than 8,500 EU citizens.


Related News

View more

EIA expects solar and wind to be larger sources of U.S. electricity generation this summer

US Summer Electricity Outlook 2022 projects rising renewable energy generation as utility-scale solar and wind capacity additions surge, while coal declines and natural gas shifts amid higher fuel prices and regional supply constraints.


Key Points

An EIA forecast of summer 2022 power: more solar and wind, less coal, and shifting gas use amid higher fuel prices.

✅ Solar +10 million MWh; wind +8 million MWh vs last summer

✅ Coal generation -20 million MWh amid supply constraints, retirements

✅ Gas prices near $9/MMBtu; slight national gen decline


In our Summer Electricity Outlook, a supplement to our May 2022 Short-Term Energy Outlook, we expect the largest increases in U.S. electric power sector generation this summer will come from renewable energy sources such as wind and solar generation. These increases are the result of new capacity additions. We forecast utility-scale solar generation between June and August 2022 will grow by 10 million megawatthours (MWh) compared with the same period last summer, and wind generation will grow by 8 million MWh. Forecast generation from coal and natural gas declines by 26 million MWh this summer, although natural gas generation could increase in some electricity markets where coal supplies are constrained.

For recent context, overall U.S. power generation in January rose 9.3% year over year, the EIA reports.

Wind and solar power electric-generating capacity has been growing steadily in recent years. By the start of June, we estimate the U.S. electric power sector will have 65 gigawatts (GW) of utility-scale solar-generating capacity, a 31% increase in solar capacity since June 2021. Almost one-third of this new solar capacity will be built in the Texas electricity market. The electric power sector will also have an estimated 138 GW of wind capacity online this June, which is a 12% increase from last June.

Along with growth in renewables capacity, we expect that an additional 6 GW of new natural gas combined-cycle generating capacity will come online by June 2022, an increase of 2% from last summer. Despite this increase in capacity, we expect natural gas-fired electricity generation at the national level will be slightly (1.3%) lower than last summer.

We forecast the price of natural gas delivered to electric generators will average nearly $9 per million British thermal units between June and August 2022, which would be more than double the average price last summer. The higher expected natural gas prices and growth in renewable generation will likely lead to less natural gas-fired generation in some regions of the country.

In contrast to renewables and natural gas, the electricity industry has been steadily retiring coal-fired power plants over the past decade. Between June 2021 and June 2022, the electric power sector will have retired 6 GW (2%) of U.S. coal-fired generating capacity.

In previous years, higher natural gas prices would have resulted in more coal-fired electricity generation across the fleet. However, coal-fired power plants have been limited in their ability to replenish their historically low inventories in recent months as a result of mine closures, rail capacity constraints, and labor market tightness. These coal supply constraints, along with continued retirement of generating capacity, contribute to our forecast that U.S. coal-fired generation will decline by 20 million MWh (7%) this summer. In some regions of the country, these coal supply constraints may lead to increased natural gas-fired electricity generation despite higher natural gas prices.


Related News

View more

Told "no" 37 times, this Indigenous-owned company brought electricity to James Bay anyway

Five Nations Energy Transmission Line connects remote First Nations to the Ontario power grid, delivering clean, reliable electricity to Western James Bay through Indigenous-owned transmission infrastructure, replacing diesel generators and enabling sustainable community growth.


Key Points

An Indigenous-owned grid link providing reliable power to Western James Bay First Nations, replacing polluting diesel.

✅ Built by five First Nations; fully Indigenous-owned utility

✅ 270 km line connecting remote James Bay communities

✅ Ended diesel dependence; enabled sustainable development


For the Indigenous communities along northern Ontario’s James Bay — the ones that have lived on and taken care of the lands as long as anyone can remember — the new millenium marked the start of a diesel-less future, even as Ontario’s electricity outlook raised concerns about getting dirtier in policy debates. 

While the southern part of the province took Ontario’s power grid for granted, despite lessons from Europe’s power crisis about reliability, the vast majority of these communities had never been plugged in. Their only source of power was a handful of very loud diesel-powered generators. Because of that, daily life in the Attawapiskat, Kashechewan and Fort Albany First Nations involved deliberating a series of tradeoffs. Could you listen to the radio while toasting a piece of bread? How many Christmas lights could you connect before nothing else was usable? Was there enough power to open a new school? 

The communities wanted a safe, reliable, clean alternative, with Manitoba’s clean energy illustrating regional potential, too. So did their chiefs, which is why they passed a resolution in 1996 to connect the area to Ontario’s grid, not just for basic necessities but to facilitate growth and development, and improve their communities’ quality of life. 

The idea was unthinkable at the time — scorned and dismissed by those who held the keys to Ontario’s (electrical) power, much like independent power projects can be in other jurisdictions. Even some in the community didn’t fully understand it. When the idea was first proposed at a gathering of Nishnawbe Aski Nation, which represents 49 First Nations, one attendee said the only way he could picture the connection was as “a little extension cord running through the bush from Moosonee.” 

But the leadership of Attawapiskat, Kashechewan and Fort Albany First Nations had been dreaming and planning. In 1997, along with members of Taykwa Tagamou and Moose Cree First Nations, they created the first, and thus far only, fully Indigenous-owned energy company in Canada: Five Nations Energy Inc., as partnerships like an OPG First Nation hydro project would later show in action, too. 

Over the next five years, the organization built Omushkego Ishkotayo, the Cree name for the Western James Bay transmission line: “Omushkego” refers to the Swampy Cree people, and “Ishkotayo” to hydroelectric power, while other regions were commissioning new BC generating stations in parallel. The 270-kilometre-long transmission line is in one of the most isolated regions of Ontario, one that can only be accessed by plane, except for a few months in winter when ice roads are strong enough to drive on. The project went online in 2001, bringing reliable power to over 7,000 people who were previously underserved by the province’s energy providers. It also, somewhat controversially, enabled Ontario’s first diamond mine in Attawapiskat territory.

The future the First Nations created 25 years ago is blissfully quiet, now that the diesel generators are shut off. “When the power went on, you could hear the birds,” Patrick Chilton, the CEO of Five Nations Energy, said with a smile. “Our communities were glowing.”

Power, politics and money: Five Nations Energy needed government, banks and builders on board
Chilton took over in 2013 after the former CEO, his brother Ed, passed away. “This was all his idea,” Chilton told The Narwhal in a conversation over Zoom from his office in Timmins, Ont. The company’s story has never been told before in full, he said, because he felt “vulnerable” to the forces that fought against Omushkego Ishkotayo or didn’t understand it, a dynamic underscored by Canada’s looming power problem reporting in recent years. 

The success of Five Nations Energy is a tale of unwavering determination and imagination, Chilton said, and it started with his older brother. “Ed was the first person who believed a transmission line was possible,” he said.

In a Timmins Daily Press death notice published July 2, 2013, Ed Chilton is described as having “a quiet but profound impact on the establishment of agreements and enterprises benefitting First Nations peoples and their lands.” Chilton doesn’t describe him that way, exactly. 

“If you knew my brother, he was very stubborn,” he said. A certified engineering technologist, Ed was a visionary whose whole life was defined by the transmission line. He was the first to approach the chiefs with the idea, the first to reach out to energy companies and government officials and the one who persuaded thousands of people in remote, underserved communities that it was possible to bring power to their region.

After that 1996 meeting of Nishnawbe Aski Nation, there came a four-year-long effort to convince the rest of Ontario, and the country, the project was possible and financially viable. The chiefs of the five First Nations took their idea to the halls of power: Queen’s Park, Parliament Hill and the provincial power distributor Hydro One (then Ontario Hydro). 

“All of them said no,” Chilton said. “They saw it as near to impossible — the idea that you could build a transmission line in the ‘swamp,’ as they called it.” The Five Nations Energy team kept a document at the time tracking how many times they heard no; it topped out at 37. 

One of the worst times was in 1998, at a meeting on the 19th floor of the Ontario Hydro building in the heart of downtown Toronto. There, despite all their preparation and planning, a senior member of the Ontario Hydro team told Chilton, Martin and other chiefs “you’ll build that line over my dead body,” Chilton recalled. 

At the time, Chilton said, Ontario Hydro was refusing to cooperate: unwilling to let go of its monopoly over transmission lines, but also saying it was unable to connect new houses in the First Nations to diesel generators it said were at maximum capacity. (Ontario Hydro no longer exists; Hydro One declined to comment.)

“There’s always naysayers no matter what you’re doing,” Martin said. “What we were doing had never been done before. So of course people were telling us how we had never managed something of this size or a budget of this size.” 

“[Our people] basically told them to blow it up your ass. We can do it,” Chilton said.

So the chiefs of the five nations did something they’d never done before: they went to all of the big banks and many, many charitable foundations trying to get the money, a big ask for a project of this scale, in this location. Without outside support, their pitch was that they’d build it themselves.

This was the hardest part of the process, said Lawrence Martin, the former Grand Chief of Mushkegowuk Tribal Council and a member of the Five Nations Energy board. “We didn’t know how to finance something like this, to get loans,” he told The Narwhal. “That was the toughest task for all of us to achieve.”

Eventually, they got nearly $50 million in funding from a series of financial organizations including the Bank of Montreal, Pacific and Western Capital, the Northern Ontario Heritage Fund Corporation (an Ontario government agency) and the engineering and construction company SNC Lavalin, which did an assessment of the area and deemed the project viable. 

And in 1999, Ed Chilton, other members of the Chilton family and the chiefs were able to secure an agreement with Ontario Hydro that would allow them to buy electricity from the province and sell it to their communities. 


Related News

View more

India is now the world’s third-largest electricity producer

India Electricity Production 2017 surged to 1,160 BU, ranking third globally; rising TWh output with 334 GW capacity, strong renewables and thermal mix, 7% CAGR in generation, and growing demand, investments, and FDI inflows.


Key Points

India's 2017 power output reached 1,160 BU, third globally, supported by 334 GW capacity, rising renewables, and 7% CAGR.

✅ 1,160 BU generated; third after China and the US

✅ Installed capacity 334 GW; 65% thermal, rising renewables

✅ Generation CAGR ~7%; demand, FDI, investments rising


India now generates around 1,160.1 billion units of electricity in financial year 2017, up 4.72% from the previous year, and amid surging global electricity demand that is straining power systems. The country is behind only China which produced 6,015 terrawatt hours (TWh. 1 TW = 1,000,000 megawatts) and the US (4,327 TWh), and is ahead of Russia, Japan, Germany, and Canada.


India’s electricity production grew 34% over seven years to 2017, and the country now produces more energy than Japan and Russia, which had 27% and 8.77% more electricity generation capacity installed, respectively, than India seven years ago.

India produced 1,160.10 billion units (BU) of electricity–one BU is enough to power 10 million households (one household using average of about 3 units per day) for a month–in financial year (FY) 2017. Electricity production stood at 1,003.525 BU between April 2017-January 2018, according to a February 2018 report by India Brand Equity Foundation (IBEF), a trust established by the commerce ministry.

#google#

With a production of 1,423 BU in FY 2016, India was the third largest producer and the third largest consumer of electricity in the world, behind China (6,015 BU) and the United States (4,327 BU).

With an annual growth rate of 22.6% capacity addition over a decade to FY 2017, renewables beat other power sources–thermal, hydro and nuclear. Renewables, however, made up only 18.79% of India’s energy, up 68.65% since 2007, and globally, low-emissions sources are expected to cover most demand growth in the coming years. About 65% of installed capacity continues to be thermal.

As of January 2018, India has installed power capacity of 334.4 gigawatt (GW), making it the fifth largest installed capacity in the world after European Union, China, United States and Japan, and with much of the fleet coal-based, imported coal volumes have risen at times amid domestic supply constraints.

The government is targeting capacity addition of around 100 GW–the current power production of United Kingdom–by 2022, as per the IBEF report.


Electricity generation grew at 7% annually

India achieved a 34.48% growth in electricity production by producing 1,160.10 BU in 2017 compared to 771.60 BU in 2010–meaning that in these seven years, electricity production in India grew at a compound annual growth rate (CAGR) of 7.03%, while thermal power plants' PLF has risen recently amid higher demand and lower hydro.


Generation capacity grew at 10% annually

Of 334.5 GW installed capacity as of January 2018–up 60% from 132.30 GW in 2007–thermal installed capacity was 219.81 GW. Hydro and renewable energy installed capacity totaled 44.96 GW and 62.85 GW, respectively, said the report.

The CAGR in installed capacity over a decade to 2017 was 10.57% for thermal power, 22.06% for renewable energy–the fastest among all sources of power–2.51% for hydro power and 5.68% for nuclear power.


Growing demand, higher investments will drive future growth

Growing population and increasing penetration of electricity connections, along with increasing per-capita usage would provide further impetus to the power sector, said the report.

Power consumption is estimated to increase from 1,160.1 BU in 2016 to 1,894.7 BU in 2022, as per the report, though electricity demand fell sharply in one recent period.

Increasing investment remained one of the driving factors of power sector growth in the country.

Power sector has a 100% foreign direct investment (FDI) permit, which boosted FDI inflows in the sector.

Total FDI inflows in the power sector reached $12.97 billion (Rs 83,713 crore) during April 2000 to December 2017, accounting for 3.52% of FDI inflows in India, the report said.


Related News

View more

Hurricane Michael by the numbers: 32 dead, 1.6 million homes, businesses without power

Hurricane Michael Statistics track catastrophic wind speed, storm surge, rainfall totals, power outages, evacuations, and fatalities across Florida and the Southeast, detailing Category 4 intensity, Saffir-Simpson scale impacts, and emergency response resources.


Key Points

Hurricane Michael statistics detail wind speed, storm surge, rainfall, outages, and deaths from Category 4 landfall.

✅ 155 mph landfall winds; 14 ft storm surge; 12 in rainfall max

✅ 1.6M without power; 30,000 restoring crews; 6 states emergency

✅ 325k ordered evacuations; 32 deaths; FEMA and Guard deployed


Hurricane Michael, a historic Category 4 storm, struck the Florida Panhandle early Wednesday afternoon, unleashing heavy rain, high winds and a devastating storm surge.


Here is a look at the dangerous storm by the numbers:

155 mph: Wind speed -- nearly the highest possible for a Category 4 hurricane -- with which Michael made landfall near Mexico Beach and Panama City. A hurricane with 157 mph or higher is a Category 5, the strongest on the Saffir-Simpson hurricane wind scale.

129 mph: Peak wind gust reported Wednesday at Tyndall Air Force Base, which is about 12 miles southeast of Panama City, Florida.

32: Number of storm-related deaths attributed to Michael thus far, including an 11-year-old girl who local officials say was killed when part of a metal carport crashed into her family's mobile home in Lake Seminole, Georgia, and a 38-year-old man who was killed when a tree fell onto his moving car in Statesville, North Carolina.


Waves take over a house as Hurricane Michael comes ashore in Alligator Point, Fla., Oct. 10, 2018.

14 feet: Maximum height forecast for the storm surge when Michael's strong winds pushed the ocean water onto land. A storm surge just over 9 feet was reported Wednesday in Apalachicola, Florida.

12 inches: Isolated maximum amount of rain that Michael was expected to dump across the Florida Panhandle and the state's Big Bend region, as well as in southeast Alabama and parts of southwest and central Georgia.

9 inches: Maximum amount of rain that Michael could bring to isolated areas from Virginia to North Carolina.

1.6 million: Number of homes and businesses without power in Florida, Alabama, Georgia, South Carolina, North Carolina and Virginia as of Friday morning, a reminder that extended outages can persist after major disasters.

30,000: Number of workers mobilized from across the country to help restore power, underscoring the risks of field repairs such as line crew injuries during recovery.

6: Number of states that had emergency declarations in anticipation of Michael: Florida, Alabama, Georgia, South Carolina, North Carolina and Virginia.

325,000: Estimated number of people in the storm's path who were told to evacuate by local authorities.

6,000: Approximate number of people who stayed in the roughly 80 shelters across Florida, Alabama, Georgia, South Carolina and North Carolina on Wednesday night, while those sheltering at home were urged to avoid overheated power strips that can spark fires.

3,000: Number of personnel the Federal Emergency Management Agency deployed ahead of landfall, while utilities prepared on-site staffing plans to maintain operations during widespread disruptions.

35: Number of counties in Florida, of the state's 67, where Gov. Rick Scott declared a state of emergency prior to landfall, and grid reliability warnings often underscore systemic risks during national emergencies.

3,500: Number of Florida National Guard troops activated for pre-landfall coordination and planning, with an emphasis on high water and search-and-rescue operations.

600: Number of Florida state troopers assigned to the Panhandle and Big Bend region to assist with response and recovery efforts, including public reminders about downed line safety in affected communities.

500: Number of disaster relief workers that the American Red Cross was sending to affected areas in the Sunshine State.

200: Approximate number of patients being evacuated from at least two hospitals in Florida due to damage from the hurricane, highlighting how critical facilities depend on staff who have raised workforce safety concerns during other crises. Bay Medical Center Sacred Heart in Panama City said in a statement Thursday that its facility was damaged during the storm and thus is transferring more than 200 patients, including 39 who are critically ill, to regional hospitals. Gulf Coast Regional Medical Center, also in Panama City, announced in a statement Thursday that it's evacuating its roughly approximately patients, starting with the most critically ill, "because of the infrastructure challenges in our community."


Related News

View more

Sign Up for Electricity Forum’s Newsletter

Stay informed with our FREE Newsletter — get the latest news, breakthrough technologies, and expert insights, delivered straight to your inbox.

Electricity Today T&D Magazine Subscribe for FREE

Stay informed with the latest T&D policies and technologies.
  • Timely insights from industry experts
  • Practical solutions T&D engineers
  • Free access to every issue

Download the 2025 Electrical Training Catalog

Explore 50+ live, expert-led electrical training courses –

  • Interactive
  • Flexible
  • CEU-cerified