Belarus and Russia to sign nuclear agreement

By Industrial Info Resources


NFPA 70e Training

Our customized live online or in‑person group training can be delivered to your staff at your location.

  • Live Online
  • 6 hours Instructor-led
  • Group Training Available
Regular Price:
$199
Coupon Price:
$149
Reserve Your Seat Today
An agreement to build the first nuclear power plant in Belarus is expected to be signed in the first quarter of this year, despite a number of previous false starts.

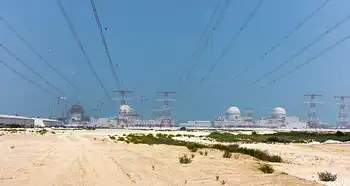
The prime minister of Belarus, Mikhail Myasnikovich, made the announcement after a series of wide-ranging talks with Russian Prime Minister Vladimir Putin in Moscow. The plant, which is a source of huge controversy with neighbouring countries, is expected to use two third-generation pressurized water reactors, the VVER-1200, from Russian energy giant AtomStroyExport.

The plant will have an expected generation capacity of 2,400 megawatts MW and will be capable of supplying 28 of Belarus' electricity. The proposed location for the plant is in Ostrovets, near the Lithuanian border, and only 50 kilometres from Lithuania's capital, Vilnius. The location is a source of increased tension between the countries. The fact that the new reactor designs have not been tested under real-world conditions has also served to increase opposition to the plant from local countries and at a European level.

"The basic agreement will be signed in the first quarter of this year," said Myasnikovich, following the talks, adding that Belarusian companies would play a key role in the plant's construction. "There is full understanding that the Belarusians, using those skills that are available to us, will be actively involved in the implementation of this project," he added. "This [project] is certainly an energy matter and, to an extent, a national security matter for us. This project remains of immediate interest, and is one of the main projects for the coming years. I see good prospects here."

"We understand that it is a very important project for Belarus," said Prime Minister Putin. "It increases the energy independence of the republic. The Russian side is ready [to help Belarus] realize this project. The project is big, nearly $6 billion, and we are ready to solve the issue of a loan."

Belarus is almost completely dependent on Russia for its energy needs, importing most of its gas and oil. Over the years, there have been numerous energy disputes, including Russia's cutting off gas supplies to the country last June and, earlier this month, stopping crude oil exports for a short period.

Related News

Wind has become the ‘most-used’ source of renewable electricity generation in the US

U.S. Wind Generation surpassed hydroelectric output in 2019, EIA data shows, becoming the top renewable electricity source, driven by PTC incentives, expanded capacity, and utility-scale projects across states, boosting the national electricity mix.


Key Points

U.S. Wind Generation is the nation's top renewable, surpassing hydro as EIA-tracked capacity grows under PTC incentives.

✅ EIA: wind topped hydro in 2019, over 300M MWh generated

✅ PTC credits spurred growth in utility-scale wind projects

✅ 103 GW installed; 77% added in the last decade


Last year saw wind power surging in the U.S. to overtake hydroelectric generation for the first time, according to data from the U.S. Energy Information Administration (EIA).

Released Wednesday, the figures from the EIA’s “Electric Power Monthly” report show that yearly wind generation hit a little over 300 million megawatt hours (MWh) in 2019. This was roughly 26 million MWh more than hydroelectric production.

Wind now represents the “most-used renewable electricity generation source” in the U.S., the EIA said, and renewables hit a 28% monthly record in April in later data.

Overall, total renewable electricity generation — which includes sources such as solar's 4.7% share in 2022 as one example, geothermal and landfill gas — at utility scale facilities hit more than 720 million MWh in 2019, compared to just under 707 million MWh in 2018. To put things in perspective, generation from coal came to more than 966 million MWh in 2019, while renewables surpassed coal in 2022 nationally according to later analyses.

According to the EIA’s “Today in Energy” briefing, which was also published Wednesday, generation from wind power has grown “steadily” across the last decade, and by 2020, renewables became the second-most prevalent source in the U.S. power mix.

This, it added, was partly down to the extension of the Production Tax Credit, or PTC, amid favorable government plans supporting solar and wind growth. According to the EIA, the PTC is a system which gives operators a tax credit per kilowatt hour of renewable electricity production. It applies for the first 10 years of a facility’s operation.

At the end of 2019, the country was home to 103 gigawatts (GW) of wind capacity, with 77% of this being installed in the last decade, and wind capacity surpassed hydro in 2016 according to industry data. The U.S. is home 80 GW of hydroelectric capacity, according to the EIA.

“The past decade saw a steady increase in wind capacity across the country and we capped the decade with a monumental achievement for the industry in reaching more than 100 GW,” Tom Kiernan, the American Wind Energy Association’s CEO, said in a statement issued Thursday.

“And more wind energy is coming, as the industry is well into investing $62 billion in new projects over the next few years that put us on the path to achieving 20 percent of the nation’s electricity mix in 2030,” Kiernan went on to state.

“As a result, wind is positioned to remain the largest renewable energy generator in the country for the foreseeable future.”


Related News

View more

Purdue: As Ransomware Attacks Increase, New Algorithm May Help Prevent Power Blackouts

Infrastructure Security Algorithm prioritizes cyber defense for power grids and critical infrastructure, mitigating ransomware, blackout risks, and cascading failures by guiding utilities, regulators, and cyber insurers on optimal security investment allocation.


Key Points

An algorithm that optimizes security spending to cut ransomware and blackout risks across critical infrastructure.

✅ Guides utilities on optimal security allocation

✅ Uses incentives to correct human risk biases

✅ Prioritizes assets to prevent cascading outages


Millions of people could suddenly lose electricity if a ransomware attack just slightly tweaked energy flow onto the U.S. power grid, as past US utility intrusions have shown.

No single power utility company has enough resources to protect the entire grid, but maybe all 3,000 of the grid's utilities could fill in the most crucial security gaps if there were a map showing where to prioritize their security investments.

Purdue University researchers have developed an algorithm to create that map. Using this tool, regulatory authorities or cyber insurance companies could establish a framework for protecting the U.S. power grid that guides the security investments of power utility companies to parts of the grid at greatest risk of causing a blackout if hacked.

Power grids are a type of critical infrastructure, which is any network - whether physical like water systems or virtual like health care record keeping - considered essential to a country's function and safety. The biggest ransomware attacks in history have happened in the past year, affecting most sectors of critical infrastructure in the U.S. such as grain distribution systems in the food and agriculture sector and the Colonial Pipeline, which carries fuel throughout the East Coast, prompting increased military preparation for grid hacks in the U.S.

With this trend in mind, Purdue researchers evaluated the algorithm in the context of various types of critical infrastructure in addition to the power sector, including electricity-sector IoT devices that interface with grid operations. The goal is that the algorithm would help secure any large and complex infrastructure system against cyberattacks.

"Multiple companies own different parts of infrastructure. When ransomware hits, it affects lots of different pieces of technology owned by different providers, so that's what makes ransomware a problem at the state, national and even global level," said Saurabh Bagchi, a professor in the Elmore Family School of Electrical and Computer Engineering and Center for Education and Research in Information Assurance and Security at Purdue. "When you are investing security money on large-scale infrastructures, bad investment decisions can mean your power grid goes out, or your telecommunications network goes out for a few days."

Protecting infrastructure from hacks by improving security investment decisions

The researchers tested the algorithm in simulations of previously reported hacks to four infrastructure systems: a smart grid, industrial control system, e-commerce platform and web-based telecommunications network. They found that use of this algorithm results in the most optimal allocation of security investments for reducing the impact of a cyberattack.

The team's findings appear in a paper presented at this year's IEEE Symposium on Security and Privacy, the premier conference in the area of computer security. The team comprises Purdue professors Shreyas Sundaram and Timothy Cason and former PhD students Mustafa Abdallah and Daniel Woods.

"No one has an infinite security budget. You must decide how much to invest in each of your assets so that you gain a bump in the security of the overall system," Bagchi said.

The power grid, for example, is so interconnected that the security decisions of one power utility company can greatly impact the operations of other electrical plants. If the computers controlling one area's generators don't have adequate security protection, as seen when Russian hackers accessed control rooms at U.S. utilities, then a hack to those computers would disrupt energy flow to another area's generators, forcing them to shut down.

Since not all of the grid's utilities have the same security budget, it can be hard to ensure that critical points of entry to the grid's controls get the most investment in security protection.

The algorithm that Purdue researchers developed would incentivize each security decision maker to allocate security investments in a way that limits the cumulative damage a ransomware attack could cause. An attack on a single generator, for instance, would have less impact than an attack on the controls for a network of generators, which sophisticated grid-disruption malware can target at scale, rather than for the protection of a single generator.

Building an algorithm that considers the effects of human behavior

Bagchi's research shows how to increase cybersecurity in ways that address the interconnected nature of critical infrastructure but don't require an overhaul of the entire infrastructure system to be implemented.

As director of Purdue's Center for Resilient Infrastructures, Systems, and Processes, Bagchi has worked with the U.S. Department of Defense, Northrop Grumman Corp., Intel Corp., Adobe Inc., Google LLC and IBM Corp. on adopting solutions from his research. Bagchi's work has revealed the advantages of establishing an automatic response to attacks, and analyses like Symantec's Dragonfly report highlight energy-sector risks, leading to key innovations against ransomware threats, such as more effective ways to make decisions about backing up data.

There's a compelling reason why incentivizing good security decisions would work, Bagchi said. He and his team designed the algorithm based on findings from the field of behavioral economics, which studies how people make decisions with money.

"Before our work, not much computer security research had been done on how behaviors and biases affect the best defense mechanisms in a system. That's partly because humans are terrible at evaluating risk and an algorithm doesn't have any human biases," Bagchi said. "But for any system of reasonable complexity, decisions about security investments are almost always made with humans in the loop. For our algorithm, we explicitly consider the fact that different participants in an infrastructure system have different biases."

To develop the algorithm, Bagchi's team started by playing a game. They ran a series of experiments analyzing how groups of students chose to protect fake assets with fake investments. As in past studies in behavioral economics, they found that most study participants guessed poorly which assets were the most valuable and should be protected from security attacks. Most study participants also tended to spread out their investments instead of allocating them to one asset even when they were told which asset is the most vulnerable to an attack.

Using these findings, the researchers designed an algorithm that could work two ways: Either security decision makers pay a tax or fine when they make decisions that are less than optimal for the overall security of the system, or security decision makers receive a payment for investing in the most optimal manner.

"Right now, fines are levied as a reactive measure if there is a security incident. Fines or taxes don't have any relationship to the security investments or data of the different operators in critical infrastructure," Bagchi said.

In the researchers' simulations of real-world infrastructure systems, the algorithm successfully minimized the likelihood of losing assets to an attack that would decrease the overall security of the infrastructure system.

Bagchi's research group is working to make the algorithm more scalable and able to adapt to an attacker who may make multiple attempts to hack into a system. The researchers' work on the algorithm is funded by the National Science Foundation, the Wabash Heartland Innovation Network and the Army Research Lab.

Cybersecurity is an area of focus through Purdue's Next Moves, a set of initiatives that works to address some of the greatest technology challenges facing the U.S. Purdue's cybersecurity experts offer insights and assistance to improve the protection of power plants, electrical grids and other critical infrastructure.


Related News

View more

Solar PV and wind power in the US continue to grow amid favourable government plans

US Renewable Power Outlook 2030 projects surging capacity, solar PV and wind growth, grid modernization, and favorable tax credits, detailing market trends, CAGR, transmission expansion, and policy drivers shaping clean energy generation and consumption.


Key Points

A forecast of US power capacity, generation, and consumption, highlighting solar, wind, tax credits, and grid modernization.

✅ Targets 48.4% renewable capacity share by 2030

✅ Strong growth in solar PV and onshore wind installations

✅ Investment and tax credits drive grid and transmission upgrades


GlobalData’s latest report, ‘United States Power Market Outlook to 2030, Update 2021 – Market Trends, Regulations, and Competitive Landscape’ discusses the power market structure of the United States and provides historical and forecast numbers for capacity, generation and consumption up to 2030. Detailed analysis of the country’s power market regulatory structure, competitive landscape and a list of major power plants are provided. The report also gives a snapshot of the power sector in the country on broad parameters of macroeconomics, supply security, generation infrastructure, transmission and distribution infrastructure, about a quarter of U.S. electricity from renewables in recent years, electricity import and export scenario, degree of competition, regulatory scenario, and future potential. An analysis of the deals in the country’s power sector is also included in the report.

Renewable power held a 19% share of the US’s total power capacity in 2020, and in that year renewables became the second-most prevalent source in the U.S. electricity mix by generation; this share is expected to increase significantly to 48.4% by 2030. Favourable policies introduced by the US Government will continue to drive the country’s renewable sector, particularly solar photovoltaics (PV) and wind power, with wind now the most-used renewable source in the U.S. generation mix. Installed renewable capacity* increased from 16.5GW in 2000 to 239.2GW in 2020, growing at a compound annual growth rate (CAGR) of 14.3%. By 2030, the cumulative renewable capacity is expected to rise to 884.6GW, growing at a CAGR of 14% from 2020 to 2030. Despite increase in prices of renewable equipment, such as solar modules, in 2021, the US renewable sector will show strong growth during the 2021 to 2030 period as this increase in equipment prices are short term due to supply chain disruptions caused by the Covid-19 pandemic.

The expansion of renewable power capacity during the 2000 to 2020 period has been possible due to the introduction of federal schemes, such as Production Tax Credits, Investment Tax Credits and Manufacturing Tax Credits. These have massively aided renewable installations by bringing down the cost of renewable power generation and making it at par with power generated from conventional sources. Over the last few years, the cost of solar PV and wind power installations has declined sharply, and by 2023 wind, solar, and batteries made up most of the utility-scale pipeline across the US, highlighting investor confidence. Since 2010, the cost of utility-scale solar PV projects decreased by around 82% while onshore wind installations decreased by around 39%. This has supported the rapid expansion of the renewable market. However, the price of solar equipment has risen due to an increase in raw material prices and supply shortages. This may slightly delay the financing of some solar projects that are already in the pipeline.

The US will continue to add significant renewable capacity additions during the forecast period as industry outlooks point to record solar and storage installations over the coming years, to meet its target of reaching 80% clean energy by 2030. In November 2021, President Biden signed a $1tr Infrastructure Bill, within which $73bn is designated to renewables. This includes not just renewable capacity building, but also strengthening the country’s power grid and laying new high voltage transmission lines, both of which will be key to driving solar and wind power capacity additions as wind power surges in the U.S. electricity mix nationwide.

The US was one of the worst hit countries in the world due to the Covid-19 pandemic in 2020. With respect to the power sector, the electricity consumption in the country declined by 2.5% in 2020 as compared to 2019, even as renewable electricity surpassed coal in 2022 in the generation mix, highlighting continued structural change. Power plants that were under construction faced delays due to unavailability of components due to supply chain disruptions and unavailability of labour due to travel restrictions.

According to the US Energy Information Administration, 61 power projects, having a total capacity of 2.4GWm which were under construction during March and April 2020 were delayed because of the Covid-19 pandemic. Among renewable power technologies, solar PV and wind power projects were the most badly affected due to the pandemic.

In March and April 2020, 53 solar PV projects, having a total capacity of 1.3GW, and wind power projects, having a total capacity of 1.2GW, were delayed due to the Covid-19 pandemic. Moreover, several states suspended renewable energy auctions due to the pandemic.

For instance, New York State Energy Research and Development Authority (NYSERDA) had issued a new offshore wind solicitation for 1GW and up to 2.5GW in April 2020, but this was suspended due to the Covid-19 pandemic. In July 2020, the authority relaunched the tender for 2.5GW of offshore wind capacity, with a submission deadline in October 2020.

To ease the financial burden on consumers during the pandemic, more than 1,000 utilities in the country announced disconnection moratoria and implemented flexible payment plans. Duke Energy, American Electric Power, Dominion Power and Southern California Edison were among the major utilities that voluntarily suspended disconnections.


Related News

View more

In a record year for clean energy purchases, Southeast cities stand out

Municipal Renewable Energy Procurement surged as cities contracted 3.7 GW of solar and wind, leveraging green tariffs, community solar, and utility partnerships across the Southeast, led by Houston, RMI, and WRI data.


Key Points

The process by which cities contract solar and wind via utilities or green tariffs to meet climate goals.

✅ 3.7 GW procured in 2020, nearly 25% year-over-year growth

✅ Houston runs city ops on 500 MW solar, a record purchase

✅ Southeast cities use green tariffs and community solar


Cities around the country bought more renewable energy last year than ever before, reflecting how renewables may soon provide one-fourth of U.S. electricity across the grid, with some of the most remarkable projects in the Southeast, according to new data unveiled Thursday.

Even amid the pandemic, about eight dozen municipalities contracted to buy nearly 3.7 gigawatts of mostly solar and wind energy — enough to power more than 800,000 homes. The figure is almost a quarter higher than the year before.

Half of the cites listed as “most noteworthy” in Thursday’s release —  from research groups Rocky Mountain Institute and World Resources Institute — are in the region that stretches from Texas to Washington, D.C. 

Houston stands out for the sheer enormity of its purchase: In July, it began powering city operations entirely from nearly 500 megawatts of solar power — the largest municipal purchase of renewable energy ever in the United States, as renewable electricity surpassed coal nationwide.

The groups also feature smaller deals in North Carolina and Tennessee, achieved through a utility partnership called a green tariff.

“We wanted to recognize that Nashville and Charlotte were really blazing a new trail,” said Stephen Abbott, principal at the Rocky Mountain Institute.

And the nation’s capital shows how renewable energy can be a source of revenue: It’s leasing out its public transit station rooftops for 10 megawatts of community solar.

All of these strategies will be necessary for scores of U.S. cities to meet their ambitious climate goals, researchers believe. An interactive clean energy targets tracker shows all 95 clean energy procurements from the year in detail.


Tracker 
Even before former President Donald Trump promised to remove the United States from the Paris Climate Accord, a lack of federal action on climate left a void that some cities and counties were beginning to fill, as renewables hit a record 28% in a recent month. In 2015, the first year tracked by researchers at the Rocky Mountain Institute and the World Resources Institute, municipalities contracted to buy more than 1 gigawatt of wind, solar and other forms of clean energy. 

But when Trump officially set in motion the withdrawal from the climate agreement, the ranks of municipalities dedicated to 100% clean energy multiplied. Today there are nearly 200 of them. The growth in activity last year reflects, in part, that surge of new pledges.

“It takes a while to get city staff up to speed and understand the options, and create the roadmap and then start executing,” Abbott said. “There is a bit of a lag, but we’re starting to see the impact.”

Even in Houston — one of the earliest to begin procuring renewable energy — there has been a steep learning curve as market forces change and prices drop, including cheaper solar batteries shaping procurement strategies, said Lara Cottingham, Houston’s chief of staff and chief sustainability officer.

No matter how well resourced and educated their staff, cities have to clear a thicket of structural, political and economic challenges to procure renewable energy. Most don’t own their own sources of power. Nearly all face budget constraints. Few have enough land or government rooftops to meet their goals within city limits.

“Cities face a situation where it’s a square peg in a round hole,” Cottingham said.

The hurdles are especially steep in much of the Southeast, where only publicly regulated utilities can sell electricity to retail customers, even large ones such as major cities. That’s where a green tariff regime comes in: Cities can purchase clean energy from a third party, such as a solar company, using the utility as a go-between.

Early last year, Charlotte became the largest city to use such a program, partnering with Duke Energy and two North Carolina solar developers to build a solar farm 50 miles north in Iredell County. At first, the city will pay a premium for the energy, but in the latter half of the 20-year contract, as gas prices rise, it will save money compared to business as usual.

“Over the course of 20 years, it’s projected we would save about $2 million,” Katie Riddle, sustainability analyst with Charlotte, told the Energy News Network last year.

The growing size of projects, innovative partnerships like green tariff programs, and the improving economics all give Abbott hope that renewable energy investments from cities will only grow — even with the Trump presidency over and the country back in the Paris agreement.

And when cities meet their goals for procuring renewable energy for their own operations, they must then turn to an even bigger task: reducing the carbon footprint of every person in their jurisdiction with broader decarbonization strategies and community engagement.

“The city needs to do its part for sure,” said Houston’s Cottingham. “Then we have this challenge of how do we get everyone else to.”


Related News

View more

Nuclear helps Belgium increase electricity exports in 2019

Belgium Energy Mix 2019 shows strong nuclear output, rising offshore wind, net electricity exports, and robust interconnections, per Elia, as the nuclear phaseout drives 3.9GW new capacity needs after improved reactor availability.


Key Points

High nuclear share, offshore wind, net exports, interconnections; 3.9GW capacity needed amid nuclear phaseout.

✅ Nuclear supplied 48.8% of generation in 2019.

✅ Net exporter: 1.8 TWh, aided by interconnections.

✅ Elia projects 3.9GW new capacity for phaseout.


Belgium's electricity transmission system operator, Elia, said that the major trends in 2019 were a steady increase in (mainly offshore) renewable power generation, illustrated by EU wind and solar records across the bloc, better availability of nuclear-generating facilities and an increase in electricity exports.

In 2019, 48.8% of the power generated in Belgium came from nuclear plants. This was in line with the total for 2017 (50%) and significantly more than in 2018 (31.2%) when several reactors were unavailable amid stunted hydro and nuclear output in Europe as well.

Belgium exported more electricity in 2019, as neighbors like Germany saw renewables overtake coal and nuclear generation, with net exports of 1.8TWh (2.1% of the energy mix), in contrast to 2018 when Belgium imported 17.5TWh (20%).

Elia said this “should be viewed in its wider context, of declining nuclear capacity in Europe and regional market shifts, against the backdrop of an increasingly Europeanised market, and can be explained primarily by the good availability of Belgium's generating facilities (especially its nuclear power stations).”

The development of interconnections was also a key factor in the circulation of these electricity flows, as seen with Irish grid price spikes highlighting regional stress, Elia noted.

“Belgium had not been a net exporter of electricity for almost 10 years, the last time being in 2009 and 2010, when total net exports represented 2.8% and 0.2% respectively of Belgium’s energy mix,” it said.

Belgian has seven nuclear reactors – three at Tihange near Liege and four at Doel near Antwerp – and, regionally, nuclear-powered France faces outage risks that influence cross-border reliability.

In 2003, Belgium decided to phase out nuclear power and passed a law to that effect, with neighbors like Germany navigating a balancing act during their energy transition, which was reaffirmed in 2015 and 2018.

A commission appointed to assess the impact of the nuclear phaseout is scheduled to be completed in 2025 but has yet to report any findings.

Elia estimates that some 3.9GW of new power generating capacity will be needed to compensate for Belgium's nuclear phaseout.


Related News

View more

Electricity bills on the rise in Calgary after

Calgary Electricity Price Increase signals higher ENMAX bills as grid demand surges; wholesale market volatility, fixed vs floating rates, kWh costs, and transmission charges drive above-average pricing across Alberta this winter.


Key Points

A market-led rise in Calgary power rates as grid demand and wholesale volatility affect fixed and floating plans.

✅ ENMAX warns of higher winter prices amid record grid demand

✅ Fixed rates hedge wholesale volatility; floating tracks spot market

✅ Transmission and distribution fees rise 5-10 percent annually


Calgarians should expect to be charged more for their electricity bills amid significant demand on the grid and a transition to above-average rates across Alberta.

ENMAX, one of the most-used electricity providers in the city, has sent an email to customers notifying them of higher prices for the rest of the winter months.

“Although fluctuations in electricity market prices are normal, we have seen a general trend of increasing rates over time,” the email to customers read.

“The price volatility we are forecasting is due to market factors beyond a single energy provider, including but not limited to expectations for a colder-than-normal winter and changes in electricity supply and demand in Alberta’s wholesale market. ”

Earlier this month, the province set a record for electricity usage during a bitterly cold stretch of weather.

According to energy comparison website energyrates.ca, Alberta’s energy prices have increased by 34 per cent between November 2020 and 2021.

“One of the reasons that this increase seems so significant is we’re actually coming off of a low period in the market,” the site’s founder Joel MacDonald told Global News. “You’re seeing rates well below average transitioning to well above average.”

According to ENMAX’s rate in January, the price of electricity currently sits at 15.9 cents per kilowatt-hour, with an electricity price spike from 7.9 cents per kilowatt-hour last year.

MacDonald said prices for electricity have been relatively low since 2018 but a swing in the price of oil has created more activity in the province’s industrial sector, and in turn more demand on the power grid.

According to MacDonald, the price increase can also be attributed to the removal of a consumer price cap that limited regulated rates to 6.8 cents per kilowatt-hour for households and small businesses with lower demand, which, after the carbon tax was repealed, initially remained in place.

Although the cap was scrapped by the UCP three years ago, he said energy bills now depend on the rate set by the market.

“What’s increased now recently is actually the price per kilowatt, and the (transmission and distribution) charges have only increased, but annually they increase between five and 10 per cent,” MacDonald said. “So the portion of your bill that’s increasing is different than what Albertans are typically used to, or at least in recent memory.”

But Albertans do have options, MacDonald said.

As part of its email to customers, ENMAX sent a list of energy saving tips to reduce energy consumption in people’s homes, including using cold water for laundry and avoiding dryer use, energy-efficient lightbulbs and unplugging electronics when they are not in use.

Retailers also offer contracts with floating or fixed rates for consumers.

“Fixed rates, obviously, you’re going to pick your price. It’s going to be the same each and every single month,” MacDonald said. “Floating rate is based off the wholesale spot market, and that has been exceptionally high the last few months.”

He said consumers looking to save money when electricity prices are high should look into a fixed rate.


Related News

View more

Sign Up for Electricity Forum’s Newsletter

Stay informed with our FREE Newsletter — get the latest news, breakthrough technologies, and expert insights, delivered straight to your inbox.

Electricity Today T&D Magazine Subscribe for FREE

Stay informed with the latest T&D policies and technologies.
  • Timely insights from industry experts
  • Practical solutions T&D engineers
  • Free access to every issue

Live Online & In-person Group Training

Advantages To Instructor-Led Training – Instructor-Led Course, Customized Training, Multiple Locations, Economical, CEU Credits, Course Discounts.

Request For Quotation

Whether you would prefer Live Online or In-Person instruction, our electrical training courses can be tailored to meet your company's specific requirements and delivered to your employees in one location or at various locations.