Shear Wind eager to expand in the Maritimes

By New Brunswick Business Journal


NFPA 70b Training - Electrical Maintenance

Our customized live online or in‑person group training can be delivered to your staff at your location.

  • Live Online
  • 12 hours Instructor-led
  • Group Training Available
Regular Price:
$599
Coupon Price:
$499
Reserve Your Seat Today
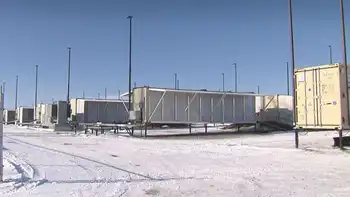
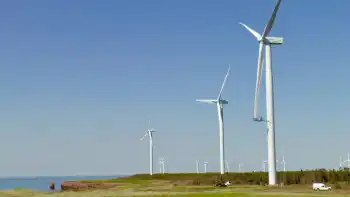
The head of Shear Wind Inc. says the partial launch of his company's Nova Scotia wind farm proves the firm can build more wind sites across Canada, possibly in northern New Brunswick.

"Anybody looking at Shear Wind... should understand and believe in our ability to execute on our projects," said company president and CEO Mike Magnus. "There were a bunch of hoops and hurdles to go through, but we made it."

On December 31, one-third of Shear Wind's 62-megawatt Glen Dhu wind farm went online.

That means the $150-million project, the company's first wind farm, is now producing electricity for Nova Scotia Power Inc. through a 20-year power purchase agreement.

"The first project is the most important one. It's a stepping stone for the growth we're planning over the next five years," Magnus said in an interview.

"It demonstrates the ability of this management team to execute and build out a successful wind farm.... It's a major accomplishment."

Magnus said the entire Glen Dhu site, located east of New Glasgow, will be up and running by March 31.

And by bringing Glen Dhu to fruition, Shear Wind has proven its ability to launch other wind farms, including in northern New Brunswick, Magnus said.

The company is looking to develop a 75 MW to 100 MW wind farm in Restigouche County. Costing up to $250 million, the project would create 150 construction jobs and 75 permanent positions, Magnus said.

The planned location, referred to as the Mann Siding site, is situated on Crown-leased land just outside the town of Saint-Quentin.

Magnus says the company is awaiting a request for proposals calling for more wind-powered electricity in New Brunswick. But it's unclear when, or if, that call will come.

In December, New Brunswick Energy Department spokesman Jim Hennessy said there are no current plans to commission more wind power.

"It's not as encouraging as I would like it to be," Magnus said.

"I hope their plans involve an RFP process in the future. We're investing a lot of effort in New Brunswick to be ready for an announcement like that," he said.

"But obviously we're not going to push forward without having agreements in place."

Currently, New Brunswick has 249 MW of installed wind power output, with an additional 45 MW scheduled to come online in February or March. That capacity is located on two wind farms: TransAlta's Kent Hills site near Moncton 150 MW, and the Caribou Wind Park near Bathurst 99 MW, which is owned by GDF Suez S.A.

Shear Wind, which is based in Halifax, wants to produce up to 500 MW of wind-generated electricity within five years. The company plans to start construction of its 100 MW Willowridge Project in southern Alberta in late 2011 or early 2012.

Inveravante, a privately held Spanish-utility conglomerate, holds 62 per cent of Shear Wind, which was founded in 2005 and initially funded by a group of friends.

Related News

Imported coal volumes up 17% during Apr-Oct as domestic supplies shrink

India Thermal Power Coal Imports surged 17.6% as CEA-monitored plants offset weaker CIL and SCCL supplies, driven by Saubhagya-led electricity demand, regional power deficits, and varied consumption across Uttar Pradesh, Bihar, Maharashtra, and Gujarat.


Key Points

Fuel volumes imported for Indian thermal plants, tracked by CEA, reflecting shifts in CIL/SCCL supply, demand, and regional power deficits.

✅ Imports up 17.6% as domestic CIL/SCCL deliveries lag targets

✅ Saubhagya-driven demand lifts generation in key beneficiary states

✅ Industrial slowdowns cut usage in Maharashtra, Tamil Nadu, Gujarat


The receipt of imported coal by thermal power plants, where plant load factors have risen, has shot up by 17.6 per cent during April-October. The coal import volumes refer to the power plants monitored by the Central Electricity Authority (CEA), and come amid moves to ration coal supplies as electricity demand surges, a power update report from CARE Ratings showed.

Imports escalated as domestic supplies by Coal India Ltd (CIL) and another state run producer- Singareni Collieries Company Ltd (SCCL) dipped in the period, after earlier shortages that have since eased in later months. Rate of supplies by the two coal companies to the CEA monitored power stations stood at 80.4 per cent, indicating a shortfall of 19.6 per cent against the allocated quantity.

According to the study by CARE Ratings, total coal supplied by CIL and SCCL to the power sector stood at 315.9 million tonnes (mt) during April-October as against 328.5 mt in the comparable period of last fiscal year.

The study noted that growth in power generation during the April-October 2019, with India now the third-largest electricity producer globally, was on account of higher demand from Pradhan Mantri Sahaj Bijli Har Ghar Yojana or Saubhagya Scheme beneficiary states. Providing connection to households in order to achieve 100% per cent electrification has in part helped the sector avert de-growth, as part of efforts to rewire Indian electricity and expand access.

Large states namely Uttar Pradesh, Bihar, Punjab, West Bengal and Rajasthan have recorded over five per cent growth in consumption of power. These states along with Odisha, Madhya Pradesh and Assam accounted for 75 per cent of the beneficiaries under the Saubhagya Scheme (Household Electrification Scheme). The ongoing economic downturn has led to a sharp fall in electricity demand from industrialised states. Maharashtra, which is also the largest power consuming state in India, recorded a decline in consumption of 5.6 per cent.

Other states namely Tamil Nadu, Telangana, Gujarat and Odisha too recorded fall in power consumed, echoing global dips in daily electricity demand seen later during the pandemic. These states house large clusters of mining, automobile, cement and other manufacturing industries, and a decline in these sectors led to fall in demand for power across these states. - The demand-supply gap or power deficit has remained at 0.6 per cent during the April-October 2019. North-East reported 4.8 per cent of power deficit followed by Northern Region at 1.3 per cent. Within Northern Region, Jammu & Kashmir and Uttar Pradesh accounted for 65 per cent and 30 per cent respectively of the regions power supply deficit.


Related News

View more

Southern California Edison Faces Lawsuits Over Role in California Wildfires

SCE Wildfire Lawsuits allege utility equipment and power lines sparked deadly Los Angeles blazes; investigations, inverse condemnation, and stricter utility regulations focus on liability, vegetation management, and wildfire safety amid Santa Ana winds.


Key Points

Residents sue SCE, alleging power lines ignited LA wildfires; seeking compensation under inverse condemnation.

✅ Videos cited show sparking lines near alleged ignition points.

✅ SCE denies wrongdoing; probes and inspections ongoing.

✅ Inverse condemnation may apply regardless of negligence.


In the aftermath of devastating wildfires in Los Angeles, residents have initiated legal action, similar to other mega-fire lawsuits underway in California, against Southern California Edison (SCE), alleging that the utility's equipment was responsible for sparking one of the most destructive fires. The fires have resulted in significant loss of life and property, prompting investigations into the causes and accountability of the involved parties.

The Fires and Their Impact

In early January 2025, Los Angeles experienced severe wildfires that ravaged neighborhoods, leading to the loss of at least 29 lives and the destruction of approximately 155 square kilometers of land. Areas such as Pacific Palisades and Altadena were among the hardest hit. The fires were exacerbated by arid conditions and strong Santa Ana winds, which contributed to their rapid spread and intensity.

Allegations Against Southern California Edison

Residents have filed lawsuits against SCE, asserting that the utility's equipment, particularly power lines, ignited the fires. Some plaintiffs have presented videos they claim show sparking power lines in the vicinity of the fire's origin. These legal actions seek to hold SCE accountable for the damages incurred, including property loss, personal injury, and emotional distress.

SCE's Response and Legal Context

Southern California Edison has denied any wrongdoing, stating that it has not detected any anomalies in its equipment that could have led to the fires. The utility has pledged to cooperate fully with investigations to determine the causes of the fires. California's legal framework, particularly the doctrine of "inverse condemnation," allows property owners to seek compensation from utilities for damages caused by public services, even without proof of negligence. This legal principle has been central in previous cases involving utility companies and wildfire damages, and similar allegations have arisen in other jurisdictions, such as an alleged faulty transformer case, highlighting shared risks.

Historical Context and Precedents

This situation is not unprecedented. In 2018, Pacific Gas and Electric (PG&E) faced similar allegations when its equipment was implicated in the Camp Fire, the deadliest wildfire in California's history. PG&E's equipment was found to have ignited the fire, and the company later pleaded guilty in the Camp Fire, leading to extensive litigation and financial repercussions for the company, while its bankruptcy plan won support from wildfire victims during restructuring. The case highlighted the significant risks utilities face regarding wildfire safety and the importance of maintaining infrastructure to prevent such disasters.

Implications for California's Utility Regulations

The current lawsuits against SCE underscore the ongoing challenges California faces in balancing utility operations with wildfire prevention, as regulators face calls for action amid rising electricity bills. The state has implemented stricter regulations and oversight, and lawmakers have moved to crack down on utility spending to mitigate wildfire risks associated with utility infrastructure. Utilities are now required to invest in enhanced safety measures, including equipment inspections, vegetation management, and the implementation of advanced technologies to detect and prevent potential fire hazards. These regulatory changes aim to reduce the incidence of utility-related wildfires and protect communities from future disasters.

The legal actions against Southern California Edison reflect the complex interplay between utility operations, public safety, and environmental stewardship. As investigations continue, the outcomes of these lawsuits may influence future policies and practices concerning utility infrastructure and wildfire prevention in California. The state remains committed to enhancing safety measures to protect its residents and natural resources from the devastating effects of wildfires.


Related News

View more

U.S. Electricity and natural gas prices explained

Energy Pricing Factors span electricity generation, transmission, and distribution costs, plus natural gas supply-demand, renewables, seasonal peaks, and wholesale pricing effects across residential, commercial, and industrial customers, usage patterns, weather, and grid constraints.


Key Points

They are the costs and market forces driving electricity and natural gas prices, from generation to delivery and demand.

✅ Generation, transmission, distribution shape electricity rates

✅ Gas prices hinge on supply, storage, imports/exports

✅ Demand shifts: weather, economy, and fuel alternatives


There are a lot of factors that affect energy prices globally. What’s included in the price to heat homes and supply them with electricity may be a lot more than some people may think.

Electricity
Generating electricity is the largest component of its price, according to the U.S. Energy Information Administration (EIA). Generation accounts for 56% of the price of electricity, while distribution and transmission account for 31% and 13% respectively.

Homeowners and businesses pay more for electricity than industrial companies, and U.S. electricity prices have recently surged, highlighting broader inflationary pressures. This is because industrial companies can take electricity at higher voltages, reducing transmission costs for energy companies.

“Industrial consumers use more electricity and can receive it at higher voltages, so supplying electricity to these customers is more efficient and less expensive. The price of electricity to industrial customers is generally close to the wholesale price of electricity,” EIA explains.

NYSEG said based on the average use of 600 kilowatt-hours per month, its customers spent the most money on delivery and transition charges in 2020, 57% or about $42, and residential electricity bills increased 5% in 2022 after inflation, according to national data. They also spent on average 35% (~$26) on supply charges and 8% (~$6) on surcharges.

Electricity prices are usually higher in the summer. Why? Because energy companies use sources of electricity that cost more money. It used to be that renewable sources, like solar and wind, were the most expensive sources of energy but increased technological advances have changed this, according to the International Energy Agency’s 2021 World Energy Outlook.

“In most markets, solar PV or wind now represents the cheapest available source of new electricity generation. Clean energy technology is becoming a major new area for investment and employment – and a dynamic arena for international collaboration and competition,” the report said.

Natural gas
The price of natural gas is driven by supply and demand. If there is more supply, prices are generally lower. If there is not as much supply, prices are generally higher the EIA explains. On the other side of the equation, more demand can also increase the price and less demand can decrease the price.

High natural gas prices mean people turn their home thermostats down a few degrees to save money, so the EIA said reduced demand can encourage companies to produce more natural gas, which would in turn help lower the cost. Lower prices will sometimes cause companies to reduce their production, therefore causing the price to rise.

The three major supply factors that affect prices: the amount of natural gas produced, how much is stored, and the volume of gas imported and exported. The three major demand factors that affect price are: changes in winter/summer weather, economic growth, and the broader energy crisis dynamics, as well as how much other fuels are available and their price, said EIA.

To think the price of natural gas is higher when the economy is thriving may sound counterintuitive but that’s exactly what happens. The EIA said this is because of increases in demand.


Related News

View more

Does Providing Electricity To The Poor Reduce Poverty? Maybe Not

Rural Electrification Poverty Impact examines energy access, grid connections, and reliability, testing economic development claims via randomized trials; findings show minimal gains without appliances, reliable supply, and complementary services like education and job creation initiatives.


Key Points

Study of household grid connections showing modest poverty impact without reliable power and appliances.

✅ Randomized grid connections showed no short-term income gains.

✅ Low reliability and few appliances limited electricity use.

✅ Complementary investments in jobs, education, health may be needed.


The head of Swedfund, the development finance group, recently summarized a widely-held belief: “Access to reliable electricity drives development and is essential for job creation, women’s empowerment and combating poverty.” This view has been the driving force behind a number of efforts to provide electricity to the 1.1 billion people around the world living in energy poverty, such as India's village electrification initiatives in recent years.

But does electricity really help lift households out of poverty? My co-authors and I set out to answer this question. We designed an experiment in which we first identified a sample of “under grid” households in Western Kenya—structures that were located close to but not connected to a grid. These households were then randomly divided into treatment and control groups. In the treatment group, we worked closely with the rural electrification agency to connect the households to the grid for free or at various discounts. In the control group, we made no changes. After eighteen months, we surveyed people from both groups and collected data on an assortment of outcomes, including whether they were employed outside of subsistence agriculture (the most common type of work in the region) and how many assets they owned. We even gave children basic tests, as a frequent assertion is that electricity helps children perform better in school since they are able to study at night.

When we analyzed the data, we found no differences between the treatment and control groups. The rural electrification agency had spent more than $1,000 to connect each household. Yet eighteen months later, the households we connected seemed to be no better off. Even the children’s test scores were more or less the same. The results of our experiment were discouraging, and at odds with the popular view that supplying households with access to electricity will drive economic development. Lifting people out of poverty may require a more comprehensive approach to ensure that electricity is not only affordable (with some evidence that EV growth can benefit all customers in mature markets), but is also reliable, useable, and available to the whole community, paired with other important investments.

For instance, in many low-income countries, the grid has frequent blackouts and maintenance problems, making electricity unreliable, as seen in Nigeria's electricity crisis in recent years. Even if the grid were reliable, poor households may not be able to afford the appliances that would allow for more than just lighting and cell phone charging. In our data, households barely bought any appliances and they used just 3 kilowatt-hours per month. Compare that to the U.S. average of 900 kilowatt-hours per month, a figure that could rise as EV adoption increases electricity demand over time.

There are also other factors to consider. After all, correlation does not equal causation. There is no doubt that the 1.1 billion people without power are the world’s poorest citizens. But this is not the only challenge they face. The poor may also lack running water, basic sanitation, consistent food supplies, quality education, sufficient health care, political influence, and a host of other factors that may be harder to measure but are no less important to well-being. Prioritizing investments in some of these other factors may lead to higher immediate returns. Previous work by one of my co-authors, for example, shows substantial economic gains from government spending on treatment for intestinal worms in children.

It’s possible that our results don’t generalize. They certainly don’t apply to enhancing electricity services for non-residential customers, like factories, hospitals, and schools, and electric utilities adapting to new load patterns. Perhaps the households we studied in Western Kenya are particularly poor (although measures of well-being suggest they are comparable to rural households across Sub-Saharan Africa) or politically disenfranchised. Perhaps if we had waited longer, or if we had electrified an entire region, the household impacts we measured would have been much greater. But others who have studied this question have found similar results. One study, also conducted in Western Kenya, found that subsidizing solar lamps helped families save on kerosene, but did not lead children to study more. Another study found that installing solar-powered microgrids in Indian villages resulted in no socioeconomic benefits.


Related News

View more

Roads Need More Electricity: They Will Make It Themselves

Electrically Smart Roads integrate solar road surfaces, inductive charging, IoT sensors, AI analytics, and V2X to power lighting, deicing, and monitoring, reducing grid dependence while enabling dynamic EV charging and real-time traffic management.


Key Points

Electrically smart roads generate power, sense conditions, and charge EVs using solar, IoT, AI, and dynamic infrastructure.

✅ Solar surfaces, verges, and gantries generate on-site electricity

✅ Inductive lanes enable dynamic EV charging at highway speeds

✅ Embedded IoT sensors and AI deliver real-time traffic insights


As more and more capabilities are added to roads instead of simply covering a country with extra roads, they are starting to make their own electricity, notably as solar road surface but then with added silent wind turbines, photovoltaic verges and barriers and more.

That toll gate, street light and traffic monitoring system all need electricity. Later, roads that deice and charge vehicles at speed will need huge amounts of electricity. For now, electricity for road systems is provided by very expensive infrastructure to the grid, and grid flexibility for EVs remains a concern, except for a few solar/ wind street lights in China and Korea for example. However, as more and more capabilities are added to roads instead of simply covering a country with extra roads, they are starting to make their own electricity, notably as solar road surface but then with added silent wind turbines, photovoltaic verges and barriers and more. There is also highly speculative work in the USA and UK on garnering power from road surface movement using piezoelectrics and electrodynamics and even its heat. 

#google#

China plans to create an intelligent transport system by 2030. The country hopes to build smart roads that will not only be able to charge electric cars as they drive but also monitor temperature, traffic flow and weight load using artificial intelligence. Indeed, like France, the Netherlands and the USA, where U.S. EV charging capacity is under scrutiny, it already has trials of extended lengths of solar road which cost no more than regular roads. In an alternative approach, vehicles go under tunnels of solar panels that also support lighting, light-emitting signage and monitoring equipment using the electricity made where it is needed. See the IDTechEx Research report, Electrically Smart Roads 2018-2028 for more.

Raghu Das, CEO of IDTechEx says, "The spiral vertical axis wind turbines VAWT in Asia rarely rotate because they are too low but much higher versions are planned on large UK roadside vehicle charging centres that should work well. H shaped VAWT is also gaining traction - much slower and quieter than the propeller shape which vibrates and keeps you awake at night in an urban area.

The price gap between the ubiquitous polycrystalline silicon solar cell and the much more efficient single crystal silicon is narrowing. That means that road furniture such as bus shelters and smart gantries will likely go for more solar rather than adding wind power in many cases, a shift mirrored by connected solar tech in homes, because wind power needs a lot of maintenance and its price is not dropping as rapidly."

The IDTechEx Research report, Off Grid Electric Vehicle Charging: Zero Emission 2018-2028 analyses that aspect, while vehicle-to-grid strategies may complement grid resources. The prototype of a smart road is already in place on an expressway outside of Jinan, providing better traffic updates as well as more accurate mapping. Verizon's IoT division has launched a project around intelligent asphalt, which it thinks has the potential to significantly reduce fossil fuel emissions and save time by reducing up to 44% of traffic backups. It has partnered with Sacramento, California, to test this theory.

"By embedding sensors into the pavement as well as installing cameras on traffic lights, we will be able to study and analyze the flow of traffic. Then, we will take all of that data and use it to optimize the timing of lights so that traffic flows easier and travel times are shorter," explains Sean Harrington, vice president of Verizon Smart Communities.

Colorado's Department of Transportation has recently announced its intention to be the first state to pilot smart roads by striking a five-year deal with a smart road company to test the technology. Like planned auto-deicing roads elsewhere, the aim of this project is, first and foremost, to save lives. The technology will detect when a car suddenly leaves a road and send emergency assistance to the area. The IDTechEx Research report Electrically Smart Roads 2018-2028 describes how others work on real time structural monitoring of roads and embedded interactive lighting and road surface signage.

"Smart pavement can make that determination and send that information directly into a vehicle," Peter Kozinski, director of CDOT's RoadX division, tells the Denver Post. "Data is the new asphalt of transportation."   Sensors, processors and other technology are embedded in the Colorado road to extend capability beyond accidents and reach into better road maintenance. Fast adoption relies on the ability to rapidly install sensor-laden pavement or lay concrete slabs. Attention therefore turns to fast adaptation of existing roads. Indeed, even for the heavy coil arrays used for dynamic vehicle charging, even as state power grids face new challenges, in Israel there are machines that can retrofit into the road surface at a remarkable two kilometres of cut and insert in a day.

"It's hard to imagine that these things are inexpensive, with all the electronics in them," Charles Schwartz, a professor of civil and environmental engineering at the University of Maryland, tells the Denver Post concerning the vehicle sensing project, "but CDOT is a fairly sophisticated agency, and this is an interesting pilot project. We can learn a lot, even if the test is only partially successful."


Related News

View more

Brazil tax strategy to bring down fuel, electricity prices seen having limited effects

Brazil ICMS Tax Cap limits state VAT on fuels, natural gas, electricity, communications, and transit, promising short-term price relief amid inflation, with federal compensation to states and potential legal challenges affecting investments and ANP auctions.


Key Points

A policy capping state VAT at 17-18 percent on fuels, electricity, and services to temper prices and inflation.

✅ Caps VAT to 17-18% on fuels, power, telecom, transit

✅ Short-term relief; medium-long term impact uncertain

✅ Federal compensation; potential court challenges, investment risk


Brazil’s congress approved a bill that limits the ICMS tax rate that state governments can charge on fuels, natural gas, electricity, communications, and public transportation. 

Local lawyers told BNamericas that the measure may reduce fuel and power prices in the short term, similar to Brazil power sector relief loans seen during the pandemic, but it is unlikely to produce any major effects in the medium and long term. 

In most states the ceiling was set at 17% or 18% and the federal government will pay compensation to the states for lost tax revenue until December 31, via reduced payments on debts that states owe the federal government.

The bill will become law once signed by President Jair Bolsonaro, who pushed strongly for the proposal with an eye on his struggling reelection campaign for the October presidential election. Double-digit inflation has turned into a major election issue and fuel and electricity prices have been among the main inflation drivers, as seen in EU energy-driven inflation across the bloc this year. Congress’ approval of the bill is seen by analysts as political victory for the Brazilian leader.

How much difference will it make?

Marcus Francisco, tax specialist and partner at Villemor Amaral Advogados, said that in the formation of fuel and electricity prices there are other factors, including high natural gas prices, that drive increases.

“In the case of fuels, if the barrel of oil [price] increases, automatically the final price for the consumer will go up. For electricity, on the other hand, there are several subsidies and policy choices such as Florida rejecting federal solar incentives that are part of the price and that can increase the rate [paid],” he said. 

There is also a possibility that some states will take the issue to the supreme court since ICMS is a key source of revenue for them, Francisco added.

Tiago Severini, a partner at law firm Vieira Rezende, said the comparison between the revenue impact and the effective price reduction, based on the estimates made by the states and the federal government, seems disproportionate, and, as seen in Europe, rolling back European electricity prices is often tougher than it appears. 

“In other words, a large tax collection impact is generated, which is quite unequal among the different states, for a not so strong price reduction,” he said.

“Due to the lack of clarity regarding the precision of the calculations involved, it’s difficult even to assess the adequacy of the offsets the federal government has been considering, and international cases such as France's new electricity pricing scheme illustrate how complex it can be to align fiscal offsets with regulatory constraints, to cover the cost it would have with the compensation for the states” Severini added.

The compensation ideas that are known so far include hiking other taxes, such as the social contribution on net profits (CSLL) that is paid by oil and gas firms focused on exploration and production.

“This can generate severe adverse effects, such as legal disputes, reduced investments in the country, and reduced attractiveness of the new auctions by [sector regulator] ANP, and costly interventions like the Texas electricity market bailout after extreme weather events,” Severini said. 


Related News

View more

Sign Up for Electricity Forum’s Newsletter

Stay informed with our FREE Newsletter — get the latest news, breakthrough technologies, and expert insights, delivered straight to your inbox.

Electricity Today T&D Magazine Subscribe for FREE

Stay informed with the latest T&D policies and technologies.
  • Timely insights from industry experts
  • Practical solutions T&D engineers
  • Free access to every issue

Download the 2025 Electrical Training Catalog

Explore 50+ live, expert-led electrical training courses –

  • Interactive
  • Flexible
  • CEU-cerified