Warren Buffett-linked company to build $200M wind power farm in Alberta


warren buffett

NFPA 70e Training

Our customized live online or in‑person group training can be delivered to your staff at your location.

  • Live Online
  • 6 hours Instructor-led
  • Group Training Available
Regular Price:
$199
Coupon Price:
$149
Reserve Your Seat Today

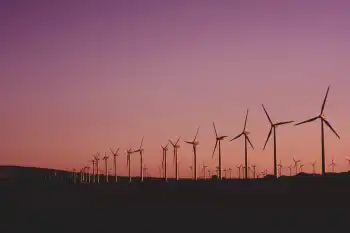
Rattlesnake Ridge Wind Project delivers 117.6 MW in southeast Alberta for BHE Canada, a Berkshire Hathaway Energy subsidiary, using 28 turbines near Medicine Hat under a long-term PPA, supplying renewable power to 79,000 homes.


Key Points

A 117.6 MW Alberta wind farm by BHE Canada supplying 79,000 homes via 28 turbines and a long-term PPA.

✅ 28 turbines near Medicine Hat, 117.6 MW capacity

✅ Long-term PPA with a major Canadian corporate buyer

✅ Developed with RES; no subsidies; competitive pricing


A company linked to U.S. investor Warren Buffett says it will break ground on a $200-million, 117.6-megawatt wind farm in southeastern Alberta next year.

In a release, Calgary-based BHE Canada, a subsidiary of Buffett's Berkshire Hathaway Energy, says its Rattlesnake Ridge Wind project will be located southwest of Medicine Hat and will produce enough energy to supply the equivalent of 79,000 homes.

"We felt that it was time to make an investment here in Alberta," said Bill Christensen, vice-president of corporate development for BHE Canada, in an interview with the Calgary Eyeopener.

"The structure of the markets here in Alberta, including frameworks for selling renewable energy, make it so that we can invest, and do it at a profit that works for us, and at a price that works for the off-taker," Christensen explained.

Berkshire Hathaway Energy also owns AltaLink, the regulated transmission company that supplies electricity to more than 85 per cent of the Alberta population.

BHE Canada says an unnamed large Canadian corporate partner has signed a long-term power purchase agreement, similar to RBC's solar purchase arrangements, for the majority of the energy output generated by the 28 turbines at Rattlesnake Ridge.

"If you look at just the raw power price that power is going for in Alberta right now, it's averaged around $55 a megawatt hour, or 5.5 cents a kilowatt hour. And we're selling the wind power to this customer at substantially less than that, reflecting wind power's competitiveness in the market, and there's been no subsidies," Christensen said.


Positive energy outlook

Christensen said he sees a good future for Alberta's renewable energy industry, not just in wind but also in solar power growth, particularly in the southeast of the province.

But he says BHE Canada is interested in making investments in traditional energy in Alberta, too, as the province is a powerhouse for both green energy and fossil fuels overall.

"It's not a choice of one or the other. I think there is still opportunity to make investments in oil and gas," he said.

"We're really excited about having this project and hope to be able to make other investments here in Alberta to help support the economy here, amid a broader renewable energy surge across the province."

The project is being developed by U.K.-based Renewable Energy Systems, part of a trend where more energy sources make better projects for developers, which is building two other Alberta wind projects totalling 134.6 MW this year and has 750 MW of renewable energy installed or currently under construction in Canada.

BHE Canada and RES are also looking for power purchase partners for the proposed Forty Mile Wind Farm in southeastern Alberta. They say that with generation capacity of 398.5 MW, it could end up being the largest wind power project in Canada.

Related News

Which of the cleaner states imports dirty electricity?

Hourly Electricity Emissions Tracking maps grid balancing areas, embodied emissions, and imports/exports, revealing carbon intensity shifts across PJM, ERCOT, and California ISO, and clarifying renewable energy versus coal impacts on health and climate.


Key Points

An hourly method tracing generation, flows, and embodied emissions to quantify carbon intensity across US balancing areas.

✅ Hourly traces of imports/exports and generation mix

✅ Consumption-based carbon intensity by balancing area

✅ Policy insights for renewables, coal, health costs


In the United States, electricity generation accounts for nearly 30% of our carbon emissions. Some states have responded to that by setting aggressive renewable energy standards; others are hoping to see coal propped up even as its economics get worse. Complicating matters further is the fact that many regional grids are integrated, and as America goes electric the stakes grow, meaning power generated in one location may be exported and used in a different state entirely.

Tracking these electricity exports is critical for understanding how to lower our national carbon emissions. In addition, power from a dirty source like coal has health and environment impacts where it's produced, and the costs of these aren't always paid by the parties using the electricity. Unfortunately, getting reliable figures on how electricity is produced and where it's used is challenging, even for consumers trying to find where their electricity comes from in the first place, leaving some of the best estimates with a time resolution of only a month.

Now, three Stanford researchers—Jacques A. de Chalendar, John Taggart, and Sally M. Benson—have greatly improved on that standard, and they have managed to track power generation and use on an hourly basis. The researchers found that, of the 66 grid balancing areas within the United States, only three have carbon emissions equivalent to our national average, and they have found that imports and exports of electricity have both seasonal and daily changes. de Chalendar et al. discovered that the net results can be substantial, with imported electricity increasing California's emissions/power by 20%.

Hour by hour
To figure out the US energy trading landscape, the researchers obtained 2016 data for grid features called balancing areas. The continental US has 66 of these, providing much better spatial resolution on the data than the larger grid subdivisions. This doesn't cover everything—several balancing areas in Canada and Mexico are tied in to the US grid—and some of these balancing areas are much larger than others. The PJM grid, serving Pennsylvania, New Jersey, and Maryland, for example, is more than twice as large as Texas' ERCOT, in a state that produces and consumes the most electricity in the US.

Despite these limitations, it's possible to get hourly figures on how much electricity was generated, what was used to produce it, and whether it was used locally or exported to another balancing area. Information on the generating sources allowed the researchers to attach an emissions figure to each unit of electricity produced. Coal, for example, produces double the emissions of natural gas, which in turn produces more than an order of magnitude more carbon dioxide than the manufacturing of solar, wind, or hydro facilities. These figures were turned into what the authors call "embodied emissions" that can be traced to where they're eventually used.

Similar figures were also generated for sulfur dioxide and nitrogen oxides. Released by the burning of fossil fuels, these can both influence the global climate and produce local health problems.

Huge variation
The results were striking. "The consumption-based carbon intensity of electricity varies by almost an order of magnitude across the different regions in the US electricity system," the authors conclude. The low is the Bonneville Power grid region, which is largely supplied by hydropower; it has typical emissions below 100kg of carbon dioxide per megawatt-hour. The highest emissions come in the Ohio Valley Electric region, where emissions clear 900kg/MW-hr. Only three regional grids match the overall grid emissions intensity, although that includes the very large PJM (where capacity auction payouts recently fell), ERCOT, and Southern Co balancing areas.

Most of the low-emissions power that's exported comes from the Pacific Northwest's abundant hydropower, while the Rocky Mountains area exports electricity with the highest associated emissions. That leads to some striking asymmetries. Local generation in the hydro-rich Idaho Power Company has embodied emissions of only 71kg/MW-hr, while its imports, coming primarily from Rocky Mountain states, have a carbon content of 625kg/MW-hr.

The reliance on hydropower also makes the asymmetry seasonal. Local generation is highest in the spring as snow melts, but imports become a larger source outside this time of year. As solar and wind can also have pronounced seasonal shifts, similar changes will likely be seen as these become larger contributors to many of these regional grids. Similar things occur daily, as both demand and solar production (and, to a lesser extent, wind) have distinct daily profiles.

The Golden State
California's CISO provides another instructive case. Imports represent less than 30% of its total electric use in 2016, yet California electricity imports provided 40% of its embodied emissions. Some of these, however, come internally from California, provided by the Los Angeles Department of Water and Power. The state itself, however, has only had limited tracking of imported emissions, lumping many of its sources as "other," and has been exporting its energy policies to Western states in ways that shape regional markets.

Overall, the 2016 inventory provides a narrow picture of the US grid, as plenty of trends are rapidly changing our country's emissions profile, including the rise of renewables and the widespread adoption of efficiency measures and other utility trends in 2017 that continue to evolve. The method developed here can, however, allow for annual updates, providing us with a much better picture of trends. That could be quite valuable to track things like how the rapid rise in solar power is altering the daily production of clean power.

More significantly, it provides a basis for more informed policymaking. States that wish to promote low-emissions power can use the information here to either alter the source of their imports or to encourage the sites where they're produced to adopt more renewable power. And those states that are exporting electricity produced primarily through fossil fuels could ensure that the locations where the power is used pay a price that includes the health costs of its production.


Related News

View more

Ontario's electricity operator kept quiet about phantom demand that cost customers millions

IESO Fictitious Demand Error inflated HOEP in the Ontario electricity market, after embedded generation was mis-modeled; the OEB says double-counted load lifted wholesale prices and shifted costs via the Global Adjustment.


Key Points

An IESO modeling flaw that double-counted load, inflating HOEP and charges in Ontario's wholesale market.

✅ Double-counted unmetered load from embedded generation

✅ Inflated HOEP; shifted costs via Global Adjustment

✅ OEB flagged transparency; exporters paid more


For almost a year, the operator of Ontario’s electricity system erroneously counted enough phantom demand to power a small city, causing prices to spike and hundreds of millions of dollars in extra charges to consumers, according to the provincial energy regulator.

The Independent Electricity System Operator (IESO) also failed to tell anyone about the error once it noticed and fixed it.

The error likely added between $450 million and $560 million to hourly rates and other charges before it was fixed in April 2017, according to a report released this month by the Ontario Energy Board’s Market Surveillance Panel.

It did this by adding as much as 220 MW of “fictitious demand” to the market starting in May 2016, when the IESO started paying consumers who reduced their demand for power during peak periods. This involved the integration of small-scale embedded generation (largely made up of solar) into its wholesale model for the first time.

The mistake assumed maximum consumption at such sites without meters, and double-counted that consumption.

The OEB said the mistake particularly hurt exporters and some end-users, who did not benefit from a related reduction of a global adjustment rate applicable to other customers.

“The most direct impact of the increase in HOEP (Hourly Ontario Energy Price) was felt by Ontario consumers and exporters of electricity, who paid an artificially high HOEP, to the benefit of generators and importers,” the OEB said.

The mix-up did not result in an equivalent increase in total system costs, because changes to the HOEP are offset by inverse changes to a electricity cost allocation mechanism such as the Global Adjustment rate, the OEB noted.


A chart from the OEB's report shows the time of day when fictitious demand was added to the system, and its influence on hourly rates.

Peak time spikes
The OEB said that the fictitious demand “regularly inflated” the hourly price of energy and other costs calculated as a direct function of it.

For almost a year, Ontario's electricity system operator @IESO_Tweets erroneously counted enough phantom demand to power a small city, causing price spikes and hundreds of millions in charges to consumers, @OntEnergyBoard says. @5thEstate reports.

It estimated the average increase to the HOEP was as much as $4.50/MWh, but that price spikes, compounded by scheduled OEB rate changes, would have been much higher during busier times, such as the mid-morning and early evening.

“In times of tight supply, the addition of fictitious demand often had a dramatic inflationary impact on the HOEP,” the report said.

That meant on one summer evening in 2016 the hourly rate jumped to $1,619/MWh, it said, which was the fourth highest in the history of the Ontario wholesale electricity market.

“Additional demand is met by scheduling increasingly expensive supply, thus increasing the market price. In instances where supply is tight and the supply stack is steep, small increases in demand can cause significant increases in the market price.

The OEB questioned why, as of September this year, the IESO had failed to notify its customers or the broader public, amid a broader auditor-regulator dispute that drew political attention, about the mistake and its effect on prices.

“It's time for greater transparency on where electricity costs are really coming from,” said Sarah Buchanan, clean energy program manager at Environmental Defence.

“Ontario will be making big decisions in the coming years about whether to keep our electricity grid clean, or burn more fossil fuels to keep the lights on,” she added. “These decisions need to be informed by the best possible evidence, and that can't happen if critical information is hidden.”

In a response to the OEB report on Monday, the IESO said its own initial analysis found that the error likely pushed wholesale electricity payments up by $225 million. That calculation assumed that the higher prices would have changed consumer behaviour, while upcoming electricity auctions were cited as a way to lower costs, it said.

In response to questions, a spokesperson said residential and small commercial consumers would have saved $11 million in electricity costs over the 11-month period, even as a typical bill increase loomed province-wide, while larger consumers would have paid an extra $14 million.

That is because residential and small commercial customers pay some costs via time-of-use rates, including a temporary recovery rate framework, the IESO said, while larger customers pay them in a way that reflects their share of overall electricity use during the five highest demand hours of the year.

The IESO said it could not compensate those that had paid too much, given the complexity of the system, and that the modelling error did not have a significant impact on ratepayers.

While acknowledging the effects of the mistake would vary among its customers, the IESO said the net market impact was less than $10 million, amid ongoing legislation to lower electricity rates in Ontario.

It said it would improve testing of its processes prior to deployment and agreed to publicly disclose errors that significantly affect the wholesale market in the future.


Related News

View more

Poland’s largest power group opts to back wind over nuclear

Poland Offshore Wind Energy accelerates as PGE exits nuclear leadership, PKN Orlen steps in, and Baltic Sea projects expand to cut coal reliance, meet EU emissions goals, attract investors, and bridge the power capacity gap.


Key Points

A shift from coal and nuclear to Baltic offshore wind to add capacity, cut EU emissions, and attract investment.

✅ PGE drops lead in nuclear; pivots $10bn to offshore wind.

✅ PKN Orlen may assume nuclear role; projects await approval.

✅ 6 GW offshore could add 60b zlotys and 77k jobs by 2030.


PGE, Poland’s biggest power group has decided to abandon a role in building the country’s first nuclear power plant and will instead focus investment on offshore wind energy.

Reuters reports state-run refiner PKN Orlen (PKN.WA) could take on PGE’s role, while the latter announces a $10bn offshore wind power project.

Both moves into renewables and nuclear represent a major change in Polish energy policy, diversifying away from the country’s traditional coal-fired power base, as regional efforts like the North Sea wind farms initiative expand, in a bid to fill an electricity shortfall and meet EU emission standards.

An unnamed source told the news agency, PGE could not fund both projects and cheap technology had swung the decision in favour of wind, with offshore wind competing with gas in some markets. PGE could still play a smaller role in the nuclear project which has been delayed and still needs government approval.

#google#

A proposed law is currently before the Polish parliament aiming at facilitating easy construction of wind turbines, mindful of Germany’s grid expansion challenges that have hindered rollout.

If the law is passed, as expected, several other wind farm projects could also proceed.

Polenergia has said it would like to build a wind farm in the Baltic by 2022. PKN Orlen is also considering building one.

PGE said in March that it wants to build offshore windfarms with a capacity of 2.5 gigawatts (GW) by 2030.

Analysts and investors say that offshore wind farms are the easiest and fastest way for Poland to fill the expected capacity gap from coal, with examples like the largest UK offshore wind farm coming online underscoring momentum, and reduce CO2 emissions in line with EU’s 2030 targets as Poland seeks improved ties with Brussels.

The decision to open up the offshore power industry could also draw in investors, as shown by Japanese utilities’ UK offshore investment attracting cross-border capital. Statoil said in April it would join Polenergia’s offshore project which has drawn interest from other international wind companies. “

The Polish Wind Energy Association (PWEA) estimates that offshore windfarms with a total capacity of 6 GW would help create around 77,000 new jobs and add around 60 billion zlotys to economic growth.


Related News

View more

Ontario, Quebec to swap energy in new deal to help with electricity demands

Ontario-Quebec Energy Swap streamlines electricity exchange, balancing peak demand across clean grids with hydroelectric and nuclear power, enhancing reliability, capacity banking, and interprovincial load management for industry growth, EV adoption, and seasonal heating-cooling needs.


Key Points

10-year, no-cash power swap aligning peaks; hydro and nuclear enhance reliability and let Ontario bank capacity.

✅ Up to 600 MW exchanged yearly; reviews adjust volumes

✅ Peaks differ: summer A/C in Ontario, winter heating in Quebec

✅ Capacity banking enables future-year withdrawals


Ontario and Quebec have agreed to swap energy to build on an electricity deal to help each other out when electricity demands peak.

The provinces' electricity operators, the Independent Electricity System Operator holds capacity auctions and Hydro-Quebec, will trade up to 600 megawatts of energy each year, said Ontario Energy Minister Todd Smith.

“The deal just makes a lot of sense from both sides,” Smith said in an interview.

“The beauty as well is that Quebec and Ontario are amongst the cleanest grids around.”

The majority of Ontario's power comes from nuclear energy while the majority of Quebec's energy comes from hydroelectric power, including Labrador power in regional transmission networks.

The deal works because Ontario and Quebec's energy peaks come at different times, Smith said.

Ontario's energy demands spike in the summer, largely driven by air conditioning on hot days, and the province has occasionally set off-peak electricity prices to provide temporary relief, he said.

Quebec's energy needs peak in the winter, mostly due to electric heating on cold days.

The deal will last 10 years, with reviews along the way to adjust energy amounts based on usage.

“With the increase in energy demand, we must adopt more energy efficiency programs like Peak Perks and intelligent measures in order to better manage peak electricity consumption,” Quebec's Energy Minister Pierre Fitzgibbon wrote in a statement.

Smith said the energy deal is a straight swap, with no payments on either side, and won't reduce hydro bills as the transfer could begin as early as this winter.

Ontario will also be able to bank unused energy to save capacity until it is needed in future years, Smith said.

Both provinces are preparing for future energy needs, as electricity demands are expected to grow dramatically in the coming years with increased demand from industry and the rise of electric vehicles, and Ontario has tabled legislation to lower electricity rates to support consumers.


Related News

View more

Strong Winds Knock Out Power Across Miami Valley

Miami Valley Windstorm Power Outages disrupted thousands as 60 mph gusts toppled trees, downed power lines, and damaged buildings. Utility crews and emergency services managed debris, while NWS alerts warned of extended restoration.


Key Points

Region-wide power losses from severe winds in the Miami Valley, causing damage, debris, and restoration.

✅ 60 mph gusts downed trees, snapped lines, blocked roads

✅ Crews from DP&L worked extended shifts to restore service

✅ NWS issued wind advisories; schools, businesses closed


On a recent day, powerful winds tore through the Miami Valley, causing significant disruption across the region. The storm, which was accompanied by gusts reaching dangerous speeds, led to windstorm power outages affecting thousands of homes and businesses. As trees fell and power lines were snapped, many residents found themselves without electricity for hours, and in some cases, even days.

The high winds, which were part of a larger weather system moving through the area, left a trail of destruction in their wake. In addition to power outages, there were reports of storm damage to buildings, vehicles, and other structures. The force of the wind uprooted trees, some of which fell on homes and vehicles, causing significant property damage. While the storm did not result in any fatalities, the destruction was widespread, with many communities experiencing debris-filled streets and blocked roads.

Utility companies in the Miami Valley, including Dayton Power & Light, quickly mobilized crews, similar to FPL's storm response in major events, to begin restoring power to the affected areas. However, the high winds presented a challenge for repair crews, as downed power lines and damaged equipment made restoration efforts more difficult. Many customers were left waiting for hours or even days for their power to be restored, and some neighborhoods were still experiencing outages several days after the storm had passed.

In response to the severe weather, local authorities issued warnings to residents, urging them to stay indoors and avoid unnecessary travel. Wind gusts of up to 60 miles per hour were reported, making driving hazardous, particularly on bridges and overpasses, similar to Quebec windstorm outages elsewhere. The National Weather Service also warned of the potential for further storm activity, advising people to remain vigilant as the system moved eastward.

The impact of the storm was felt not only in terms of power outages but also in the strain it placed on emergency services. With trees blocking roads and debris scattered across the area, first responders were required to work quickly and efficiently to clear paths and assist those in need. Many residents were left without heat, refrigeration, and in some cases, access to medical equipment that relied on electricity.

Local schools and businesses were also affected by the storm. Many schools had to cancel classes, either due to power outages or because roads were impassable. Businesses, particularly those in the retail and service sectors, faced disruptions in their operations as they struggled to stay open without power amid extended outages that lingered, or to address damage caused by fallen trees and debris.

In the aftermath of the storm, Miami Valley residents are working to clean up and assess the damage. Many homeowners are left dealing with the aftermath of tree removal, property repairs, and other challenges. Meanwhile, local governments are focusing on restoring infrastructure, as seen after Toronto's spring storm outages in recent years, and ensuring that the power grid is secured to prevent further outages.

While the winds have died down and conditions have improved, the storm’s impact will be felt for weeks to come, reflecting Florida's weeks-long restorations after severe storms. The region will continue to recover from the damage, but the event serves as a reminder of the power of nature and the resilience of communities in the face of adversity. For residents affected by the power outages, recovery will require patience as utility crews and local authorities work tirelessly to restore normalcy.

Looking ahead, experts are urging residents to prepare for the next storm season by ensuring that they have emergency kits, backup generators, and contingency plans in place. As climate change contributes to more extreme weather events, it is likely that storms of this magnitude will become more frequent. By taking steps to prepare in advance, communities across the Miami Valley can better handle whatever challenges come next.


Related News

View more

Ford's Washington Meeting: Energy Tariffs and Trade Tensions with U.S

Ontario-U.S. Energy Tariff Dispute highlights cross-border trade tensions, retaliatory tariffs, export surcharges, and White House negotiations as Doug Ford meets U.S. officials to de-escalate pressure over steel, aluminum, and energy supplies.


Key Points

A trade standoff over energy exports and tariffs, sparked by Ontario's surcharge and U.S. duties on steel and aluminum.

✅ 25% Ontario energy surcharge paused before White House talks

✅ U.S. steel and aluminum tariffs reduced from 50% to 25%

✅ Potential energy supply cutoff remains leverage in negotiations


Ontario Premier Doug Ford's recent high-stakes diplomatic trip to Washington, D.C., underscores the delicate trade tensions between Canada and the United States, particularly concerning energy exports and Canada's electricity exports across the border. Ford's potential use of tariffs or even halting U.S. energy supplies, amid Ontario's energy independence considerations, remains a powerful leverage tool, one that could either de-escalate or intensify the ongoing trade conflict between the two neighboring nations.

The meeting in Washington follows a turbulent series of events that began with Ontario's imposition of a 25% surcharge on energy exports to the U.S. This move came in retaliation to what Ontario perceived as unfair treatment in trade agreements, a step that aligned with Canadian support for tariffs at the time. In response, U.S. President Donald Trump's administration threatened its own set of tariffs, specifically targeting Canadian steel and aluminum, which further escalated tensions. U.S. officials labeled Ford's threat to cut off U.S. electricity exports and energy supplies as "egregious and insulting," warning of significant economic retaliation.

However, shortly after these heated exchanges, Trump’s commerce secretary, Howard Lutnick, extended an invitation to Ford for a direct meeting at the White House. Ford described this gesture as an "olive branch," signaling a potential de-escalation of the dispute. In the lead-up to this diplomatic encounter, Ford agreed to pause the energy surcharge, allowing the meeting to proceed, amid concerns tariffs could spike NY energy prices, without further escalating the crisis. Trump's administration responded by lowering its proposed 50% tariff on Canadian steel and aluminum to a more manageable 25%.

The outcome of the meeting, which is set to address these critical issues, could have lasting implications for trade relations between Canada and the U.S. If Ford and Lutnick can reach an agreement, the potential for tariff imposition on energy exports, though experts advise against cutting Quebec's energy exports due to broader risks, could be resolved. However, if the talks fail, it is likely that both countries could face further retaliatory measures, compounding the economic strain on both sides.

As Canada and the U.S. continue to navigate these complex issues, where support for Canadian energy projects has risen, the outcome of Ford's meeting with Lutnick will be closely watched, as it could either defuse the tensions or set the stage for a prolonged trade battle.


Related News

View more

Sign Up for Electricity Forum’s Newsletter

Stay informed with our FREE Newsletter — get the latest news, breakthrough technologies, and expert insights, delivered straight to your inbox.

Electricity Today T&D Magazine Subscribe for FREE

Stay informed with the latest T&D policies and technologies.
  • Timely insights from industry experts
  • Practical solutions T&D engineers
  • Free access to every issue

Live Online & In-person Group Training

Advantages To Instructor-Led Training – Instructor-Led Course, Customized Training, Multiple Locations, Economical, CEU Credits, Course Discounts.

Request For Quotation

Whether you would prefer Live Online or In-Person instruction, our electrical training courses can be tailored to meet your company's specific requirements and delivered to your employees in one location or at various locations.