Panel to Review Toronto Hydro's Storm Response

By


Substation Relay Protection Training

Our customized live online or in‑person group training can be delivered to your staff at your location.

  • Live Online
  • 12 hours Instructor-led
  • Group Training Available
Regular Price:
$699
Coupon Price:
$599
Reserve Your Seat Today
Toronto Hydro-Electric System Limited recently announced that an expert panel will oversee a review of the utility's response to the ice storm that seriously damaged the electricity grid in neighbourhoods across Toronto on December 21 and 22, 2013.

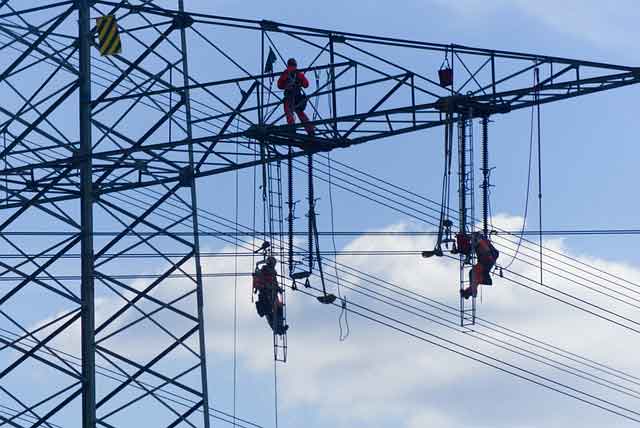
Ice build-up on trees, caused by freezing rain, resulted in tree limbs and branches pulling down power lines and causing electricity service interruption to approximately 300,000 Toronto Hydro customers at the height of the storm on December 22. Power was restored to approximately 75 per cent of customers within 48 hours, with the remaining customers brought back online in stages through New Year's Day.

Toronto Hydro will conduct its own post-mortem following the storm and will compile it with results from the independent audit. The panel will be chaired by David J. McFadden Q.C. who is recognized for his leadership in the energy sector and who has served on the Ontario Distribution Sector Review Panel, the U.S.-Canada Power System Outage Task Force that investigated the 2003 blackout, and his work on the deployment of smart grid technology in Ontario.

Mr McFadden was appointed to the Board of Governors for York University on February 25, 2013. He was also the Chair of the Board of Directors of the Ontario Centres of Excellence Inc. from 2004 to 2010. He is a partner in Gowling Lafleur Henderson LLP and Chair of Gowlings' International Management Committee.

Also serving on the panel is Sean Conway of Ryerson University's Centre for Urban Energy CUE. He joined CUE as a Distinguished Research Fellow in February 2012. Mr Conway is the former Chair of the Board of Directors of the Ontario Centres of Excellence OCE.

Joe Pennachetti, City Manager, will also sit on the Power Panel. Mr. Pennachetti is City Manager for the City of Toronto overseeing the delivery of more than 40 major services to a population of 2.7 million people. Mr Pennachetti is a certified general accountant and a member of the Certified General Accountants of Ontario and a fellow FCGA of the Certified General Accountants Association of Canada.

The panel will oversee a review of Toronto Hydro's storm response, including electricity grid design and emergency response urban forestry issues, and customer communications. The review will be conducted by Davies Consulting www.daviescon.com which is a leading energy industry consulting firm with expertise in emergency management.

Related News

Report: Solar ITC Extension Would Be ‘Devastating’ for US Wind Market

Solar ITC Impact on U.S. Wind frames how a 30% solar investment tax credit could undercut wind PTC economics, shift corporate procurement, and, without transmission and storage, slow onshore builds despite offshore wind momentum.


Key Points

It is how a solar ITC extension may curb U.S. wind growth absent PTC parity, transmission, storage, and offshore backing.

✅ ITC at 30% risks shifting corporate procurement to solar.

✅ Post-PTC wind faces grid, transmission, and curtailment headwinds.

✅ Offshore wind, storage pairing, TOU demand could offset.


The booming U.S. wind industry, amid a wind power surge, faces an uncertain future in the 2020s. Few factors are more important than the fate of the solar ITC.

An extension of the solar investment tax credit (ITC) at its 30 percent value would be “devastating” to the future U.S. wind market, according to a new Wood Mackenzie report.

The U.S. is on track to add a record 14.6 gigawatts of new wind capacity in 2020, despite Covid-19 impacts, and nearly 39 gigawatts during a three-year installation boom from 2019 to 2021, according to Wood Mackenzie’s 2019 North America Wind Power Outlook.

But the market’s trajectory begins to look highly uncertain from the early 2020s onward, and solar is one of the main reasons why.

Since the dawn of the modern American renewables market, the wind and solar sectors have largely been allies on the national stage, benefiting from many of the same favorable government plans and sharing big-picture goals. Until recently, wind and solar companies rarely found themselves in direct competition.

But the picture is changing as solar catches up to wind on cost and the grid penetration of renewables surges. What was once a vague alliance between the two fastest growing renewables technologies could morph into a serious rivalry.

While many project developers are now active in both sectors, including NextEra Energy Resources, Invenergy and EDF, the country’s thriving base of wind manufacturers could face tougher days ahead.


The ITC's inherent advantage

At this point, wind remains solar’s bigger sibling in many ways.

The U.S. has nearly 100 gigawatts of installed wind capacity today, compared to around 67 gigawatts of solar. With their substantially higher capacity factors, wind farms generated four times more power for the U.S. grid last year than utility-scale solar plants, for a combined wind-solar share of 8.2 percent, according to government figures, even as renewables are projected to reach one-fourth of U.S. electricity generation. (Distributed PV systems further add to solar’s contribution.)

But it's long been clear that wind would lose its edge at some point. The annual solar market now regularly tops wind. The cost of solar energy is falling more rapidly, and appears to have more runway for further reduction. Solar’s inherent generation pattern is more valuable in many markets, delivering power during peak-demand hours, while the wind often blows strongest at night.


And then there’s the matter of the solar ITC.

In 2015, both wind and solar secured historic multi-year extensions to their main federal subsidies. The extensions gave both industries the longest period of policy clarity they’ve ever enjoyed, setting in motion a tidal wave of installations set to crest over the next few years.

Even back in 2015, however, it was clear that solar got the better deal in Washington, D.C.

While the wind production tax credit (PTC) began phasing down for new projects almost immediately, solar developers were given until the end of 2019 to qualify projects for the full ITC.

And critically, while the wind PTC drops to nothing after its sunset, commercially owned solar projects will remain eligible for a 10 percent ITC forever, based on the existing legislation. Over time, that amounts to a huge advantage for solar.

In another twist, the solar industry is now openly fighting for an extension of the 30 percent ITC, while the wind industry seemingly remains cooler on the prospect of pushing for a similar prolongation — having said the current PTC extension would be the last.


Plenty of tailwinds, too

Wood Mackenzie's report catalogues multiple factors that could work for or against the wind market in the "uncharted" post-PTC years, many of them, including the Covid-19 crisis, beyond the industry’s direct control.

If things go well, annual installations could bounce back to near-record levels by 2027 after a mid-decade contraction, the report says. But if they go badly, installations could remain depressed at 4 gigawatts or below from 2022 through most of the coming decade, and that includes an anticipated uplift from the offshore market.

An extension of the solar ITC without additional wind support would “severely compound” the wind market’s struggle to rebound in the 2020s, the report says. The already-evident shift in corporate renewables procurement from wind to solar could intensify dramatically.

The other big challenge for wind in the 2020s is the lack of progress on transmission infrastructure that would connect potentially massive low-cost wind farms in interior states with bigger population centers. A hoped-for national infrastructure package that might address the issue has not materialized.

Even so, many in the wind business remain cautiously optimistic about the post-PTC years, with a wind jobs forecast bolstering sentiment, and developers continue to build out longer-term project pipelines.

Turbine technology continues to improve. And an extension of the solar ITC is far from assured.

Other factors that could work in wind’s favor in the years ahead include:

The nascent offshore sector, which despite lingering regulatory uncertainty at the federal level looks set to blossom into a multi-gigawatt annual market by the mid-2020s, in line with an offshore wind forecast that highlights substantial growth potential. Lobbying efforts for an offshore wind ITC extension are gearing up, offering a potential area for cooperation between wind and solar.

The potential linkage of policy support for energy storage to wind projects, building on the current linkage with solar.

Growing electric vehicle sales and a shift toward time-of-use retail electricity billing, which could boost power demand during off-peak hours when wind generation is strong.

The land-use advantages wind farms have over solar in some agricultural regions.


Related News

View more

Which of the cleaner states imports dirty electricity?

Hourly Electricity Emissions Tracking maps grid balancing areas, embodied emissions, and imports/exports, revealing carbon intensity shifts across PJM, ERCOT, and California ISO, and clarifying renewable energy versus coal impacts on health and climate.


Key Points

An hourly method tracing generation, flows, and embodied emissions to quantify carbon intensity across US balancing areas.

✅ Hourly traces of imports/exports and generation mix

✅ Consumption-based carbon intensity by balancing area

✅ Policy insights for renewables, coal, health costs


In the United States, electricity generation accounts for nearly 30% of our carbon emissions. Some states have responded to that by setting aggressive renewable energy standards; others are hoping to see coal propped up even as its economics get worse. Complicating matters further is the fact that many regional grids are integrated, and as America goes electric the stakes grow, meaning power generated in one location may be exported and used in a different state entirely.

Tracking these electricity exports is critical for understanding how to lower our national carbon emissions. In addition, power from a dirty source like coal has health and environment impacts where it's produced, and the costs of these aren't always paid by the parties using the electricity. Unfortunately, getting reliable figures on how electricity is produced and where it's used is challenging, even for consumers trying to find where their electricity comes from in the first place, leaving some of the best estimates with a time resolution of only a month.

Now, three Stanford researchers—Jacques A. de Chalendar, John Taggart, and Sally M. Benson—have greatly improved on that standard, and they have managed to track power generation and use on an hourly basis. The researchers found that, of the 66 grid balancing areas within the United States, only three have carbon emissions equivalent to our national average, and they have found that imports and exports of electricity have both seasonal and daily changes. de Chalendar et al. discovered that the net results can be substantial, with imported electricity increasing California's emissions/power by 20%.

Hour by hour
To figure out the US energy trading landscape, the researchers obtained 2016 data for grid features called balancing areas. The continental US has 66 of these, providing much better spatial resolution on the data than the larger grid subdivisions. This doesn't cover everything—several balancing areas in Canada and Mexico are tied in to the US grid—and some of these balancing areas are much larger than others. The PJM grid, serving Pennsylvania, New Jersey, and Maryland, for example, is more than twice as large as Texas' ERCOT, in a state that produces and consumes the most electricity in the US.

Despite these limitations, it's possible to get hourly figures on how much electricity was generated, what was used to produce it, and whether it was used locally or exported to another balancing area. Information on the generating sources allowed the researchers to attach an emissions figure to each unit of electricity produced. Coal, for example, produces double the emissions of natural gas, which in turn produces more than an order of magnitude more carbon dioxide than the manufacturing of solar, wind, or hydro facilities. These figures were turned into what the authors call "embodied emissions" that can be traced to where they're eventually used.

Similar figures were also generated for sulfur dioxide and nitrogen oxides. Released by the burning of fossil fuels, these can both influence the global climate and produce local health problems.

Huge variation
The results were striking. "The consumption-based carbon intensity of electricity varies by almost an order of magnitude across the different regions in the US electricity system," the authors conclude. The low is the Bonneville Power grid region, which is largely supplied by hydropower; it has typical emissions below 100kg of carbon dioxide per megawatt-hour. The highest emissions come in the Ohio Valley Electric region, where emissions clear 900kg/MW-hr. Only three regional grids match the overall grid emissions intensity, although that includes the very large PJM (where capacity auction payouts recently fell), ERCOT, and Southern Co balancing areas.

Most of the low-emissions power that's exported comes from the Pacific Northwest's abundant hydropower, while the Rocky Mountains area exports electricity with the highest associated emissions. That leads to some striking asymmetries. Local generation in the hydro-rich Idaho Power Company has embodied emissions of only 71kg/MW-hr, while its imports, coming primarily from Rocky Mountain states, have a carbon content of 625kg/MW-hr.

The reliance on hydropower also makes the asymmetry seasonal. Local generation is highest in the spring as snow melts, but imports become a larger source outside this time of year. As solar and wind can also have pronounced seasonal shifts, similar changes will likely be seen as these become larger contributors to many of these regional grids. Similar things occur daily, as both demand and solar production (and, to a lesser extent, wind) have distinct daily profiles.

The Golden State
California's CISO provides another instructive case. Imports represent less than 30% of its total electric use in 2016, yet California electricity imports provided 40% of its embodied emissions. Some of these, however, come internally from California, provided by the Los Angeles Department of Water and Power. The state itself, however, has only had limited tracking of imported emissions, lumping many of its sources as "other," and has been exporting its energy policies to Western states in ways that shape regional markets.

Overall, the 2016 inventory provides a narrow picture of the US grid, as plenty of trends are rapidly changing our country's emissions profile, including the rise of renewables and the widespread adoption of efficiency measures and other utility trends in 2017 that continue to evolve. The method developed here can, however, allow for annual updates, providing us with a much better picture of trends. That could be quite valuable to track things like how the rapid rise in solar power is altering the daily production of clean power.

More significantly, it provides a basis for more informed policymaking. States that wish to promote low-emissions power can use the information here to either alter the source of their imports or to encourage the sites where they're produced to adopt more renewable power. And those states that are exporting electricity produced primarily through fossil fuels could ensure that the locations where the power is used pay a price that includes the health costs of its production.


Related News

View more

Germany's Energy Crisis Deepens as Local Utilities Cry for Help

Germany energy liquidity crisis is straining municipal utilities as gas and power prices surge, margin calls rise, and Russian supply cuts bite, forcing state support, interventions, and emergency financing to stabilize households and businesses.


Key Points

A cash squeeze on German municipal utilities as soaring gas and power prices trigger margin calls and funding gaps.

✅ Margin calls and spot-market purchases strain cash flow

✅ State liquidity lines and EU collateral support proposed

✅ Gazprom cuts, Uniper distress heighten default risks


Germany’s fears that soaring power prices and gas prices could trigger a deeper crisis is starting to get real. 

Several hundred local utilities are coming under strain and need support, according to the head of Germany’s largest energy lobby group. The companies, generally owned by municipalities, supply households and small businesses directly and are a key part of the country’s power and gas network.

“The next step from the government and federal states must be to secure liquidity for these municipal companies,” Kerstin Andreae, chairwoman of the German Association of Energy and Water Industries, told Bloomberg in Berlin. “Prices are rising, and they have no more money to pay the suppliers. This is a big problem.”

Germany’s energy crunch intensified over the weekend after Russia’s Gazprom PJSC halted its key gas pipeline indefinitely, a stark wake-up call for policymakers to reduce fossil fuel dependence. European energy prices have surged again amid concerns over shortages this winter and fears of a worst-case energy scenario across the bloc. 

Many utilities are running into financial issues as they’re forced to cover missing Russian deliveries with expensive supplies on the spot market. German energy giant Uniper SE, which supplies local utilities, warned it will likely burn through a 7 billion-euro ($7 billion) government safety net and will need more help already this month.

Some German local utilities have already sought help, according to a government official, who asked not to be identified in line with briefing rules.  

With Europe’s largest economy already bracing for recession, Chancellor Olaf Scholz’s administration is battling on several fronts, testing the government’s financial capacity. The ruling coalition agreed Sunday on a relief plan worth about 65 billion euros -- part of an emerging energy shield package to contain the fallout of surging costs for households and businesses. 

Starting in October, local utilities will have to pay a levy for the gas acquired, which will further increase their financial burden, Andreae said.

Margin Calls
European gas prices are more than four times higher than usual for this time of year, underscoring why rolling back electricity prices is tougher than it appears for policymakers, as Russia cuts supplies in retaliation for sanctions related to its invasion of Ukraine. When prices peak, energy companies have to pay margin calls, extra collateral required to back their trades.

Read more: Energy Trade Risks Collapsing Over Margin Calls of $1.5 Trillion

The problem has hit local utilities in other countries as well. In Austria, the government approved a 2 billion-euro loan for Vienna’s municipal utility last month. 

The European Union is also planning help, floating gas price cap strategies among other tools. The bloc’s emergency measures will include support for electricity producers struggling to find enough cash to guarantee trades, according to European Commission President Ursula von der Leyen.

The situation has worsened in Germany as some of the country’s big gas importers are reluctant to sell more supplies to some of municipal companies amid fears they could default on payments, Andreae said. 


Related News

View more

B.C. residents and businesses get break on electricity bills for three months

BC Hydro COVID-19 Bill Relief offers pandemic support with bill credits, rate cuts, and deferred payments for residential, small business, and industrial customers across B.C., easing utilities costs during COVID-19 economic hardship.


Key Points

COVID-19 bill credits, a rate cut, and deferred payments for eligible B.C. homes, small businesses, and industrial customers.

✅ Non-repayable credits equal to 3 months of average bills.

✅ Small businesses closed can skip bills for three months.

✅ Large industry may defer 50% of electricity costs.


B.C. residents who have lost their jobs or had their wages cut will get a three-month break on BC Hydro bills, while small businesses, amid commercial consumption plummets during COVID-19, are also eligible to apply for similar relief.

Premier John Horgan said Wednesday the credit for residential customers will be three times a household’s average monthly bill over the past year and does not have to be repaid as part of the government’s support package during the COVID-19 pandemic, as BC Hydro demand down 10% highlights the wider market pressures.

He said small businesses that are closed will not have to pay their power bills for three months, and in Ontario an Ontario COVID-19 hydro rebate complemented similar relief, and large industrial customers, including those operating mines and pulp mills, can opt to have 50 per cent of their electricity costs deferred, though a deferred costs report warned of long-term liabilities.

BC Hydro rates will be cut for all customers by one per cent as of April 1, a move similar to Ontario 2021 rate reductions that manufacturers supported lower rates at the time, after the B.C. Utilities Commission provided interim approval of an application the utility submitted last August.

Eligible residential customers can apply for bill relief starting next week and small business applications will be accepted as of April 14, while staying alert to BC Hydro scam attempts during this period, with the deadline for both categories set at June 30.


Related News

View more

Transmission constraints impede incremental Quebec-to-US power deliveries

Hydro-Québec Northeast Clean Energy Transmission delivers surplus hydropower via HVDC interconnections to New York and New England, leveraging long-term contracts and projects like CHPE and NECEC to support carbon-free goals, GHG cuts, and grid reliability.


Key Points

An initiative to expand HVDC links for Quebec hydropower exports, aiding New York and New England decarbonization.

✅ 37,000 MW hydro capacity enables firm, low-carbon exports

✅ Targets NY and NE via CHPE, NECEC, and upgraded interfaces

✅ Backed by long-term PPAs to reduce merchant transmission risk


With roughly 37,000 MW of installed hydro power capacity, Quebec has ample spare capacity that it would like to deliver into Northeastern US markets where ambitious clean energy goals have been announced, but expanding transmission infrastructure is challenging.

Register Now New York recently announced a goal of receiving 100% carbon-free energy by 2040 and the New England states all have ambitious greenhouse gas reduction goals, including a Massachusetts law requiring GHG emissions be 80% below 1990 levels by 2050.

The province-owned company, Hydro Quebec, supplies power to the provinces of Quebec, Ontario and New Brunswick in particular, as well as sending electricity directly into New York and New England. The power transmission interconnections between New York and New England have reached capacity and in order to increase export volumes into the US, "we need to build more transmission infrastructure," Gary Sutherland, relationship manager in business development, recently said during a presentation to reporters in Montreal.


TRANSMISSION OPTIONS

Hydro Quebec is working with US transmission developers, electric distribution companies, independent system operators and state government agencies to expand that transmission capacity in order to delivery more power from its hydro system to the US, as the province has closed the door on nuclear power and continues to prioritize hydropower, Sutherland said.

The company is looking to sign long-term power supply contracts that could help alleviate some of the investment risk associated with these large infrastructure projects.

"It`s interesting to recall that in the 1980s, two decade-long contracts paved the way for construction of Phase II of the multi-terminal direct-current system (MTDCS), a cross-border line that delivers up to 2,000 MW from northern Quebec to New England," Hydro Quebec spokeswoman Lynn St-Laurent said in an email.

Long-term prices have been persistently low since 2012, following the shale gas boom and the economic decline in 2008-2009, St-Laurent said. "As such, investment risks are too high for merchant transmission projects," she said.

Northeast power market fundamentals "remain strong for long-term contracts," on transmission projects or equipment upgrades that can deliver clean power from Quebec and "help our neighbors reach their ambitious clean energy goals," St-Laurent said.


NEW ENGLAND

In March 2017 an HQ proposal was selected by Massachusetts regulators to supply 9.45 TWh of firm energy to be delivered for 20 years. HQ`s proposal consisted of hydro power supply and possible transmission scenarios developed in conjunction with US partners.

The two leading options include a route through New Hampshire called Northern Pass and New England Clean Energy Connect through Maine.

The New Hampshire Site Evaluation Committee in March 2018 voted unanimously to deny approval of the $1.6 billion Northern Pass Transmission project, which is a joint venture between HQ and Eversource Energy`s transmission business. Eversource has been fighting the decision, with the New Hampshire Supreme Court accepting the company`s appeal of the NHSEC decision in October.

Briefs are being filed and oral arguments are likely to begin late spring or early summer, spokesman William Hinkle said in an email Tuesday.

After the Northern Pass permitting delay, Massachusetts chose the New England Clean Energy Connect project, which is a projected 1,200 MW transmission line, with 1,090 MW contracted to Massachusetts, leaving 110 MW for use on a merchant basis, according to St-Laurent.

NECEC is a joint venture between HQ and Central Maine Power, which is a subsidiary of Avangrid, a company affiliated with Spain`s Iberdrola. The NECEC project has received opposition from some environmental groups and still needs several state and federal permits.


NEW YORK

"The 5% of New York`s load that we furnish year in and year out ... is mostly going into the north of the state, it`s not coming down here," Sutherland said during a discussion at Pace University in New York City in 2017.

One potential project moving through the permitting phase, is the $2.2 billion, 1,000-MW Champlain Hudson Power Express transmission line being pursued by Transmission Developers -- a Blackstone portfolio company -- that would transport power from Quebec to Queens, New York.

Under New York`s proposed Climate Leadership Act which calls for the 100% carbon-free energy goal, renewable generation eligibility would be determined by the Public Service Commission. The PSC did not respond to a question about whether hydro power from Quebec is being considered as a potential option for meeting the state`s clean energy goal.


Related News

View more

Vancouver's Reversal on Gas Appliances

Vancouver Natural Gas Ban Reversal spotlights energy policy, electrification tradeoffs, heat pumps, emissions, grid reliability, and affordability, reshaping building codes and decarbonization pathways while inviting stakeholders to weigh practical constraints and climate goals.


Key Points

Vancouver ending its ban on natural gas in new homes to balance climate goals with reliability, costs, and technology.

✅ Balances emissions goals with reliability and affordability

✅ Impacts builders, homeowners, and energy infrastructure

✅ Spurs debate on electrification, heat pumps, and grid capacity


In a significant policy shift, Vancouver has decided to lift its ban on natural gas appliances in new homes, a move that marks a pivotal moment in the city's energy policy and environmental strategy. This decision, announced recently and following the city's Clean Energy Champion recognition for Bloedel upgrades, has sparked a broader conversation about the future of energy systems and the balance between environmental goals and practical energy needs. Stewart Muir, CEO of Resource Works, argues that this reversal should catalyze a necessary dialogue on energy choices, highlighting both the benefits and challenges of such a policy change.

Vancouver's original ban on natural gas appliances was part of a broader initiative aimed at reducing greenhouse gas emissions and promoting sustainability, including progress toward phasing out fossil fuels where feasible over time. The city had adopted stringent regulations to encourage the use of electric heat pumps and other low-carbon technologies in new residential buildings. This move was aligned with Vancouver’s ambitious climate goals, which include achieving carbon neutrality by 2050 and significantly cutting down on fossil fuel use.

However, the recent decision to reverse the ban reflects a growing recognition of the complexities involved in transitioning to entirely new energy systems. The city's administration acknowledged that while electric alternatives offer environmental benefits, they also come with challenges that can affect homeowners, builders, and the broader energy infrastructure, including options for bridging the electricity gap with Alberta to enhance regional reliability.

Stewart Muir argues that Vancouver’s policy shift is not just about natural gas appliances but represents a larger conversation about energy system choices and their implications. He suggests that the reversal of the ban provides an opportunity to address key issues related to energy reliability, affordability, and the practicalities of integrating new technologies, including electrified LNG options for industry within the province into existing systems.

One of the primary reasons behind the reversal is the recognition of the practical limitations and costs associated with transitioning to electric-only systems. For many homeowners and builders, natural gas appliances have long been a reliable and cost-effective option. The initial ban on these appliances led to concerns about increased construction costs and potential disruptions for homeowners who were accustomed to natural gas heating and cooking.

In addition to cost considerations, there are concerns about the reliability and efficiency of electric alternatives. Natural gas has been praised for its stable energy supply and efficient performance, especially in colder climates where electric heating systems might struggle to maintain consistent temperatures or fully utilize Site C's electricity under peak demand. By reversing the ban, Vancouver acknowledges that a one-size-fits-all approach may not be suitable for every situation, particularly when considering diverse housing needs and energy demands.

Muir emphasizes that the reversal of the ban should prompt a broader discussion about how to balance environmental goals with practical energy needs. He argues that rather than enforcing a blanket ban on specific technologies, it is crucial to explore a range of solutions that can effectively address climate objectives while accommodating the diverse requirements of different communities and households.

The debate also touches on the role of technological innovation in achieving sustainability goals. As energy technologies continue to evolve, renewable electricity is coming on strong and new solutions and advancements could potentially offer more efficient and environmentally friendly alternatives. The conversation should include exploring these innovations and considering how they can be integrated into existing energy systems to support long-term sustainability.

Moreover, Muir advocates for a more inclusive approach to energy policy that involves engaging various stakeholders, including residents, businesses, and energy experts. A collaborative approach can help identify practical solutions that address both environmental concerns and the realities of everyday energy use.

In the broader context, Vancouver’s decision reflects a growing trend in cities and regions grappling with energy transitions. Many urban centers are evaluating their energy policies and considering adjustments based on new information and emerging technologies. The key is to find a balance that supports climate goals such as 2050 greenhouse gas targets while ensuring that energy systems remain reliable, affordable, and adaptable to changing needs.

As Vancouver moves forward with its revised policy, it will be important to monitor the outcomes and assess the impacts on both the environment and the community. The reversal of the natural gas ban could serve as a case study for other cities facing similar challenges and could provide valuable insights into how to navigate the complexities of energy transitions.

In conclusion, Vancouver’s decision to reverse its ban on natural gas appliances in new homes is a significant development that opens the door for a critical dialogue about energy system choices. Stewart Muir’s call for a broader conversation emphasizes the need to balance environmental ambitions with practical considerations, such as cost, reliability, and technological advancements. As cities continue to navigate their energy futures, finding a pragmatic and inclusive approach will be essential in achieving both sustainability and functionality in energy systems.


Related News

View more

Sign Up for Electricity Forum’s Newsletter

Stay informed with our FREE Newsletter — get the latest news, breakthrough technologies, and expert insights, delivered straight to your inbox.

Electricity Today T&D Magazine Subscribe for FREE

Stay informed with the latest T&D policies and technologies.
  • Timely insights from industry experts
  • Practical solutions T&D engineers
  • Free access to every issue

Download the 2025 Electrical Training Catalog

Explore 50+ live, expert-led electrical training courses –

  • Interactive
  • Flexible
  • CEU-cerified