Exelon seeks carbon output cuts

By Reuters


NFPA 70b Training - Electrical Maintenance

Our customized live online or in‑person group training can be delivered to your staff at your location.

  • Live Online
  • 12 hours Instructor-led
  • Group Training Available
Regular Price:
$599
Coupon Price:
$499
Reserve Your Seat Today
Exelon Corp, the largest U.S. nuclear power operator, said it would seek to slash carbon output from its own operations and those of its customers by 15 million metric tons per year by 2020.

The plan seeks to reduce or offset emissions of the carbon dioxide gas blamed for contributing to global warming by the equivalent of removing 3 million cars from the roads, the company said.

Nuclear power plant operators have long supported efforts to trim carbon dioxide emissions because their power plants emit virtually none of the greenhouse gas, in contrast to coal-fired power plants which are among the nation's top emitters of carbon.

Related News

Bomb Cyclone Leaves Half a Million Without Power in Western Washington

Western Washington Bomb Cyclone unleashed gale-force winds, torrential rain, and coastal flooding, causing massive power outages from Seattle to Tacoma; storm surge, downed trees, and blocked roads hindered emergency response and infrastructure repairs.


Key Points

A rapidly deepening storm with severe winds, rain, flooding, and major power outages across Western Washington.

✅ Rapid barometric pressure drop intensified the system

✅ Gale-force winds downed trees and power lines

✅ Coastal flooding and storm surge disrupted transport


A powerful "bomb cyclone" recently hit Western Washington, causing widespread destruction across the region. The intense storm left more than half a million residents without power, similar to B.C. bomb cyclone outages seen to the north, with outages affecting communities from Seattle to Olympia. This weather phenomenon, marked by a rapid drop in atmospheric pressure, unleashed severe wind gusts, heavy rain, and flooding, causing significant disruption to daily life.

The bomb cyclone, which is a rapidly intensifying storm, typically features a sharp drop in barometric pressure over a short period of time. This creates extreme weather conditions, including gale-force winds, torrential rain, and coastal flooding, as seen during California storm impacts earlier in the season. In Western Washington, the storm struck just as the region was beginning to prepare for the winter season, catching many off guard with its strength and unpredictability.

The storm's impact was immediately felt as high winds downed trees, power lines, and other infrastructure. By the time the worst of the storm had passed, utility companies had reported widespread power outages, with more than 500,000 customers losing electricity. The outages were particularly severe in areas like Seattle, Tacoma, and the surrounding communities. Crews worked tirelessly in difficult conditions to restore power, but many residents faced extended outages, underscoring US grid climate vulnerabilities that complicate recovery efforts, with some lasting for days due to the scope of the damage.

The power outages were accompanied by heavy rainfall, leading to localized flooding. Roads were inundated, making it difficult for first responders and repair crews to reach affected areas. Emergency services were stretched thin as they dealt with downed trees, blocked roads, and flooded neighborhoods. In some areas, floodwaters reached homes, forcing people to evacuate. In addition, several schools were closed, and public transportation services were temporarily halted, leaving commuters stranded and businesses unable to operate.

As the storm moved inland, its effects continued to be felt. Western Washington’s coastal regions were hammered by high waves and storm surges, further exacerbating the damage. The combination of wind and rain also led to hazardous driving conditions, prompting authorities to advise people to stay off the roads unless absolutely necessary.

While power companies worked around the clock to restore electricity, informed by grid resilience strategies that could help utilities prepare for future events, challenges persisted. Fallen trees and debris blocked access to repair sites, and the sheer number of outages made it difficult for crews to restore power quickly. Some customers were left in the dark for days, forced to rely on generators, candles, and other makeshift solutions. The storm's intensity left a trail of destruction, requiring significant resources to address the damages and rebuild critical infrastructure.

In addition to the immediate impacts on power and transportation, the bomb cyclone raised important concerns about climate change and the increasing frequency of extreme weather events. Experts note that storms like these are becoming more common, with rapid intensification leading to more severe consequences and compounding pressures such as extreme-heat electricity costs for households. As the planet warms, scientists predict that such weather systems will continue to grow in strength, posing greater challenges to cities and regions that are not always prepared for such extreme events.

In the aftermath of the storm, local governments and utility companies faced the daunting task of not only restoring services but also assessing the broader impact of the storm on communities. Many areas, especially those hit hardest by flooding and power outages, will require substantial recovery efforts. The devastation of the bomb cyclone highlighted the vulnerability of infrastructure in the face of rapidly changing weather patterns and water availability, as seen in BC Hydro drought adaptations nearby, and reinforced the need for greater resilience in the face of future storms.

The storm's impact on the Pacific Northwest is a reminder of the power of nature and the importance of preparedness. As Western Washington recovers, there is a renewed focus on strengthening infrastructure, including expanded renewable electricity to diversify supply, improving emergency response systems, and ensuring that communities are better equipped to handle the challenges posed by increasingly severe weather events. For now, residents remain hopeful that the worst is behind them and are working together to rebuild and prepare for whatever future storms may bring.

The bomb cyclone has left an indelible mark on Western Washington, but it also serves as a call to action for better preparedness, more robust infrastructure, and a greater focus on combating climate change to mitigate the impact of such extreme weather in the future.


Related News

View more

Electricity Grids Can Handle Electric Vehicles Easily - They Just Need Proper Management

EV Grid Capacity Management shows how smart charging, load balancing, and off-peak pricing align with utility demand response, DC fast charging networks, and renewable integration to keep national electricity infrastructure reliable as EV adoption scales


Key Points

EV Grid Capacity Management schedules charging and balances load to keep EV demand within utility capacity.

✅ Off-peak pricing and time-of-use tariffs shift charging demand.

✅ Smart chargers enable demand response and local load balancing.

✅ Gradual EV adoption allows utilities to plan upgrades efficiently.


One of the most frequent concerns you will see from electric vehicle haters is that the electricity grid can’t possibly cope with all cars becoming EVs, or that EVs will crash the grid entirely. However, they haven’t done the math properly. The grids in most developed nations will be just fine, so long as the demand is properly management. Here’s how.

The biggest mistake the social media keyboard warriors make is the very strange assumption that all cars could be charging at once. In the UK, there are currently 32,697,408 cars according to the UK Department of Transport. The UK national grid had a capacity of 75.8GW in 2020. If all the cars in the UK were EVs and charging at the same time at 7kW (the typical home charger rate), they would need 229GW – three times the UK grid capacity. If they were all charging at 50kW (a common public DC charger rate), they would need 1.6TW – 21.5 times the UK grid capacity. That sounds unworkable, and this is usually the kind of thinking behind those who claim the UK grid can't cope with EVs.

What they don’t seem to realize is that the chances of every single car charging all at once are infinitesimally low. Their arguments seem to assume that nobody ever drives their car, and just charges it all the time. If you look at averages, the absurdity of this position becomes particularly clear. The distance each UK car travels per year has been slowly dropping, and was 7,400 miles on average in 2019, again according to the UK Department of Transport. An EV will do somewhere between 2.5 and 4.5 miles per kWh on average, so let’s go in the middle and say 3.5 miles. In other words, each car will consume an average of 2,114kWh per year. Multiply that by the number of cars, and you get 69.1TWh. But the UK national grid produced 323TWh of power in 2019, so that is only 21.4% of the energy it produced for the year. Before you argue that’s still a problem, the UK grid produced 402TWh in 2005, which is more than the 2019 figure plus charging all the EVs in the UK put together. The capacity is there, and energy storage can help manage EV-driven peaks as well.

Let’s do the same calculation for the USA, where an EV boom is about to begin and planning matters. In 2020, there were 286.9 million cars registered in America. In 2020, while the US grid had 1,117.5TW of utility electricity capacity and 27.7GW of solar, according to the US Energy Information Administration. If all the cars were EVs charging at 7kW, they would need 2,008.3TW – nearly twice the grid capacity. If they charged at 50kW, they would need 14,345TW – 12.8 times the capacity.

However, in 2020, the US grid generated 4,007TWh of electricity. Americans drive further on average than Brits – 13,500 miles per year, according to the US Department of Transport’s Federal Highway Administration. That means an American car, if it were an EV, would need 3,857kWh per year, assuming the average efficiency figures above. If all US cars were EVs, they would need a total of 1,106.6TWh, which is 27.6% of what the American grid produced in 2020. US electricity consumption hasn’t shrunk in the same way since 2005 as it has in the UK, but it is clearly not unfeasible for all American cars to be EVs. The US grid could cope too, even as state power grids face challenges during the transition.

After all, the transition to electric isn’t going to happen overnight. The sales of EVs are growing fast, with for example more plug-ins sold in the UK in 2021 so far than the whole of the previous decade (2010-19) put together. Battery-electric vehicles are closing in on 10% of the market in the UK, and they were already 77.5% of new cars sold in Norway in September 2021. But that is new cars, leaving the vast majority of cars on the road fossil fuel powered. A gradual introduction is essential, too, because an overnight switchover would require a massive ramp up in charge point installation, particularly devices for people who don’t have the luxury of home charging. This will require considerable investment, but could be served by lots of chargers on street lamps, which allegedly only cost £1,000 ($1,300) each to install, usually with no need for extra wiring.

This would be a perfectly viable way to provide charging for most people. For example, as I write this article, my own EV is attached to a lamppost down the street from my house. It is receiving 5.5kW costing 24p (32 cents) per kWh through SimpleSocket, a service run by Ubitricity (now owned by Shell) and installed by my local London council, Barnet. I plugged in at 11am and by 7.30pm, my car (which was on about 28% when I started) will have around 275 miles of range – enough for a couple more weeks. It will have cost me around £12 ($16) – way less than a tank of fossil fuel. It was a super-easy process involving the scanning of a QR code and entering of a credit card, very similar to many parking systems nowadays. If most lampposts had one of these charging plugs, not having off-street parking would be no problem at all for owning an EV.

With most EVs having a range of at least 200 miles these days, and the average mileage per day being 20 miles in the UK (the 7,400-mile annual figure divided by 365 days) or 37 miles in the USA, EVs won’t need charging more than once a week or even every week or two. On average, therefore, the grids in most developed nations will be fine. The important consideration is to balance the load, because if too many EVs are charging at once, there could be a problem, and some regions like California are looking to EVs for grid stability as part of the solution. This will be a matter of incentivizing charging during off-peak times such as at night, or making peak charging more expensive. It might also be necessary to have the option to reduce charging power rates locally, while providing the ability to prioritize where necessary – such as emergency services workers. But the problem is one of logistics, not impossibility.

There will be grids around the world that are not in such a good place for an EV revolution, at least not yet, and some critics argue that policies like Canada's 2035 EV mandate are unrealistic. But to argue that widespread EV adoption will be an insurmountable catastrophe for electricity supply in developed nations is just plain wrong. So long as the supply is managed correctly to make use of spare capacity when it’s available as much as possible, the grids will cope just fine.


Related News

View more

EIA: Pennsylvania exports the most electricity, California imports the most from other states

U.S. Electricity Trade by State, 2013-2017 highlights EIA grid patterns, interstate imports and exports, cross-border flows with Canada and Mexico, net exporters and importers, and market regions like ISOs and RTOs shaping consumption and generation.


Key Points

Brief EIA overview of interstate and cross-border power flows, ranking top net importers and exporters.

✅ Pennsylvania was the largest net exporter, averaging 59 million MWh.

✅ California was the largest net importer, averaging 77 million MWh.

✅ Top cross-border: NY, CA, VT, MN, MI imports; WA, TX, CA, NY, MT exports.


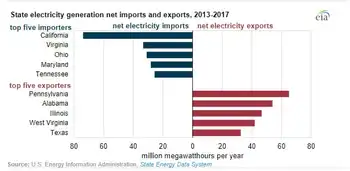
According to the U.S. Energy Information Administration (EIA) State Electricity Profiles, from 2013 to 2017, Pennsylvania was the largest net exporter of electricity, while California was the largest net importer.

Pennsylvania exported an annual average of 59 million megawatt-hours (MWh), while California imported an average of 77 million MWh annually.

Based on the share of total consumption in each state, the District of Columbia, Maryland, Massachusetts, Idaho and Delaware were the five largest power-importing states between 2013 and 2017, highlighting how some clean states import 'dirty' electricity as consumption outpaces local generation. Wyoming, West Virginia, North Dakota, Montana and New Hampshire were the five largest power-exporting states. Wyoming and West Virginia were net power exporting states between 2013 and 2017.

New York, California, Vermont, Minnesota and Michigan imported the most electricity from Canada or Mexico on average from 2013 to 2017, reflecting the U.S. look to Canada for green power during that period. Similarly, Washington, Texas, California, New York, and Montana exported the most electricity to Canada or Mexico, on average, during the same period.

Electricity routinely flows among the Lower 48 states and, to a lesser extent, between the United States and Canada and Mexico. From 2013 to 2017, Pennsylvania was the largest net exporter of electricity, sending an annual average of 59 million megawatthours (MWh) outside the state. California was the largest net importer, receiving an average of 77 million MWh annually.

Based on the share of total consumption within each state, the District of Columbia, Maryland, Massachusetts, Idaho, and Delaware were the five largest power-importing states between 2013 and 2017. Wyoming, West Virginia, North Dakota, Montana, and New Hampshire were the five largest power-exporting states. States with major population centers and relatively less generating capacity within their state boundaries tend to have higher ratios of net electricity imports to total electricity consumption, as utilities devote more to electricity delivery than to power production in many markets.

Wyoming and West Virginia were net power exporting states (they exported more power to other states than they consumed) between 2013 and 2017. Customers residing in these two states are not necessarily at an economic disadvantage or advantage compared with customers in neighboring states when considering their electricity bills and fees and market dynamics. However, large amounts of power trading may affect a state’s revenue derived from power generation.

Some states also import and export electricity outside the United States to Canada or Mexico, even as Canada's electricity exports face trade tensions today. New York, California, Vermont, Minnesota, and Michigan are the five states that imported the most electricity from Canada or Mexico on average from 2013 through 2017. Similarly, Washington, Texas (where electricity production and consumption lead the nation), California, New York, and Montana are the five states that exported the most electricity to Canada or Mexico, on average, for the same period.

Many states within the continental United States fall within integrated market regions, referred to as independent system operators or regional transmission organizations. These integrated market regions allow electricity to flow freely between states or parts of states within their boundaries.

EIA’s State Electricity Profiles provide details about the supply and disposition of electricity for each state, including net trade with other states and international imports and exports, and help you understand where your electricity comes from more clearly.


Related News

View more

Canada expected to miss its 2035 clean electricity goals

Canada 2035 Clean Electricity Target faces a 48.4GW shortfall as renewable capacity lags; accelerating wind, solar PV, grid upgrades, and coherent federal-provincial policy is vital to reach zero-emissions power and strengthen transmission and distribution.


Key Points

Canada's plan to supply nearly 100% of electricity from zero-emitting sources by 2035, requiring renewable buildout.

✅ Average adds 2.6GW; shortfall totals 48.4GW by 2035

✅ Expand wind, solar PV, storage, and grid modernization

✅ Align federal-province policy; retire or convert thermal plants


GlobalData’s latest report, ‘Canada Power Market Size and Trends by Installed Capacity, Generation, Transmission, Distribution and Technology, Regulations, Key Players and Forecast, 2022-2035’, discusses the power market structure of Canada and, amid looming power challenges, provides historical and forecast numbers for capacity, generation and consumption up to 2035. Detailed analysis of the country’s power market regulatory structure, competitive landscape and a list of major power plants are provided. The report also gives a snapshot of the power sector in the country on broad parameters of macroeconomics, supply security, generation infrastructure, transmission and distribution infrastructure, electricity import and export scenario, degree of competition, regulatory scenario, and future potential. An analysis of the deals in the country’s power sector is also included in the report.

Canada is expected to fall short of its 2035 clean electricity target after reviewing the country’s current renewable capacity activity. The country has targeted to produce nearly 100% of its electricity from zero-emitting sources by 2035, while electricity associations' net-zero goals extend to 2050; however, the country is adding only 2.6GW of annual renewable capacity additions on average every year, which would mean a cumulative shortfall of 48.4GW.

Canada has good governmental support, but it is not doing enough to ensure its targets are met. If the country is to meet its target to produce nearly 100% of electricity from zero-emitting sources by 2035, the country should both increase the capacity and efficiency of renewable power plants, as well as provide comprehensive end-to-end policies at both the federal and provincial levels, as debates over whether Ontario is embracing clean power continue across provinces. It should also involve communities and businesses in raising awareness of the benefits of adopting renewable energy.

The country has a large amount of proven natural gas and oil reserves that are proving too tempting an opportunity, and the Canadian Government is planning to increase the capacity of its gas-based plants under net-zero regulations permit some gas in the power mix, to secure real-time demand and supply. However, the country’s dependency on gas-based plants creates a major challenge to achieve its 2035 clean electricity target.

If the Canadian Government is to meet its 2035 targets, it should draw on examples from its European counterparts and add renewable capacity at a rapid pace, while balancing demand and emissions in key provinces. One advantage for Canada here is that it does not have land constraints, which is common in other major renewable power-generating countries. This could give the country an estimated 6.1GW of renewable capacity every year on average during the 2021-2035 period: enough capacity to meet its target. Most of these installations are expected to be for wind and solar PV.

Changing provincial governments are not helpful when it comes to implementing long-term projects, especially as Ontario faces looming electricity shortfalls that heighten planning risks, and continued stopping and starting of projects like this will only be damaging to renewable goals. Another way the country can achieve its target is by converting thermal power plants into clean energy plants and providing a roadmap or timeline for provinces to retire thermal power plants completely, even as scrapping coal can be costly for some systems.

Canada’s GDP (at constant prices) increased from $1,617.3bn in 2010 to $1,924.5bn in 2021, at a CAGR of 1.6%. The GDP (at constant prices) of the country declined sharply from $1,943.8bn in 2019 to $1,840.5bn in 2020 because of Covid-19 pandemic. After the recommencement of regular industrial and trade activities, the GDP grew by 4.6% in 2021 from 2020. The GDP is expected to cross pre-pandemic levels by the end of 2022.


Related News

View more

Sierra Club: Governor Abbott's Demands Would Leave Texas More Polluted and Texans in the Dark

Texas Energy Policy Debate centers on ERCOT and PUC directives, fossil fuels vs renewables, grid reliability, energy efficiency, battery storage, and blackout risks, shaping Texas power market rules, conservation alerts, and capacity planning.


Key Points

Policy fight over ERCOT/PUC rules weighing fossil fuels vs renewables and storage to bolster Texas grid reliability.

✅ ERCOT and PUC directives under political scrutiny

✅ Fossil fuel subsidies vs renewable incentives and storage

✅ Focus on grid reliability, efficiency, and blackout prevention


Earlier this week, Governor Abbott released a letter to the Public Utility Commission of Texas (PUC) and the Electric Reliability Council of Texas (ERCOT), demanding electricity market reforms that Abbott falsely claims will "increase power generation capacity and to ensure the reliability of the Texas power grid."

Unfortunately, Abbott's letter promotes polluting, unreliable fossil fuels, attacks safer clean energy options, and ignores solutions that would actually benefit everyday Texans.

"Governor Abbott, in a blatant effort to politicize Texans' energy security, wants to double down on fossil fuels, even though they were the single largest point of failure during both February's blackouts and June's energy conservation alerts," said Cyrus Reed, Interim Director & Conservation Director of the Lone Star Chapter of the Sierra Club.

"Many of these so-called solutions were considered and rejected most recently by the Texas Legislature. Texas must focus on expanding clean and reliable renewable energy, energy efficiency, and storage capacity, as voters consider funding to modernize generation in the months ahead.

"We can little afford to repeat the same mistakes that have failed to provide enough electricity where it is needed most and cost Texans billions of dollars. Instead of advocating for evidence-based solutions, Abbott wants to be a culture warrior for coal and gas, even as he touts grid readiness amid election season, even when it results in blackouts across Texas."


Related News

View more

Surging electricity demand is putting power systems under strain around the world

Global Electricity Demand Surge strains power markets, fuels price volatility, and boosts coal and gas generation as renewables lag, driving emissions, according to the IEA, with grids and clean energy investment crucial through 2024.


Key Points

A surge in power use that strained supply, raised prices, and drove power-sector CO2 emissions to record highs.

✅ 6% demand growth in 2021; largest absolute rise ever

✅ Coal up 9%; gas +2%; renewables +6% could not meet demand

✅ Prices doubled vs 2020; volatility hit EU, China, India


Global electricity demand surged above pre-pandemic levels in 2021, creating strains in major markets, pushing prices to unprecedented levels and driving the power sector’s emissions to a record high. Electricity is central to modern life and clean electricity is pivotal to energy transitions, but in the absence of faster structural change in the sector, rising demand over the next three years could result in additional market volatility and continued high emissions, according an IEA report released today.

Driven by the rapid economic rebound, and more extreme weather conditions than in 2020, including a colder than average winter, last year’s 6% rise in global electricity demand was the largest in percentage terms since 2010 when the world was recovering from the global financial crisis. In absolute terms, last year’s increase of over 1 500 terawatt-hours was the largest ever, according to the January 2022 edition of the IEA’s semi-annual Electricity Market Report.

The steep increase in demand outstripped the ability of sources of electricity supply to keep pace in some major markets, with shortages of natural gas and coal leading to volatile prices, demand destruction and negative effects on power generators, retailers and end users, notably in China, Europe and India. Around half of last year’s global growth in electricity demand took place in China, where demand grew by an estimated 10%, highlighting that Asia is set to use half of global electricity by 2025 according to the IEA. China and India suffered from power cuts at certain points in the second half of the year because of coal shortages.

“Sharp spikes in electricity prices in recent times have been causing hardship for many households and businesses around the world and risk becoming a driver of social and political tensions,” said IEA Executive Director Fatih Birol. “Policy makers should be taking action now to soften the impacts on the most vulnerable and to address the underlying causes. Higher investment in low-carbon energy technologies including renewables, energy efficiency and nuclear power – alongside an expansion of robust and smart electricity grids – can help us get out of today’s difficulties.”

The IEA’s price index for major wholesale electricity markets almost doubled compared with 2020 and was up 64% from the 2016-2020 average. In Europe, average wholesale electricity prices in the fourth quarter of 2021 were more than four times their 2015-2020 average, and wind and solar generated more electricity than gas in the EU during the year.  Besides Europe, there were also sharp price increases in Japan and India, while they were more moderate in the United States where gas supplies were less perturbed.

Electricity produced from renewable sources grew by 6% in 2021, but it was not enough to keep up with galloping demand. Coal-fired generation grew by 9%, with soaring electricity and coal use serving more than half of the increase in demand and reaching a new all-time peak as high natural gas prices led to gas-to-coal switching. Gas-fired generation grew by 2%, while nuclear increased by 3.5%, almost reaching its 2019 levels. In total, carbon dioxide (CO2) emissions from power generation rose by 7%, also reaching a record high, after having declined the two previous years.

“Emissions from electricity need to decline by 55% by 2030 to meet our Net Zero Emissions by 2050 Scenario, but in the absence of major policy action from governments, those emissions are set to remain around the same level for the next three years,” said Dr Birol. “Not only does this highlight how far off track we currently are from a pathway to net zero emissions by 2050, but it also underscores the massive changes needed for the electricity sector to fulfil its critical role in decarbonising the broader energy system.”

For 2022-2024, the report anticipates electricity demand growing 2.7% a year on average, although the Covid-19 pandemic and high energy prices bring some uncertainty to this outlook. Renewables are set to grow by 8% per year on average, and low-emissions sources are expected to serve more than 90% of net demand growth during this period. We expect nuclear-based generation to grow by 1% annually during the same period.

As a consequence of slowing electricity demand growth and significant renewables additions, fossil fuel-based generation is expected to stagnate in the coming years, and renewables are set to surpass coal by 2025 with coal-fired generation falling slightly as phase-outs and declining competitiveness in the United States and Europe are balanced by growth in markets like China, where electricity demand trends remain a puzzle in recent analyses, and India. Gas-fired generation is seen growing by around 1% a year.


Related News

View more

Sign Up for Electricity Forum’s Newsletter

Stay informed with our FREE Newsletter — get the latest news, breakthrough technologies, and expert insights, delivered straight to your inbox.

Electricity Today T&D Magazine Subscribe for FREE

Stay informed with the latest T&D policies and technologies.
  • Timely insights from industry experts
  • Practical solutions T&D engineers
  • Free access to every issue

Download the 2025 Electrical Training Catalog

Explore 50+ live, expert-led electrical training courses –

  • Interactive
  • Flexible
  • CEU-cerified