Smart Grid Modernization unites distributed energy resources, energy storage, EV charging, advanced metering, and bidirectional power flows to upgrade transmission and distribution infrastructure for reliability, resilience, cybersecurity, and affordable, clean power.
Key Points
Upgrading grid hardware and software to integrate DERs, storage, and EVs for a reliable and affordable power system.
✅ Enables DER, storage, and EV integration with bidirectional flows
✅ Improves reliability, resilience, and grid cybersecurity
✅ Requires early investment in sensors, inverters, and analytics
Much has been written, predicted, and debated in recent years about the future of the electricity system. The discussion isn’t simply about fossil fuels versus renewables, as often dominates mainstream energy discourse. Rather, the discussion is focused on something much larger and more fundamental: the very design of how and where electricity should be generated, delivered, and consumed.
Central to this discussion are arguments in support of, or in opposition to, the traditional model versus that of the decentralized or “emerging” model. But this is a false choice. The only choice that needs making is how to best transition to a smarter grid, and do so in a reliable and affordable manner that reflects grid modernization affordability concerns for utilities today. And the most effective and immediate means to accomplish that is to encourage and facilitate early investment in grid-related infrastructure and technology.
The traditional, or centralized, model has evolved since the days of Thomas Edison, but the basic structure is relatively unchanged: generate electrons at a central power plant, transmit them over a unidirectional system of high-voltage transmission lines, and deliver them to consumers through local distribution networks. The decentralized, or emerging, model envisions a system that moves away from the central power station as the primary provider of electricity to a system in which distributed energy resources, energy storage, electric vehicles, peer-to-peer transactions, connected appliances and devices, and sophisticated energy usage, pricing, and load management software play a more prominent role.
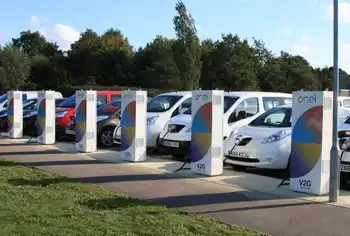
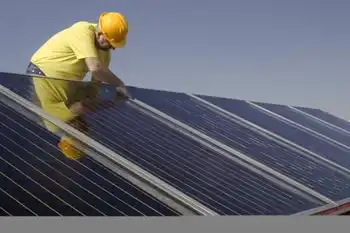
Whether it’s a fully decentralized and distributed power system, or the more likely centralized-decentralized hybrid, it is apparent that the way in which electricity is produced, delivered, and consumed will differ from today’s traditional model. And yet, in many ways, the fundamental design and engineering that makes up today’s electric grid will serve as the foundation for achieving a more distributed future. Indeed, as the transition to a smarter grid ramps up, the grid’s basic structure will remain the underlying commonality, allowing the grid to serve as a facilitator to integrate emerging technologies, including EV charging stations, rooftop solar, demand-side management software, and other distributed energy resources, while maximizing their potential benefits and informing discussions about California’s grid reliability under ambitious transition goals.
A loose analogy here is the internet. In its infancy, the internet was used primarily for sending and receiving email, doing homework, and looking up directions. At the time, it was never fully understood that the internet would create a range of services and products that would impact nearly every aspect of everyday life from online shopping, booking travel, and watching television to enabling the sharing economy and the emerging “Internet of Things.”
Uber, Netflix, Amazon, and Nest would not be possible without the internet. But the rapid evolution of the internet did not occur without significant investment in internet-related infrastructure. From dial-up to broadband to Wi-Fi, companies have invested billions of dollars to update and upgrade the system, allowing the internet to maximize its offerings and give way to technological breakthroughs, innovative businesses, and ways to share and communicate like never before.
The electric grid is similar; it is both the backbone and the facilitator upon which the future of electricity can be built. If the vision for a smarter grid is to deploy advanced energy technologies, create new business models, and transform the way electricity is produced, distributed, and consumed, then updating and modernizing existing infrastructure and building out new intelligent infrastructure need to be top priorities. But this requires money. To be sure, increased investment in grid-related infrastructure is the key component to transitioning to a smarter grid; a grid capable of supporting and integrating advanced energy technologies within a more digital grid architecture that will result in a cleaner, more modern and efficient, and reliable and secure electricity system.
The inherent challenges of deploying new technologies and resources — reliability, bidirectional flow, intermittency, visibility, and communication, to name a few, as well as emerging climate resilience concerns shaping planning today, are not insurmountable and demonstrate exactly why federal and state authorities and electricity sector stakeholders should be planning for and making appropriate investment decisions now. My organization, Alliance for Innovation and Infrastructure, will release a report Wednesday addressing these challenges facing our infrastructure, and the opportunities a distributed smart grid would provide. From upgrading traditional wires and poles and integrating smart power inverters and real-time sensors to deploying advanced communications platforms and energy analytics software, there are numerous technologies currently available and capable of being deployed that warrant investment consideration.
Making these and similar investments will help to identify and resolve reliability issues earlier, and address vulnerabilities identified in the latest power grid report card findings, which in turn will create a stronger, more flexible grid that can then support additional emerging technologies, resulting in a system better able to address integration challenges. Doing so will ease the electricity evolution in the long-term and best realize the full reliability, economic, and environmental benefits that a smarter grid can offer.
Related News