Goreway Power Station Overbilling exposed by Ontario Energy Board shows IESO oversight failures, GCG gaming, and $100M in inappropriate payments at the Brampton natural gas plant, penalized with fines and repayments impacting Ontario ratepayers.
Key Points
Goreway exploited IESO GCG flaws, causing about $100M in improper payouts and fines.
✅ OEB probe flagged $89M in ineligible start-up O&M charges
✅ IESO fined Goreway $10M; majority of excess costs recovered
✅ Audit found $200M in overbilling across nine generators
Hydro customers shelled out about $100 million in "inappropriate" payments to a natural gas plant that exploited flaws in how Ontario manages its private electricity generators, according to the Ontario Energy Board.
The company operating the Goreway Power Station in Brampton "gamed" the system for at least three years, according to an investigation by the provincial energy regulator.
The investigation also delivers stinging criticism of the provincial government's Independent Electricity System Operator (IESO), slamming it for a lack of oversight. The probe by the Ontario Energy Board's market surveillance panel was completed nearly a year ago, but was only made public in November because it was buried on its website without a news release. CBC News is the first media outlet to report on the investigation.
The excess payments to Goreway Power Station included:
- $89 million in ineligible expenses billed as the costs of firing up power production.
- $5.6 million paid in three months from a flaw in how IESO calculated top-ups for the company committing to generate power a day in advance.
- Of $11.2 million paid to compensate the company for IESO ordering it to start or stop generating power, the investigation concluded "a substantial portion ... was the result of gaming."
Most privately-owned natural gas-fired plants in the province do not generate electricity constantly, but start and stop production in response to fluctuating market demand, even as the energy minister has requested an halt to natural gas generation across the grid. IESO pays them a premium for the costs of firing up production, through what it calls "generation cost guarantee" programs.
But the investigation found IESO did little checking into the details of Goreway Power Station's billings.
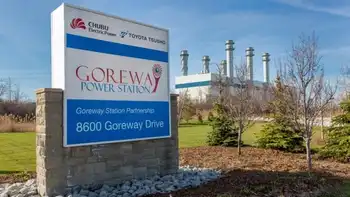
Goreway Power Station, located near Highway 407 in Brampton, Ont., is an 875 megawatt natural gas power plant. (Goreway)
"Conservatively, at least $89 million of Goreway's submissions were clearly ineligible by any reasonable measure," concludes the report.
"Goreway routinely submitted what were obviously inappropriate expenses to be reimbursed by the IESO, and ultimately borne by Ontario ratepayers,"
The investigation panel found an "extraordinary pattern" to these billings by Goreway Power Station, suggesting the IESO should have caught on sooner. The company submitted more than $100 million in start-up operating and maintenance costs during the three-year period investigated — more than all other gas-fired generators in the province combined. The company's costs per start-up were more than double the next most expensive power generator.
"Goreway repeatedly exploited defects in the GCG (generation cost guarantee) program, and in doing so received at least $89 million in gamed GCG payments."
Company fined $10M
The investigation covered a three-year period from when Goreway Power Station began generating power in June 2009. Investigators said that delays in releasing documents slowed down their probe, and they only obtained all the records they needed in April 2016.
The investigating panel does not have the power to impose penalties on companies it found broke the rules.
The IESO fined Goreway Power Station $10 million. The company has also repaid IESO "a substantial portion" of the excess payments it received during its first six years of operating, but the exact figure is blacked out in the investigation report that was made public.
The control room from which the provincial government's Independent Electricity System Operator manages Ontario's power supply. The agency is also responsible for managing contracts with private power producers.(IESO)
"Goreway does not agree with many of the draft report's findings and conclusions, including any suggestion that Goreway engaged in gaming or that it deliberately misled the IESO," writes lawyer George Vegh on behalf of the company in a response to the investigation report, dated Aug. 1.
"Goreway has implemented initiatives designed to ensure that compliance is a chief operating principle."
The power station, located near Highway 407 in Brampton, is a joint venture between Toyota Tsusho Corp. and JERA Co. Inc. During the period under scrutiny, the project was run by Toyota Tsusho and Chubu Electric Power Inc., both headquartered in Japan.
Investigators fear 'same situation' exists today
The report blames the provincially-controlled IESO for creating a system with defects that allowed the over-billing.
"Goreway was able to — and repeatedly did — exploit these defects," says the investigation report. It goes on to explain the flaws "have created opportunities for exploitation, to the serious financial disadvantage of Ontario's ratepayers," even as greening Ontario's grid could entail massive costs.
The investigation suggests IESO hasn't made adequate changes to ensure it won't happen again, at a time when an analysis of a dirtier grid is raising concerns.
"Goreway stands as a clear example of how generators are able to exploit the generation costs guarantee regime," says the report.
"The Panel is concerned that the same situation remains in place today."
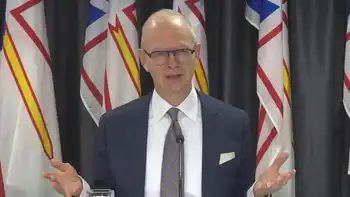
PC energy critic Todd Smith raised CBC News' report on the Goreway Power Station in Tuesday's question period. (Ontario Legislature)
After CBC News broke the story Tuesday, the provincial government was forced to respond in question period, amid a broader push for new gas plants to boost electricity production.
"Here we have yet another gas plant scandal in Peel region that's costing electricity customers over $100 million," said PC energy critic Todd Smith. He slammed "the incompetence of a government that once again failed to look out for electricity customers."
Economic Development Minister Brad Duguid said: "There is no excuse for any company in this province to ever game the system."
Nine companies overbilled $200M: audit
The IESO found out about the overbilling "some time ago," said Duguid.
"They fully investigated, they've recovered most of the cost, they delivered a $10 million fine — the biggest fine on record."
The program that Goreway exploited became the subject of an audit that the IESO launched in 2011. The agency uncovered $200 million in ineligible billings by nine power producers, wrote the IESO vice president for policy Terry Young in an email to CBC News.
The IESO has recovered up to 85 per cent of those ineligible costs, Young noted.
Reforms to the design of the the program have removed the potential for overpayments and made it more efficient, he said, even as Ontario weighs embracing clean power more broadly. Last year, its total annual costs dropped to $23 million, down from $61 million in 2014.
Related News