Substation Relay Protection Training
Our customized live online or in‑person group training can be delivered to your staff at your location.

- Live Online
- 12 hours Instructor-led
- Group Training Available
Regular Price:
$699
Coupon Price:
$599
TORONTO
—
Fort Frances Microgrid aims to boost reliability in Ontario with grid-connected and island modes, Siemens feasibility study, renewable energy integration, EV charging expansion, and resilience modeled after First Nations projects and regional biomass initiatives.
Inside the Issue
A community microgrid in Fort Frances enabling grid and island modes to improve reliability and integrate renewables.
Feasibility study by Siemens Canada via Fort Frances RFP
Operates grid-connected or island mode for outage resilience
Supports solar, wind, EV charging, and local industry growth
Funded by FedNor; informed by western grid planning approaches
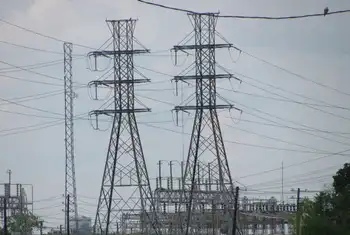
When the power goes out in Fort Frances, Ont., the community may be left in the dark for hours.
The hydro system's unreliability — caused by its location on the provincial power grid — has prompted the town to seek a creative solution: its own self-contained electricity grid with its own source of power, known as a microgrid.
Located more than 340 kilometres west of Thunder Bay, Ont., on the border of Minnesota, near the Great Northern Transmission Line corridor, Fort Frances gets its power from a single supply point on Ontario's grid.
"Sometimes, it's inevitable that we have to have like a six- to eight-hour power outage while equipment is being worked on, and that is no longer acceptable to many of our customers," said Joerg Ruppenstein, president and chief executive officer of Fort Frances Power Corporation.
While Ontario's electrical grid serves the entire province, and national efforts explore macrogrids, a microgrid is contained within a community. Fort Frances hopes to develop an integrated, community-based electric microgrid system that can operate in two modes:
- Grid-connected mode, which means it's connected to the provincial grid and informed by western grid planning approaches
- Island mode, which means it's disconnected from the provincial grid and operates independently
The ability to switch between modes allows flexibility. If a storm knocks down a line, the community will still have power.
The town has been given grant funding from the Federal Economic Development Agency for Northern Ontario (FedNor), echoing smart grid funding in Sault Ste. Marie initiatives, for the project. On Monday night, council voted to grant a request for proposal to Siemens Canada Limited to conduct a feasibility study into a microgrid system.
The study, anticipated to be completed by the end of 2023 or early 2024, will assess what an integrated community-based microgrid system could look like in the town of just over 7,000 people, said Faisal Anwar, chief administrative officer of Fort Frances. A timeline for construction will be determined after that.
The community is still reeling from the closure of the Resolute Forest Products pulp and paper mill in 2014 and faces a declining population, said Ruppenstein. It's hoped the microgrid system will help attract new industry to replace those lost workers and jobs, drawing on Manitoba's hydro experience as a model.
This gives the town a competitive advantage.
"If we were conceivably to attract a larger industrial player that would consume a considerable amount of energy, it would result in reduced rates for everyone…we're the only utility really in Ontario that can offer that model," Ruppenstein said.
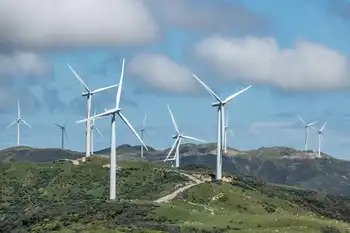
The project can also incorporate renewable energy like solar or wind power, as seen in B.C.'s clean energy shift efforts, into the microgrid system, and support the growth of electric vehicles, he said. Many residents fill their gas tanks in Minnesota because it's cheaper, but Fort Frances has the potential to become a hub for electric vehicle charging.
A few remote First Nations have recently switched to microgrid systems fuelled by green energy, including Gull Bay First Nation and Fort Severn First Nation. These are communities that have historically relied on diesel fuel either flown in, which is incredibly expensive, or transported via ice roads, which are seeing shorter seasons each year.
Natural Resources Minister Jonathan Wilkinson was in Thunder Bay, Ont., to announce $35 million for a biomass generation facility in Whitesand First Nation, complementing federal funding for the Manitoba-Saskatchewan transmission line elsewhere in the region.
Related News
Related News
U.S. renewable electricity surpassed coal in 2022
2022 US Renewable Power Milestone highlights EIA data: wind and solar outpaced coal and nuclear,…
View more
Kenya Power on the spot over inflated electricity bills
Kenya Power token glitches, inflated bills disrupt prepaid meters via M-Pesa paybill 888880 and third-party…
View more
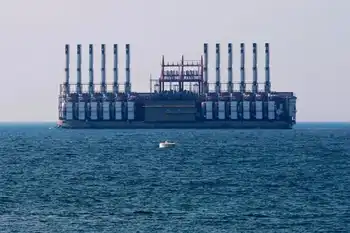
A goodwill gesture over electricity sows discord in Lebanon
Lebanon Power Barge Controversy spotlights Karadeniz Energy's Esra Sultan, Lebanon's electricity crisis, prolonged blackouts, and…
View more
5 ways Texas can improve electricity reliability and save our economy
Texas Power Grid Reliability faces ERCOT blackouts and winter storm risks; solutions span weatherization, natural…
View more
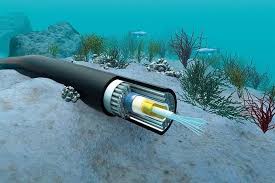
Spain and Ireland sign MoU to study undersea electricity interconnector
Spain-Ireland electricity interconnector: Governments signed a three-year MoU to study technical and economic feasibility, tasking…
View more
As New Zealand gets serious about climate change, can electricity replace fossil fuels in time?
New Zealand Energy Transition will electrify transport and industry with renewables, grid-scale solar, wind farms,…
View more
Sign Up for Electricity Forum’s Newsletter
Stay informed with our FREE Newsletter — get the latest news, breakthrough technologies, and expert insights, delivered straight to your inbox.
Electricity Today T&D Magazine Subscribe for FREE

Stay informed with the latest T&D policies and technologies.
- Timely insights from industry experts
- Practical solutions T&D engineers
- Free access to every issue

