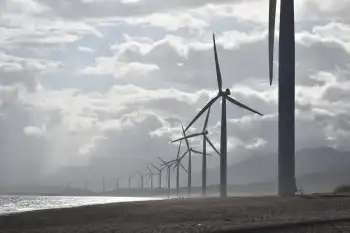
Offshore wind industry slowly improving

By United Press International
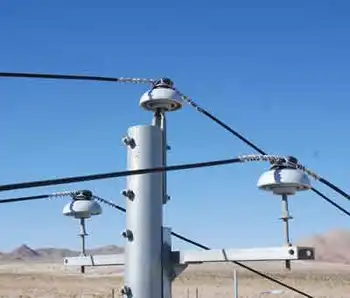

Substation Relay Protection Training

Our customized live online or in‑person group training can be delivered to your staff at your location.

  • Live Online
  • 12 hours Instructor-led
  • Group Training Available
Regular Price:
$699
Coupon Price:
$599
Reserve Your Seat Today
After a terrible year for the European offshore wind industry, it appears some projects are receiving the financial push they needed.

Belgian consortium Belwind said it had completed financing for the first phase of a 330 megawatt offshore wind farm in the North Sea. The European Investment Bank granted Belwind a $425 million loan, the company said. A consortium of six companies plans the offshore farm, which would be Belgium's largest. Construction work on 55 3 MW turbines is to start this summer, with the park going online by early 2011, the company said.

This is good news for the offshore wind industry, which has been hit hard by delays and money problems as a result of the financial crisis.

Banks have been axing funding because they have little cash to loan and because they have been put off by insecurities linked to some offshore projects, which often cost several hundred million to a few billion dollars.

While winds at sea are stronger and able to yield higher output, construction costs for offshore wind farms are roughly twice as high because companies need to build an entirely new infrastructure — transformer stations, sea cables — to deliver the power to land.

"Offshore wind has a serious financing problem," Ralf Bischof, the managing director of the German Wind Energy Association, an industry group, said earlier this year in Berlin.

But several projects are now going ahead, boosted in part by money from governments eager to support offshore wind power, seen in European capitals as a key tool to reach the continent's ambitious climate protection and renewable energy targets.

The world's biggest offshore project, the 1 GW London Array, was about to go under when the British government gave it a live-saving shot in the arm.

London in its 2009 budget, released in May, increased the subsidies for offshore wind to $864 million and doubled the number of renewable energy certificates for power from offshore wind.

In Germany, a prestigious 60 MW offshore wind farm project called Alpha Ventus received the go-ahead in June after several years of delay.

Alpha Ventus was initially to go online in 2008 but weather issues delayed a first construction attempt last year. This summer construction has begun with 12 tripod foundations that will hold the turbines to be constructed this summer already installed in the seabed off the German Baltic Sea coast. A company spokesman said the blades will be turning by October.

The decision to build Alpha Ventus was prompted in part by government support. As part of its economic aid package, Berlin handed the offshore industry around $130 million in subsidies. As an additional measure, starting this year, the guaranteed feed-in-tariff for power from offshore wind was boosted to 22 cents per kWh, compared to 13 cents for onshore.

Related News

Ontario Energy Board Sets New Electricity Rate Plan Prices and Support Program Thresholds

OESP Eligibility 2024 updates Ontario electricity affordability: TOU, Tiered, Ultra-Low-Overnight price plans, online bill calculator, higher income thresholds, monthly credits for low-income households, and a winter disconnection ban for residential customers.


Key Points

Raises income thresholds and credits to help low-income Ontarians cut electricity costs and choose suitable price plans.

✅ TOU, Tiered, and ULO price plans with online bill calculator

✅ Income eligibility thresholds raised up to 35% on March 1, 2024

✅ Winter disconnection ban for residences: Nov 15, 2023 to Apr 30, 2024


Residential, small business and farm customers can choose their price plan, either Time-Of-Use (TOU), Tiered or the ultra-low overnight rates price plan available to many customers. The OEB has an online bill calculator to help customers who are considering a switch in price plans and monitoring changes for electricity consumers this year. 

The Government of Ontario announced on Friday, October 19, 2023, that it is raising the income eligibility thresholds that enable Ontarians to qualify for the Ontario Electricity Support Program (OESP) by up to 35 percent. OESP is part of Ontario’s energy affordability framework and other support for electric bills meant to reduce the cost of electricity for low-income households by applying a monthly credit directly on to electricity bills.. The higher income eligibility thresholds will begin on March 1, 2024.

The amount of OESP bill credit is determined by the number of people living in a home and the household’s combined income, and can help offset typical bill increases many customers experience. The current income thresholds cap income eligibility at $28,000 for one-person households and $52,000 for five-person households, and temporary measures like the off-peak price freeze have also influenced bills in recent periods.

The new income eligibility thresholds, which will be in effect beginning March 1, 2024, will allow many more families to access the program as rates are about to change across Ontario.

In addition, under the OEB’s winter disconnection ban, which follows the Nov. 1 rate increase, electricity distributors cannot disconnect residential customers for non-payment from November 15, 2023, to April 30, 2024.


Related News

View more

Global oil demand to decline in 2020 as Coronavirus weighs heavily on markets

COVID-19 Impact on Global Oil Demand 2020 signals an IEA forecast of declining consumption as travel restrictions curb transport fuels, disrupt energy markets, and shift OPEC and non-OPEC supply dynamics amid economic slowdown.


Key Points

IEA sees first demand drop since 2009 as COVID-19 curbs travel, weakening transport fuels and unsettling energy markets.

✅ IEA base case: 2020 demand at 99.9 mb/d, down 90 kb/d from 2019.

✅ Travel restrictions hit transport fuels; China drives the decline.

✅ Scenarios: low -730 kb/d; high +480 kb/d in 2020.


Global oil demand is expected to decline in 2020 as the impact of the new coronavirus (COVID-19) spreads around the world, constricting travel and broader economic activity, according to the International Energy Agency’s latest oil market forecast.

The situation remains fluid, creating an extraordinary degree of uncertainty over what the full global impact of the virus will be. In the IEA’s central base case, even as global CO2 emissions flatlined in 2019 according to the IEA, demand this year drops for the first time since 2009 because of the deep contraction in oil consumption in China, and major disruptions to global travel and trade.

“The coronavirus crisis is affecting a wide range of energy markets – including coal-fired electricity generation, gas and renewables – but its impact on oil markets is particularly severe because it is stopping people and goods from moving around, dealing a heavy blow to demand for transport fuels,” said Dr Fatih Birol, the IEA’s Executive Director. “This is especially true in China, the largest energy consumer in the world, which accounted for more than 80% of global oil demand growth last year. While the repercussions of the virus are spreading to other parts of the world, what happens in China will have major implications for global energy and oil markets.”

The IEA now sees global oil demand at 99.9 million barrels a day in 2020, down around 90,000 barrels a day from 2019. This is a sharp downgrade from the IEA’s forecast in February, which predicted global oil demand would grow by 825,000 barrels a day in 2020.

The short-term outlook for the oil market will ultimately depend on how quickly governments move to contain the coronavirus outbreak, how successful their efforts are, and what lingering impact the global health crisis has on economic activity.

To account for the extreme uncertainty facing energy markets, the IEA has developed two other scenarios for how global oil demand could evolve this year. In a more pessimistic low case, global measures fail to contain the virus, and global demand falls by 730,000 barrels a day in 2020. In a more optimistic high case, the virus is contained quickly around the world, and global demand grows by 480,000 barrels a day.

“We are following the situation extremely closely and will provide regular updates to our forecasts as the picture becomes clearer,” Dr Birol said. “The impact of the coronavirus on oil markets may be temporary. But the longer-term challenges facing the world’s suppliers are not going to go away, especially those heavily dependent on oil and gas revenues. As the IEA has repeatedly said, these producer countries need more dynamic and diversified economies in order to navigate the multiple uncertainties that we see today.”

The IEA also published its medium-term outlook examining the key issues in global demand, supply, refining and trade to 2025, as well as the trajectory of the global energy transition now shaping markets. Following a contraction in 2020 and an expected sharp rebound in 2021, yearly growth in global oil demand is set to slow as consumption of transport fuels grows more slowly and as national net-zero pathways, with Canada needing more electricity to reach net-zero influencing power demand, according to the report. Between 2019 and 2025, global oil demand is expected to grow at an average annual rate of just below 1 million barrels a day. Over the period as whole, demand rises by a total of 5.7 million barrels a day, with China and India accounting for about half of the growth.

At the same time, the world’s oil production capacity is expected to rise by 5.9 million barrels a day, with more than three-quarters of it coming from non-OPEC producers, the report forecasts. But production growth in the United States and other non-OPEC countries is set to lose momentum after 2022, amid shifts in Wall Street's energy strategy linked to policy signals, allowing OPEC producers from the Middle East to turn the taps back up to help keep the global oil market in balance.

The medium-term market report, Oil 2020, also considers the impact of clean energy transitions on oil market trends. Demand growth for gasoline and diesel between 2019 and 2025 is forecast to weaken as countries around the world implement policies to improve efficiency and cut carbon dioxide emissions – and as solar power becomes the cheapest electricity in many markets and electric vehicles increase in popularity. The impact of energy transitions on oil supply remains unclear, with many companies prioritising short-cycle projects for the coming years.

“The coronavirus crisis is adding to the uncertainties the global oil industry faces as it contemplates new investments and business strategies,” Dr Birol said. “The pressures on companies are changing, with European oil majors turning electric to diversify. They need to show that they can deliver not just the energy that economies rely on, but also the emissions reductions that the world needs to help tackle our climate challenge.”


Related News

View more

We Energies refiles rate hike request driven by rising nuclear power costs

We Energies rate increase driven by nuclear energy costs at Point Beach, Wisconsin PSC filings, and rising utility rates, affecting electricity prices for residential, commercial, and industrial customers while supporting WEC carbon reduction goals.


Key Points

A 2021 utility rate hike to recover Point Beach nuclear costs, modestly raising Wisconsin electricity bills.

✅ Residential bills rise about $0.73 per month

✅ Driven by $55.82/MWh Point Beach contract price

✅ PSC review and consumer advocates assessing alternatives


Wisconsin's largest utility company is again asking regulators to raise rates to pay for the rising cost of nuclear energy.

We Energies says it needs to collect an additional $26.5 million next year, an increase of about 3.4%.

For residential customers, that would translate to about 73 cents more per month, or an increase of about 0.7%, while some nearby states face steeper winter rate hikes according to regulators. Commercial and industrial customers would see an increase of 1% to 1.5%, according to documents filed with the Public Service Commission.

If approved, it would be the second rate increase in as many years for about 1.1 million We Energies customers, who saw a roughly 0.7% increase in 2020 after four years of no change, while Manitoba Hydro rate increase has been scaled back for next year, highlighting regional contrasts.

We Energies' sister utility, Wisconsin Public Service Corp., has requested a 0.13% increase, which would add about 8 cents to the average monthly residential bill, which went up 1.6% this year.

We Energies said a rate increase is needed to cover the cost of electricity purchased from the Point Beach nuclear power plant, which according to filings with the Securities Exchange Commission will be $55.82 per megawatt-hour next year.

So far this year, the average wholesale price of electricity in the Midwestern market was a little more than $25.50 per megawatt-hour, and recent capacity market payouts on the largest U.S. grid have fallen sharply, reflecting broader market conditions.

Owned and operated by NextEra Energy Resources, the 1,200-megawatt Point Beach Nuclear Plant is Wisconsin's last operational reactor. We Energies sold the plant for $924 million in 2007 and entered into a contract to purchase its output for the next two decades.

Brendan Conway, a spokesman for WEC Energy Group, said customers have benefited from the sale of the plant, which will supply more than a third of We Energies' demand and is a key component in WEC's strategy to cut 80% of its carbon emissions by 2050, amid broader electrification trends nationwide.

"Without the Point Beach plant, carbon emissions in Wisconsin would be significantly higher," Conway said.

As part of negotiations on its last rate case, WEC agreed to work with consumer advocates and the PSC to review alternatives to the contracted price increases, which were structured to begin rising steeply in 2018.

Tom Content, executive director of the Citizens Utility Board, said the contract will be an issue for We Energies customers into the next decade

"It's a significant source (of energy) for the entire state," Content said. "But nuclear is not cheap."

WEC filed the rate requests Monday, one week after the withdrawing similar applications. Conway said the largely unchanged filings had "undergone additional review by senior management."

WEC last week raised its second quarter profit forecast to 67 to 69 cents per share, up from the previous range of 58 to 62 cents per share.

The company credited better than expected sales in April and May along with operational cost savings and higher authorized profit margin for American Transmission Company, of which WEC is the majority owner.

Wisconsin's other investor-owned utilities have reported lower than expected fuel costs for 2020 and 2021, even as emergency fuel stock programs in New England are expected to cost millions this year.

Alliant Energy has proposed using about $31 million in fuel savings to help freeze rates in 2021, aligning with its carbon-neutral electricity plans as it rolls out long-term strategy, while Xcel Energy is proposing to lower its rates by 0.8% next year and refund its customers about $9.7 million in fuel costs for this year.

Madison Gas and Electric is negotiating a two-year rate structure with consumer groups who are optimistic that fuel savings can help prevent or offset rate increases, though some utilities are exploring higher minimum charges for low-usage customers to recover fixed costs.


Related News

View more

U.S. Electricity Sales Projections Continue to Fall

US Electricity Demand Outlook examines EIA forecasts, GDP decoupling, energy efficiency, electrification, electric vehicles, grid load growth, and weather variability to frame long term demand trends and utility planning scenarios.


Key Points

An analysis of EIA projections showing demand decoupling from GDP, with EV adoption and efficiency shaping future grid load.

✅ EIA lowers load growth; demand decouples from GDP.

✅ Efficiency and sector shifts depress kWh sales.

✅ EV adoption could revive load and capacity needs.


Electricity producers and distributors are in an unusual business. The product they provide is available to all customers instantaneously, literally at the flip of a switch. But the large amount of equipment, both hardware and software to do this takes years to design, site and install.

From a long range planning perspective, just as important as a good engineering design is an accurate sales projections. For the US electric utility industry the most authoritative electricity demand projec-tions come from the Department of Energy’s Energy Information Administration (EIA). EIA's compre-hensive reports combine econometric analysis with judgment calls on social and economic trends like the adoption rate of new technologies that could affect future electricity demand, things like LED light-ing and battery powered cars, and the rise of renewables overtaking coal in generation.

Before the Great Recession almost a decade ago, the EIA projected annual growth in US electricity production at roughly 1.5 percent per year. After the Great Recession began, the EIA lowered its projections of US electricity consumption growth to below 1 percent. Actual growth has been closer to zero. While the EIA did not antici-pate the last recession or its aftermath, we cannot fault them on that.

After the event, though, the EIA also trimmed its estimates of economic growth. For the 2015-2030 period it now predicts 2.1 percent economic and 0.3 percent electricity growth, down from previously projections of 2.7 percent and 1.3 percent respectively. (See Figures 1 and 2.)


Table 1. EIA electric generation projections by year of forecast (kWh billions)


Table 2. EIA forecast of GDP by year of forecast (billion 2009 $)

Back in 2007, the EIA figured that every one percent increase in economic activity required a 0.48 percent in-crease in electric generation to support it. By 2017, the EIA calculated that a 1 percent growth in economic activity now only required a 0.14 percent increase in electric output. What accounts for such a downgrade or disconnect between electricity usage and economic growth? And what factors might turn the numbers 
around?

First, the US economy lost energy intensive heavy industry like smelting, steel mills and refineries; patterns in China's electricity sector highlight how industrial shifts can reshape power demand. A more service oriented economy (think health care) relies more heavily on the movement of data or information and uses far less power than a manufacturing-oriented economy.

A small volcano in Argentina is about to fuel the next tech boom – and a little known company is going to be right at the center. Early investors stand to gain incredible profits and you can too. Read the report.

Second, internet shopping has hurt so-called "brick and mortar" retailers. Despite the departure of heavy industry, in years past a burgeoning US commercial sector increased its demand and usage of electricity to offset the industrial decline. But not anymore. Energy efficiency measures as well as per-haps greater concern about global warming and greenhouse gas emissions and have cut into electricity sales. “Do more with less” has the right ring to it.

But there may be other components to the ongoing decline in electricity usage. Academic studies show that electricity usage seems to increase with income along an S curve, and flattens out after a certain income level. That is, if you earn $1 billion per year you do not (or cannot) use ten times a much electricity as someone earning only $100 million.

But people at typical, middle income levels increase or decrease electricity usage when incomes rise or fall. The squeeze on middle income families was discussed often in the late presidential campaign. In recent decades an increasing percentage of income has gone to a small percentage of the population at the top of the income scale. This trend probably accounts for some weakness in residential sales. This suggests that government policy addressing income inequality would also boost electricity sales.

Population growth affects demand for electricity as well as the economy as a whole. The EIA has made few changes in its projections, showing 0.7 percent per year population growth in 2015- 2030 in both the 2007 and 2017 forecasts. Recent studies, however, have shown a drop in the birth rate to record lows. More troubling, from a national health perspective is that the average age of death may have stopped rising. Those two factors point to lower population growth, especially if the government also restricts immi-gration. Thus, the US may be approaching a period of rather modest population growth.

All of the above factors point to minimal sales growth for electricity producers in the US--perhaps even lower than the seemingly conservative EIA estimates. But the cloud on the horizon has a silver lining in the shape of an electric car. Both the United Kingdom and France have set dates to end of production of automobiles with internal combustion engines. Several European car makers have declared that 20 percent of their output will be electric vehicles by the early 2020s. If we adopt automobiles powered by electricity and not gasoline or diesel, electricity sales would increase by one third. For the power indus-try, electric vehicles represent the next big thing.

We don’t pretend to know how electric car sales will progress. But assume vehicle turnover rates re-main at the current 7 percent per year and electric cars account for 5 percent of sales in the first five years (as op-posed to 1 percent now), 20 percent in the next five years and 50 percent in the third five year period. Wildly optimistic assumptions? Maybe. By 2030, electric cars would constitute 28 percent of the vehicle fleet. They would add about 10 percent to kilowatt hour sales by that date, assuming that battery efficiencies do not improved by then. Those added sales would require increased electric generation output, with low-emissions sources expected to cover almost all the growth globally. They would also raise long term growth rates for 2015-2030 from the present 0.3 percent to 1.0 percent. The slow upturn in demand should give the electric companies time to gear up so to speak.

In the meantime, weather will continue to play a big role in electricity consumption. Record heat-induced demand peaks are being set here in the US even as surging global demand puts power systems under strain worldwide.

Can we discern a pattern in weather conditions 15 years out? Maybe we can, but that is one topic we don’t expect a government agency to tackle in public right now. Meantime, weather will affect sales more than anything else and we cannot predict the weather. Or can we?


Related News

View more

Balancing Act: Germany's Power Sector Navigates Energy Transition

Germany January Power Mix shows gas-fired generation rising, coal steady, and nuclear phaseout impacts, amid cold weather, energy prices, industrial demand, and emissions targets shaping renewables, grid stability, and security of supply.


Key Points

The January electricity mix, highlighting gas, coal, renewables, and nuclear exit effects on emissions, prices, and demand.

✅ Gas output up 13% to 8.74 TWh, share at 18.6%.

✅ Coal share 23%, down year on year, steady vs late 2023.

✅ Nuclear gap filled by gas and coal; emissions below Jan 2023.


Germany's electricity generation in January presented a fascinating snapshot of its energy transition journey. As the country strives to move away from fossil fuels, with renewables overtaking coal and nuclear in its power mix, it grapples with the realities of replacing nuclear power and meeting fluctuating energy demands.

Gas Takes the Lead:

Gas-fired power plants saw their highest output in two years, generating 8.74 terawatt hours (TWh). This 13% increase compared to January 2023 compensated for the closure of nuclear reactors, which were extended during the energy crisis to shore up supply, and colder weather driving up heating needs. This reliance on gas, however, pushed its share in the electricity mix to 18.6%, highlighting Germany's continued dependence on fossil fuels.

Coal Fades, but Not Forgotten:

While gas surged, coal-fired generation remained below previous levels, dropping 29% from January 2023. However, it stayed relatively flat compared to late 2023, suggesting utilities haven't entirely eliminated it. Coal still held a 23% share, and periodic coal reliance remains evident, exceeding gas' contribution, reflecting its role as a reliable backup for intermittent renewable sources like wind.

Nuclear Void and its Fallout:

The shutdown of nuclear plants in April 2023 created a significant gap, previously accounting for an average of 12% of annual electricity output. This loss is being compensated through gas and coal, with gas currently the preferred choice, even as a nuclear option debate persists among policymakers. This strategy kept January's power sector emissions lower than the previous year, but rising demand could shift the balance.

Industry's Uncertain Impact:

Germany's industrial sector, a major energy consumer, is facing challenges like high energy prices and weak consumer demand. While the government aims to foster industrial recovery, uncertainties linger due to a shaky coalition and limited budget, and debate about a possible nuclear resurgence continues in parallel, which could reshape policy. Any future industrial revival would likely increase energy demand and potentially necessitate more gas or coal.

Cost-Driven Choices and Emission Concerns:

The choice between gas and coal depends on their relative costs, in a system pursuing a coal and nuclear phase-out under long-term policy. Currently, gas seems more favorable emission-wise, but if its price rises, coal might become more attractive, impacting overall emissions.

Looking Ahead:

Germany's energy transition faces a complex balancing act, with persistent grid expansion woes and exposure to cheap gas complicating progress. While the reliance on gas and coal highlights the difficulties in replacing nuclear, the focus on emissions reduction is encouraging. Navigating the challenges of affordability, industrial needs, and climate goals will be crucial for a successful transition to a clean and secure energy future.


Related News

View more

Opponent of Site C dam sharing concerns with northerners

Site C Dam Controversy highlights Peace River risks, BC Hydro claims, Indigenous rights under Treaty 8, environmental assessment findings, and potential impacts to agriculture and the Peace-Athabasca Delta across Alberta and the Northwest Territories.


Key Points

Debate over BC Hydro's Site C dam: clean energy vs Indigenous rights, Peace-Athabasca Delta impacts, and agriculture.

✅ Potential drying of Peace-Athabasca Delta and wildlife habitat

✅ Treaty 8 rights and First Nations legal challenges

✅ Loss of prime Peace Valley farmland; alternatives in renewables


One of the leading opponents of the Site C dam in northeastern B.C. is sharing her concerns with northerners this week.

Proponents of the Site C dam say it will be a cost-effective source of clean electricity, even as a major Alberta wind farm was scrapped elsewhere in Canada, and that it will be able to produce enough energy to power the equivalent of 450,000 homes per year in B.C. But a number of Indigenous groups and environmentalists are against the project.

Wendy Holm is an economist and agronomist who did an environmental assessment of the dam focusing on its potential impacts on agriculture.

On Tuesday she spoke at a town hall presentation in Fort Smith, N.W.T., organized by the Slave River Coalition. She is also speaking at an event in Yellowknife on Friday, as small modular reactors in Yukon receive study as a potential long-term option.


Worried about downstream impacts, Northern leaders urge action on Site C dam

"I learned that people outside of British Columbia are as concerned with this dam as we are," Holm said.

"There's just a lot of concern with what's happening on the Peace River and this dam and the implications for Alberta, where hydro's share has diminished in recent decades, and the Northwest Territories."

If completed, BC Hydro's Site C energy project will be the third dam on the Peace River in northeast B.C. and the largest public works project in B.C. history. The $10.7-billion project was approved by both the provincial and federal governments as B.C. moves to streamline clean energy permitting for future projects.

Amy Lusk, co-ordinator of the Slave River Coalition, said many issues were discussed at the town hall, but she also left with a sense of hope.

"I think sometimes in our little corner of the world, we are up against so much when it comes to industrial development and threats to our water," she said.

"To kind of take away that message of, this is not a done deal, and that we do have a few options in place to try and stop this and not to lose hope, I think was a very important message for the community."


Drying of the Peace-Athabasca Delta

Holm said her main concern for the Northwest Territories is how it could affect the Peace-Athabasca Delta. She said the two dams already on the river are responsible for two-thirds of the drying that's happening in the delta.

"These are very real issues and very present in the minds of northerners who want to stay connected to a traditional lifestyle, want to have access to those wild foods," she said.

Lusk said northerners are fed up with defending waters "time after time after time."

BC Hydro, however, said studies commissioned during the environmental assessment of Site C show the project will have no measurable effect on the delta, which is located 1,100 kilometres away.

Holm said the fight against the Site C dam is also important when it comes to First Nations treaty rights.

The West Moberly and Prophet River First Nations applied for an injunction to halt construction on Site C, as well as a treaty infringement lawsuit against the B.C. government. They argue the dam would cause irreparable harm to their territories and way of life, which are rights protected under Treaty 8.


Agricultural land

While the project is located in B.C., Holm said its impacts on prime horticulture land would also affect northerners, something that's important given issues of food security and nutrition.

"This is some of the best agriculture land in all of Canada," she said of the Peace Valley.

According to BC Hydro, around 2.6 million hectares of land in the Peace agricultural region would remain available for agricultural production while 3,800 hectares would be unavailable. It has also proposed a number of mitigation efforts, including a $20-million agricultural compensation fund.

Holm said renewable energy, including tidal energy for remote communities, will be cheaper and less destructive than the dam, and there's a connection between the dams on the Peace River and water sharing with the U.S.

"When you run out of water there's nothing else you can use. You can't use orange juice to irrigate your fields or to run your industries or to power your homes," she said.


Related News

View more

Sign Up for Electricity Forum’s Newsletter

Stay informed with our FREE Newsletter — get the latest news, breakthrough technologies, and expert insights, delivered straight to your inbox.

Electricity Today T&D Magazine Subscribe for FREE

Stay informed with the latest T&D policies and technologies.
  • Timely insights from industry experts
  • Practical solutions T&D engineers
  • Free access to every issue

Live Online & In-person Group Training

Advantages To Instructor-Led Training – Instructor-Led Course, Customized Training, Multiple Locations, Economical, CEU Credits, Course Discounts.

Request For Quotation

Whether you would prefer Live Online or In-Person instruction, our electrical training courses can be tailored to meet your company's specific requirements and delivered to your employees in one location or at various locations.