Alberta Clean Electricity Regulations face federal mandates and provincial autonomy, balancing greenhouse gas cuts, net-zero 2050 goals, and renewable energy adoption across wind, solar, and hydro, while protecting jobs and economic stability in energy communities.
Key Points
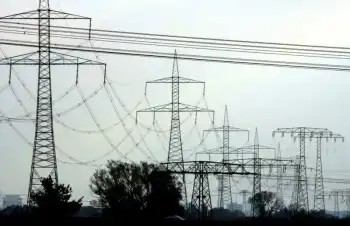
Rules to cut power emissions, boost renewables, and align Alberta with federal net-zero goals under federal mandates.
✅ Phases out coal and curbs greenhouse gas emissions
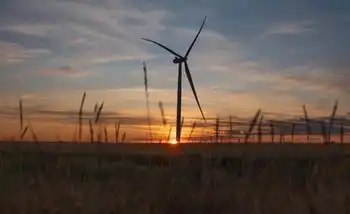
✅ Expands wind, solar, and hydro to diversify the grid
✅ Balances provincial autonomy with national climate targets
In a recent development, Alberta finds itself at a crossroads between provincial autonomy and federal mandates concerning federal clean electricity regulations that shape long-term planning. The province, known for its significant oil and gas industry, faces increasing pressure to align its energy policies with federal climate goals set by Ottawa.
The federal government, under the leadership of Environment Minister Steven Guilbeault, has proposed regulations aimed at reducing greenhouse gas emissions and transitioning towards a cleaner energy future that prioritizes clean grids and batteries across provinces. These regulations are part of Canada's broader commitment to combat climate change and achieve net-zero emissions by 2050.
The Federal Perspective
From Ottawa's standpoint, stringent regulations on Alberta's electricity sector are necessary to meet national climate targets. This includes measures to phase out coal-fired power plants and increase reliance on renewable energy sources such as wind, solar, and hydroelectric power. Minister Guilbeault emphasizes the importance of these regulations in mitigating Canada's carbon footprint and fostering sustainable development.
Alberta's Response
In contrast, Alberta has historically championed provincial autonomy in energy policy, leveraging its vast fossil fuel resources to drive economic growth. The province remains cautious about federal interventions that could potentially disrupt its energy sector, a cornerstone of its economy, especially amid changes to how electricity is produced and paid for now under discussion.
Premier Jason Kenney has expressed concerns over federal overreach, and his influence over electricity policy has shaped proposals in the legislature. He emphasizes the province's efforts in adopting cleaner technologies while balancing economic stability and environmental sustainability.
The Balancing Act
The challenge lies in finding a middle ground between federal imperatives and provincial priorities, as interprovincial disputes like B.C.'s export-restriction challenge complicate coordination. Alberta acknowledges the need to diversify its energy portfolio and reduce emissions but insists on preserving its jurisdiction over energy policy. The province has already made strides in renewable energy development, including investing in wind and solar projects alongside traditional energy sources.
Economic Implications
For Alberta, the transition to cleaner electricity carries significant economic implications as the electricity market heads for a reshuffle in the coming years. It entails navigating the complexities of energy transition, ensuring job retention, and fostering innovation in sustainable technologies. Critics argue that abrupt federal regulations could exacerbate economic hardships, particularly in communities reliant on the fossil fuel industry.
Moving Forward
As discussions continue between Alberta and Ottawa, finding common ground, including consideration of recent market change proposals from the province, remains essential. Collaborative efforts are necessary to develop tailored solutions that accommodate both environmental responsibilities and economic realities. This includes exploring incentives for renewable energy investment, supporting energy sector workers in transitioning to new industries, and leveraging Alberta's expertise in energy innovation.
Conclusion
Alberta's journey towards clean electricity regulation exemplifies the delicate balance between regional autonomy and federal oversight in Canada's complex federal system. While tensions persist between provincial and federal priorities, both levels of government share a common commitment to addressing climate change and advancing sustainable energy solutions.
The outcome of these negotiations will not only shape Alberta's energy landscape but also influence Canada's overall progress towards a greener future. Finding equitable solutions that respect provincial autonomy while achieving national environmental goals remains paramount in navigating this evolving policy landscape.
Related News