Chevron shines with California solar array

By United Press International


CSA Z463 Electrical Maintenance

Our customized live online or in‑person group training can be delivered to your staff at your location.

  • Live Online
  • 6 hours Instructor-led
  • Group Training Available
Regular Price:
$249
Coupon Price:
$199
Reserve Your Seat Today
A solar energy project in southern California will remove more than 86,000 tons of emissions from the atmosphere, energy company Chevron said.

Chevron's subsidiary Chevron Energy Solutions teamed with officials in Brea, Calif., to launch a 1.8 megawatt solar energy project.

The solar farm will position Brea as the largest contributor of solar energy to the electrical grid in Orange County, the company said in a statement.

Brea Mayor Ron Garcia was quoted as saying the installation of the solar facility will bring his city one step closer to environmental benchmarks.

Chevron said the solar facility along with improvements made to energy infrastructure will drive down energy consumption by as much as 40 percent.

The city, meanwhile, will cut its greenhouse gas emissions to a level equivalent to removing 16,000 cars from the road during the life span of the solar facility.

The system should go online next year, Chevron said.

Related News

Germany launches second wind-solar tender

Germany's Joint Onshore Wind and Solar Tender invites 200 MW bids in an EEG auction, with PV and onshore wind competing on price per MWh, including grid integration costs and network fees under BNA rules.


Key Points

A BNA-run 200 MW EEG auction where PV and onshore wind compete on price per MWh, including grid integration costs.

✅ 200 MW cap; minimum project size 750 kW

✅ Max subsidy 87.50 per MWh; bids include network costs

✅ Solar capped at 10-20 MW; wind requires prior approval


Germany's Federal Network Agency (BNA) has launched its second joint onshore wind and solar photovoltaic (PV) tender, with a total capacity of 200 MW.

A maximum guaranteed subsidy payment has been set at 87.50 per MWh for both energy sources, which BNA says will have to compete against each other for the lowest price of electricity. According to auction rules, all projects must have a minimum of 750 kW.

The auction is due to be completed on 2 November.

The network regulator has capped solar projects at 10 MW, though this has been extended to 20 MW in some districts, amid calls to remove barriers to PV at the federal level. Onshore wind projects did not receive any such restrictions, though they require approval from Federal Immission Control three weeks prior to the bid date of 11 Octobe

Bids also require network and system integration costs to be included, and similar solicitations have been heavily subscribed, as an over-subscribed Duke Energy solar solicitation in the US market illustrates.

According to Germanys Renewable Energy Act (EEG), two joint onshore wind and solar auctions must take place each year between 2018 and 2021. After this, the government will review the scheme and decide whether to continue it beyond 2021.

The first tender, conducted in April, saw the entire 200 MW capacity given to solar PV projects, reflecting a broader solar power boost in Germany during the energy crisis. Of the 32 contracts awarded, value varied from 39.60 per MWh to 57.60 per MWh. Among the winning bids were five projects in agricultural and grassland sites in Bavaria, totalling 31 MW, and three in Baden-Wrttemberg at 17 MW.

According to the Agency, the joint tender scheme was initiated in an attempt to determine the financial support requirements for wind and solar in technology-specific auctions, however, solar powers sole win in the April auction meant it was met with criticism, even as clean energy accounts for 50% of Germany's electricity today.

The heads of the Federal Solar Industry Association (BSW-Solar) and German Wind Energy Association (BWE) saying the joint tender scheme is unsuitable for the build-out of the two technologies.

A BWE spokesman previously stressed the companys rejection of competition between wind and solar, saying: It is not clear how this could contribute to an economically meaningful balanced energy mix,

Technologies that are in various stages of development must not enter into direct competition with each other. Otherwise, innovation and development potential will be compromised.

Similarly, BSW-Solar president Carsten Krnig said: We are happy for the many solar winners, but consider the experiment a failure. The auction results prove the excellent price-performance ratio of new solar power plants, as solar-plus-storage is cheaper than conventional power in Germany, but not the suitability of joint tenders.


Related News

View more

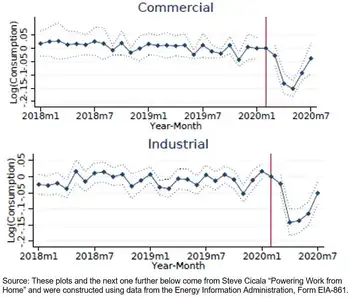
COVID-19 closures: It's as if Ottawa has fallen off the electricity grid

Ontario Electricity Demand Drop During COVID-19 reflects a 1,000-2,000 MW decline as IESO balances the grid, shifts peak demand later, throttles generators and baseload nuclear, and manages exports amid changing load curves.


Key Points

An about 10% reduction in Ontario's load, shifting peaks and requiring IESO grid balancing measures.

✅ Demand down 1,000-2,000 MW; roughly 10% below normal.

✅ Peak shifts later in morning as home use rises.

✅ IESO throttles generators; baseload nuclear stays online.


It’s as if the COVID-19 epidemic had tripped a circuit breaker, shutting off all power to a city the size of Ottawa.

Virus-induced restrictions that have shut down large swaths of normal commercial life across Canada has led to a noticeable drop in demand for power in Ontario and reflect a global demand dip according to reports, insiders said on Friday.

Terry Young, vice-president with the Independent Electricity System Operator, said planning was underway for further declines in usage and for whether Ontario will embrace more clean power in the long term, given the delicate balance that needs to be maintained between supply and demand.

“We’re now seeing demand that is running about 1,000 to 2,000 megawatts less than we would normally see,” Young said. “You’re essentially seeing a city the size of Ottawa drop off demand during the day.”

At the high end, a 2,000 megawatt reduction would be close to the equivalent peak demand of Ottawa and London, Ont., combined.

The decline, in the order of 10 per cent from the 17,000 to 18,000 megawatts of usage that might normally be expected and similar to the UK’s 10% drop reported during lockdowns, began last week, Young said. The downward trend became more noticeable as governments and health authorities ordered non-essential businesses to close and people to stay home. However, residential and hospital usage has climbed.

Experts say frequent hand-washing and staying away from others is the most effective way to curb the spread of the highly contagious coronavirus, which poses a special risk to older people and those with underlying health conditions. As a result, factories and other big users have reduced production or closed entirely.

Because electricity cannot be stored, generators need to throttle back their output as domestic demand shrinks and exports to places such as the United States, including New York City, which is also being hit hard by the coronavirus, fall.

“We’re watching this carefully,” Young said. “We’re able to manage this drop, but it’s something we obviously have to keep watching…and making sure we’re not over-generating electricity.”

Turning off generation, especially for nuclear plants, is an intensive process, as are restarts and would likely happen only if the downward demand trend intensifies significantly, amid concerns over Ontario’s electricity getting dirtier if baseload is displaced. However, one of North America’s largest generators, Bruce Power near Kincardine, Ont., said it had a large degree of flexibility to scale down or up.

“We have the ability to provide one-third of our output as a dynamic response, which is unique to our facility,” said James Scongack, an executive vice-president with Bruce Power. “We developed this coming out of the 2008 downturn and it’s been a critical system asset for the last decade.”

“We don’t see there being a scenario where our baseload will not be needed,” he said, even as some warn Ontario may be short of electricity in the coming years.

The province’s publicly owned Ontario Power Generation said it was also in conversations with the system operator, which provides direction to generators, and is often cited in the Ontario election discussion.

One clear shift in normal work-day usage with so many people staying at home has been the change in demand patterns. Typically, Young said, there’s a peak from about 7 a.m. to 8 a.m. as people wake and get ready to go to work or school. The peak is now occurring later in the morning, Young said.


Related News

View more

Here are 3 ways to find out where your electricity comes from

US energy mix shows how the electric grid blends renewables, fossil fuels, nuclear, and hydro, varying by ISO/RTO markets, utilities, and state policies, affecting carbon emissions, pricing, reliability, and access.


Key Points

The US energy mix is the grid's source breakdown by region: fossil fuels, renewables, nuclear, and hydro.

✅ Check ISO or RTO dashboards for real-time generation by fuel source.

✅ Utilities may offer green power plans or RECs at modest premiums.

✅ Energy mix shifts with policy, pricing, and grid reliability needs.


There are few resources more important than energy. Sure, you may die if you don't eat for days. But your phone will die if you go too long without charging it. Energy feeds tech, the internet, city infrastructure, refrigerators, lights, and has evolved throughout U.S. history in profound ways. You get the idea. Yet unlike our other common needs, such as food, energy sources aren't exactly front of mind for most people. 

"I think a lot of people don't put a lot of bandwidth into thinking about this part of their lives," said Richard McMahon, the SVP of energy supply and finance at Edison Electric Institute, a trade group that represents investor-owned electric companies in the US. 

It makes sense. For most Americans, electricity is always there, and in many locations, there's not much of a choice involved, even as electricity demand is flat across the U.S. today. You sign up with a utility when you move into a new residence and pay your bills when they're due. 

But there's an important reality that indifference eschews: In 2018, a third of the energy-related carbon-dioxide emissions in the US came from the electric power sector, according to the US Energy Information Administration (EIA). 

A good chunk of that is from the residential sector, which consistently uses more energy than commercial customers, per EIA data.

Just as many people exercise choice when they eat, you typically also have a choice when it comes to your energy supply. That's not to say your current offering isn't what you want, or that switching will be easy or affordable, but "if you're a customer and want power with a certain attribute," McMahon said, "you can pretty much get it wherever you are." 

But first, you need to know the energy mix you have right now. As it turns out, it's not so straightforward. At all.

This brief guide may help. 

For some utility providers, you can find out if it publishes the energy mix online. Dominion Energy, which serves Idaho, North Carolina, Ohio, South Carolina, Utah, Virginia, West Virginia, and Wyoming, provides this information in a colored graphic. 

"Once you figure out who your utility is you can figure out what mix of resources they use," said Heidi Ratz, an electricity markets researcher at the World Resources Institute.

But not all utilities publish this information.

It has to do with their role in the grid and reflects utility industry trends in structure and markets. Some utility companies are vertically integrated; they generate power through nuclear plants or wind farms and distribute those electrons directly to their customers. Other utilities just distribute the power that different companies produce. 

Consider Consolidated Edison, or Con Ed, which distributes energy to parts of New York City. While reporting this story, Business Insider could not find information about the utility's energy mix online. When reached for comment, a spokesperson said, "we're indifferent to where it comes from."

That's because, in New York, distribution utilities like Con Ed often buy energy through a wholesale marketplace.

Take a look at this map. If you live in one of the colored regions, your electricity is sold on a wholesale market regulated by an organization called a regional transmission organization (RTO) or independent system operator (ISO). Distribution utilities like Con Ed often buy their energy through these markets, based on availability and cost, while raising questions about future utility revenue models as prices shift. 

Still, it's pretty easy to figure out where your energy comes from. Just look up the ISO or RTO website (such as NYISO or CAISO). Usually, these organizations will provide energy supply information in near-real time. 

That's exactly what Con Edison (which buys energy on the NYISO marketplace) suggested. As of Friday morning, roughly 40% of the energy on the market place was natural gas or other fossil fuels, 34% was nuclear, and about 22% was hydro. 

If you live in another region governed by an ISO or RTO, such as in most of California, you can do the same thing. Like NYISO, CAISO has a dashboard that shows (again, as of Friday morning) about 36% of the energy on the market comes from natural gas and more than 20% comes from renewables. 

In the map linked above, you'll notice that some of the ISOs and RTOs like MISO encompass enormous regions. That means that even if you figure out where the energy in your market comes from, it's not going to be geographically specific. But there are a couple of ways to drill down even further. 

The Environmental Protection Agency has a straightforward tool called Power Profiler. You can enter your zip code to see the fuel mix in your area. But it's not perfect. The data are from 2016 and, in some regions of the country like the upper Midwest, they aren't much more localized, and some import dirty electricity due to regional trading. 

The World Resources Institute also has a tool that allows you to see the electricity mix by state, based on 2017 data from EIA. These numbers represent power generation, not the electricity actually flowing into your sockets, but they offer a rough idea of what energy resources are operating in your state. 

One option is to check with your utility to see if it has a "green power" offering. Over 600 utilities across the country have one, according to the Climate Reality Project, though they often come at a slightly higher cost. It's typically on the scale of just a few more cents per kilowatt-hour. 

There are also independent, consumer-facing companies like Arcadia and Green Mountain Energy that allow you to source renewable energy, by virtually connecting you to community solar projects or purchasing Renewable Energy Certificates, or RECs, on your behalf, as America goes electric and more options emerge. 

"RECs measure an investment in a clean energy resource," Ratz said, in an email. "The goal of putting that resource on the grid is to push out the need for dirtier resources."

The good news: Even if you do nothing, your energy mix will get cleaner. Coal production has fallen to lows not seen since the 1980s, amid disruptions in coal and nuclear sectors that affect reliability and costs, while renewable electricity generation has doubled since 2008. So whether you like it or not, you'll be roped into the clean energy boom one way or another. 


Related News

View more

How Bitcoin's vast energy use could burst its bubble

Bitcoin Energy Consumption drives debate on blockchain mining, proof-of-work, carbon footprint, and emissions, with CCAF estimates in terawatt hours highlighting electricity demand, fossil fuel reliance, and sustainability concerns for data centers and cryptocurrency networks.


Key Points

Electricity used by Bitcoin proof-of-work mining, often fossil-fueled, estimated by CCAF in terawatt hours.

✅ CCAF: 40-445 TWh, central estimate ~130 TWh

✅ ~66% of mining electricity sourced from fossil fuels

✅ Proof-of-work increases hash rate, energy, and emissions


The University of Cambridge Centre for Alternative Finance (CCAF) studies the burgeoning business of cryptocurrencies.

It calculates that Bitcoin's total energy consumption is somewhere between 40 and 445 annualised terawatt hours (TWh), with a central estimate of about 130 terawatt hours.

The UK's electricity consumption is a little over 300 TWh a year, while Argentina uses around the same amount of power as the CCAF's best guess for Bitcoin, as countries like New Zealand's electricity future are debated to balance demand.

And the electricity the Bitcoin miners use overwhelmingly comes from polluting sources, with the U.S. grid not 100% renewable underscoring broader energy mix challenges worldwide.

The CCAF team surveys the people who manage the Bitcoin network around the world on their energy use and found that about two-thirds of it is from fossil fuels, and some regions are weighing curbs like Russia's proposed mining ban amid electricity deficits.

Huge computing power - and therefore energy use - is built into the way the blockchain technology that underpins the cryptocurrency has been designed.

It relies on a vast decentralised network of computers.

These are the so-called Bitcoin "miners" who enable new Bitcoins to be created, but also independently verify and record every transaction made in the currency.

In fact, the Bitcoins are the reward miners get for maintaining this record accurately.

It works like a lottery that runs every 10 minutes, explains Gina Pieters, an economics professor at the University of Chicago and a research fellow with the CCAF team.

Data processing centres around the world, including hotspots such as Iceland's mining strain, race to compile and submit this record of transactions in a way that is acceptable to the system.

They also have to guess a random number.

The first to submit the record and the correct number wins the prize - this becomes the next block in the blockchain.

Estimates for bitcoin's electricity consumption
At the moment, they are rewarded with six-and-a-quarter Bitcoins, valued at about $50,000 each.

As soon as one lottery is over, a new number is generated, and the whole process starts again.

The higher the price, says Prof Pieters, the more miners want to get into the game, and utilities like BC Hydro suspending new crypto connections highlight grid pressures.

"They want to get that revenue," she tells me, "and that's what's going to encourage them to introduce more and more powerful machines in order to guess this random number, and therefore you will see an increase in energy consumption," she says.

And there is another factor that drives Bitcoin's increasing energy consumption.

The software ensures it always takes 10 minutes for the puzzle to be solved, so if the number of miners is increasing, the puzzle gets harder and the more computing power needs to be thrown at it.

Bitcoin is therefore actually designed to encourage increased computing effort.

The idea is that the more computers that compete to maintain the blockchain, the safer it becomes, because anyone who might want to try and undermine the currency must control and operate at least as much computing power as the rest of the miners put together.

What this means is that, as Bitcoin gets more valuable, the computing effort expended on creating and maintaining it - and therefore the energy consumed - inevitably increases.

We can track how much effort miners are making to create the currency.

They are currently reckoned to be making 160 quintillion calculations every second - that's 160,000,000,000,000,000,000, in case you were wondering.

And this vast computational effort is the cryptocurrency's Achilles heel, says Alex de Vries, the founder of the Digiconomist website and an expert on Bitcoin.

All the millions of trillions of calculations it takes to keep the system running aren't really doing any useful work.

"They're computations that serve no other purpose," says de Vries, "they're just immediately discarded again. Right now we're using a whole lot of energy to produce those calculations, but also the majority of that is sourced from fossil energy, and clean energy's 'dirty secret' complicates substitution."

The vast effort it requires also makes Bitcoin inherently difficult to scale, he argues.

"If Bitcoin were to be adopted as a global reserve currency," he speculates, "the Bitcoin price will probably be in the millions, and those miners will have more money than the entire [US] Federal budget to spend on electricity."

"We'd have to double our global energy production," he says with a laugh, even as some argue cheap abundant electricity is getting closer to reality today. "For Bitcoin."

He says it also limits the number of transactions the system can process to about five per second.

This doesn't make for a useful currency, he argues.

Rising price of bitcoin graphic
And that view is echoed by many eminent figures in finance and economics.

The two essential features of a successful currency are that it is an effective form of exchange and a stable store of value, says Ken Rogoff, a professor of economics at Harvard University in Cambridge, Massachusetts, and a former chief economist at the International Monetary Fund (IMF).

He says Bitcoin is neither.

"The fact is, it's not really used much in the legal economy now. Yes, one rich person sells it to another, but that's not a final use. And without that it really doesn't have a long-term future."

What he is saying is that Bitcoin exists almost exclusively as a vehicle for speculation.

So, I want to know: is the bubble about to burst?

"That's my guess," says Prof Rogoff and pauses.

"But I really couldn't tell you when."


Related News

View more

SC nuclear plant on the mend after a leak shut down production for weeks

V.C. Summer nuclear plant leak update: Dominion Energy repaired a valve in the reactor cooling system; radioactive water stayed within containment, NRC oversight continues as power output ramps toward full operation.


Key Points

A minor valve leak in the reactor cooling system contained onsite; Dominion repaired it as the plant resumes power.

✅ Valve leak in piping to steam generators, not environmental release.

✅ Radioactive water remained in containment, monitored per NRC rules.

✅ Plant ramping from 17% power; full operations may take days.


The V.C. Summer nuclear power plant, which has been shut down since early November because of a pipe leak, is expected to begin producing energy in a few days, a milestone comparable to a new U.S. reactor startup reported recently.

Dominion Energy says it has fixed the small leak in a pipe valve that allowed radioactive water to drip out. The company declined to say when the plant would be fully operational, but spokesman Ken Holt said that can take several days, amid broader discussions about the stakes of early nuclear closures across the industry.

The plant was at 17 percent power Wednesday, he said, as several global nuclear project milestones continue to be reported this year.

Holt, who said Dominion is still investigating the cause, said water that leaked was part of the reactor cooling system. While the water came in contact with nuclear fuel in the reactor, the water never escaped the plant's containment building and into the environment, Holt said.

He characterized the valve leak as '"uncommon" but not unexpected. The nuclear leak occurred in piping that links the nuclear reactor with the power plant's steam generators. Hundreds of pipes are in that part of the nuclear plant, a complexity often cited in the energy debate over struggling nuclear plants nationwide.

"There is always some level of leakage when you are operating, but it is contained and monitored, and when it rises to a certain level, you may take action to stop it," Holt said.

A nuclear safety watchdog has criticized Dominion for not issuing a public notice about the leak, but both the company and the U.S. Nuclear Regulatory Commission say the amount was so small it did not require notice.

The V.C. Summer Nuclear plant is about 25 miles northwest of Columbia in Fairfield County. It was licensed in the early 1980s. At one point, Dominion's predecessor, SCE&G, partnered with state owned Santee Cooper to build two more reactors there, even as new reactors in Georgia were taking shape. But the companies walked away from the project in 2017, citing high costs and troubles with its chief contractor, Westinghouse, even as closures such as Three Mile Island's shutdown continued to influence policy.


Related News

View more

Energy Department Announces 20 New Competitors for the American-Made Solar Prize

American-Made Solar Prize Round 3 accelerates DOE-backed solar innovation, empowering entrepreneurs and domestic manufacturing with photovoltaics and grid integration support via National Laboratories, incubators, and investors to validate products, secure funding, and deploy backup power.


Key Points

A DOE challenge fast-tracking solar innovation to market readiness, boosting US manufacturing and grid integration.

✅ $50,000 awards to 20 teams for prototype validation

✅ Access to National Labs, incubators, investors, and mentors

✅ Focus on PV advances and grid integration solutions


The U.S. Department of Energy (DOE) announced the 20 competitors who have been invited to advance to the next phase of the American-Made Solar Prize Round 3, a competition designed to incentivize the nation’s entrepreneurs to strengthen American leadership in solar energy innovation and domestic manufacturing, a key front in the clean energy race today.

The American-Made Solar Prize is designed to help more American entrepreneurs thrive in the competitive global energy market. Each round of the prize brings new technologies to pre-commercial readiness in less than a year, ensuring new ideas enter the marketplace. As part of the competition, teams will have access to a network of DOE National Laboratories, technology incubators and accelerators, and related DOE efforts like next-generation building upgrades, venture capital firms, angel investors, and industry. This American-Made Network will help these competitors raise private funding, validate early-stage products, or test technologies in the field.

Each team will receive a $50,000 cash prize and become eligible to compete in the next phase of the competition. Through a rigorous evaluation process, teams were chosen based on the novelty of their ideas and how their solutions address a critical need of the solar industry. The teams were selected from 120 submissions and represent 11 states. These projects will tackle challenges related to new solar applications, like farming, as well as show how solar can be used to provide backup power when the grid goes down, aided by increasingly affordable batteries now reaching scale. Nine teams will advance solar photovoltaic technologies, and 11 will address challenges related to how solar integrates with the grid. The projects are as follows:

Photovoltaics:

  • Durable Antireflective and Self-Cleaning Glass (Pittsburgh, PA)
  • Pursuit Solar - More Power, Less Hassle (Denver, NC)
  • PV WaRD (San Diego, CA)
  • Remotely Deployed Solar Arrays (Charlottesville, VA)
  • Robotics Changing the Landscape for Solar Farms (San Antonio, TX)
  • TrackerSled (Chicago, IL)
  • Transparent Polymer Barrier Films for PV (Bristol, PA)
  • Solar for Snow (Duluth, MN)
  • SolarWall Power Tower (Buffalo, NY)


Systems Integration:

  • Affordable Local Solar Storage via Utility Virtual Power Plants (Parker, TX)
  • Allbrand Solar Monitor (Detroit, MI)
  • Beyond Monitoring – Next Gen Software and Hardware (Atlanta, GA)
  • Democratizing Solar with Artificial Intelligence Energy Management (Houston, TX)
  • Embedded, Multi-Function Maximum Power Point Tracker for Smart Modules (Las Vegas, NV)
  • Evergrid: Keep Solar Flowing When the Grid Is Down (Livermore, CA)
  • Inverter Health Scan (San Jose, CA)
  • JuiceBox: Integrated Solar Electricity for Americans Transitioning out of Homelessness and Recovering from Natural Disasters (Claremont, CA)
  • Low-Cost Parallel-Connected DC Power Optimizer (Blacksburg, VA)
  • Powerfly: A Plug-and-Play Solar Monitoring Device (Berkeley, CA)
  • Simple-Assembly Storage Kit (San Antonio, TX)

Read the descriptions of the projects to see how they contribute to efforts to improve solar and wind power worldwide.

Over the next six months, these teams will fast-track their efforts to identify, develop, and test disruptive solutions amid record solar and storage growth projected nationwide. During a national demonstration day at Solar Power International in September 2020, a panel of judges will select two final winners who will receive a $500,000 prize. Learn more at the American-Made Solar Prize webpage.

The American-Made Challenges incentivize the nation's entrepreneurs to strengthen American leadership in energy innovation and domestic manufacturing. These new challenges seek to lower the barriers U.S.-based innovators face in reaching manufacturing scale by accelerating the cycles of learning from years to weeks while helping to create partnerships that connect entrepreneurs to the private sector and the network of DOE’s National Laboratories across the nation, alongside recent wind energy awards that complement solar innovation.

Go here to learn how this work aligns with a tenfold solar expansion being discussed nationally.

https://www.energy.gov/eere/solar/solar-energy-technologies-office


Related News

View more

Sign Up for Electricity Forum’s Newsletter

Stay informed with our FREE Newsletter — get the latest news, breakthrough technologies, and expert insights, delivered straight to your inbox.

Electricity Today T&D Magazine Subscribe for FREE

Stay informed with the latest T&D policies and technologies.
  • Timely insights from industry experts
  • Practical solutions T&D engineers
  • Free access to every issue

Download the 2025 Electrical Training Catalog

Explore 50+ live, expert-led electrical training courses –

  • Interactive
  • Flexible
  • CEU-cerified