NorthWestern wants to build or buy power plant

By Associated Press


Protective Relay Training - Basic

Our customized live online or in‑person group training can be delivered to your staff at your location.

  • Live Online
  • 12 hours Instructor-led
  • Group Training Available
Regular Price:
$699
Coupon Price:
$599
Reserve Your Seat Today
NorthWestern Energy says its best option for supplying power to its customers over the next 20 years is to buy or build another natural gas-fired power plant so it can rely less on contracts with PPL Montana.

NorthWestern filed its biennial electric supply plan with the state Public Service Commission. The plan continues the company's efforts to rebuild itself as a utility that owns power generation, rather than a company that distributes electricity purchased from others at market prices.

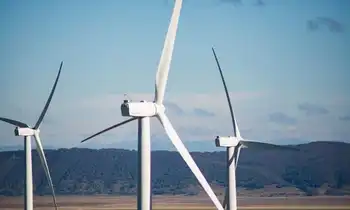
NorthWestern's plan also calls for adding 50 to 75 megawatts of wind power and increasing its customer conservation programs.

"We've been trying for the last few years to diversify the fuel mix so we're not dependent on any one resource or provider of electricity," said company spokeswoman Claudia Rapkoch.

The PSC will hear testimony on the plan this fall and then offer its recommendations.

Commissioner Ken Toole, D-Helena, said having NorthWestern buy or develop more of its own electricity generation facilities will protect consumers from a potentially volatile electricity market, but it will cost ratepayers more initially.

"I think we're better off with NorthWestern owning plants than being out in the market and going to PPL all the time," he said. "The bad news is its going to cost a lot of money."

PPL Montana has a contract to provide about one-third of the power needed by NorthWestern Energy through mid-2014. Its price is close to market rates.

NorthWestern's energy resource plan calls for buying or building gas-fired plants that can produce 200 to 300 megawatts of power to replace its contract with PPL Montana. The company also plans to start looking for smaller blocks of power on the open market in 2012 to help fill gaps in the portfolio over the next five years.

Rapkoch said those purchases could come from PPL Montana, if the price is right.

PPL Montana spokesman David Hoffman said the company sells "reliable power at a reliable price," and if NorthWestern wants to take advantage of that for customers "that's great." If not, he said the company will sell its power elsewhere, preferably in Montana.

"We continue to sell into the large industrial market in Montana and to a number of rural electric co-ops," Hoffman said.

NorthWestern also has long-term contracts to buy power from independently owned plants including the Judith Gap wind farm, the Basin Creek gas-fired plant near Butte along with 222 megawatts of coal-fired power from the Colstrip 4 plant.

Related News

UK low-carbon electricity generation stalls in 2019

UK low-carbon electricity 2019 saw stalled growth as renewables rose slightly, wind expanded, nuclear output fell, coal hit record lows, and net-zero targets demand faster deployment to cut CO2 intensity below 100gCO2/kWh.


Key Points

Low-carbon sources supplied 54% of UK power in 2019, up just 1TWh; wind grew, nuclear fell, and coal dropped to 2%.

✅ Wind up 8TWh; nuclear down 9TWh amid outages

✅ Fossil fuels 43% of generation; coal at 2%

✅ Net-zero needs 15TWh per year added to 2030


The amount of electricity generated by low-carbon sources in the UK stalled in 2019, Carbon Brief analysis shows.

Low-carbon electricity output from wind, solar, nuclear, hydro and biomass rose by just 1 terawatt hour (TWh, less than 1%) in 2019. It represents the smallest annual increase in a decade, where annual growth averaged 9TWh. This growth will need to double in the 2020s to meet UK climate targets while replacing old nuclear plants as they retire.

Some 54% of UK electricity generation in 2019 came from low-carbon sources, including 37% from renewables and 20% from wind alone, underscoring wind's leading role in the power mix during key periods. A record-low 43% was from fossil fuels, with 41% from gas and just 2% from coal, also a record low. In 2010, fossil fuels generated 75% of the total.

Carbon Brief’s analysis of UK electricity generation in 2019 is based on figures from BM Reports and the Department for Business, Energy and Industrial Strategy (BEIS). See the methodology at the end for more on how the analysis was conducted.

The numbers differ from those published earlier in January by National Grid, which were for electricity supplied in Great Britain only (England, Wales and Scotland, but excluding Northern Ireland), including via imports from other countries.

Low-carbon low
In 2019, the UK became the first major economy to target net-zero greenhouse gas emissions by 2050, increasing the ambition of its legally binding Climate Change Act.

To date, the country has cut its emissions by around two-fifths since 1990, with almost all of its recent progress coming from the electricity sector.

Emissions from electricity generation have fallen rapidly in the decade since 2010 as coal power has been almost phased out and even gas output has declined. Fossil fuels have been displaced by falling demand and by renewables, such as wind, solar and biomass.

But Carbon Brief’s annual analysis of UK electricity generation shows progress stalled in 2019, with the output from low-carbon sources barely increasing compared to a year earlier.

The chart below shows low-carbon generation in each year since 2010 (grey bars) and the estimated level in 2019 (red). The pale grey bars show the estimated future output of existing low-carbon sources after old nuclear plants retire and the pale red bars show the amount of new generation needed to keep electricity sector emissions to less than 100 grammes of CO2 per kilowatt hour (gCO2/kWh), the UK’s nominal target for the sector.

 Annual electricity generation in the UK by fuel, terawatt hours, 2010-2019. Top panel: fuel by fuel. Bottom panel: cumulative total generation from all sources. Source: BEIS energy trends, BM Reports and Carbon Brief analysis. Chart by Carbon Brief using Highcharts.
As the chart shows, the UK will require significantly more low-carbon electricity over the next decade as part of meeting its legally binding climate goals.

The nominal 100gCO2/kWh target for 2030 was set in the context of the UK’s less ambitious goal of cutting emissions to 80% below 1990 levels by 2050. Now that the country is aiming to cut emissions to net-zero by 2050, that 100gCO2/kWh indicator is likely to be the bare minimum.

Even so, it would require a rapid step up in the pace of low-carbon expansion, compared to the increases seen over the past decade. On average, low-carbon generation has risen by 9TWh each year in the decade since 2010 – including a rise of just 1TWh in 2019.

Given scheduled nuclear retirements and rising demand expected by the Committee on Climate Change (CCC) – with some electrification of transport and heating – low-carbon generation would need to increase by 15TWh each year until 2030, just to meet the benchmark of 100gCO2/kWh.

For context, the 3.2 gigawatt (GW) Hinkley C new nuclear plant being built in Somerset will generate around 25TWh once completed around 2026. The world’s largest offshore windfarm, the 1.2GW Hornsea One scheme off the Yorkshire coast, will generate around 5TWh each year.

The new Conservative government is targeting 40GW of offshore wind by 2030, up from today’s figure of around 8GW. If policies are put in place to meet this goal, then it could keep power sector emissions below 100gCO2/kWh, depending on the actual performance of the windfarms built.

However, new onshore wind and solar, further new nuclear or other low-carbon generation, such as gas with carbon capture and storage (CCS), is likely to be needed if demand is higher than expected, or if the 100gCO2/kWh benchmark is too weak in the context of net-zero by 2050.

The CCC says it is “likely” to “reflect the need for more rapid deployment” of low-carbon towards net-zero emissions in its advice on the sixth UK carbon budget for 2033-2037, due in September.

Trading places
Looking more closely at UK electricity generation in 2019, Carbon Brief’s analysis shows why there was so little growth for low-carbon sources compared to the previous year.

There was another increase for wind power in 2019 (up 8TWh, 14%), with record wind generation as several large new windfarms were completed including the 1.2GW Hornsea One project in October and the 0.6GW Beatrice offshore windfarm in Q2 of 2019. But this was offset by a decline for nuclear (down 9TWh, 14%), due to ongoing outages for reactors at Hunterston in Scotland and Dungeness in Kent.

(Analysis of data held by trade organisation RenewableUK suggests some 0.6GW of onshore wind capacity also started operating in 2019, including the 0.2GW Dorenell scheme in Moray, Scotland.)

As a result of these movements, the UK’s windfarms overtook nuclear for the first time ever in 2019, becoming the country’s second-largest source of electricity generation, and earlier, wind and solar together surpassed nuclear in the UK as momentum built. This is shown in the figure below, with wind (green line, top panel) trading places with nuclear (purple) and gas (dark blue) down around 25% since 2010 but remaining the single-largest source.

 Annual electricity generation in the UK by fuel, terawatt hours, 2010-2019. Top panel: fuel by fuel. Bottom panel: cumulative total generation from all sources. Source: BEIS energy trends, BM Reports and Carbon Brief analysis. Chart by Carbon Brief using Highcharts.
The UK’s currently suspended nuclear plants are due to return to service in January and March, according to operator EDF, the French state-backed utility firm. However, as noted above, most of the UK’s nuclear fleet is set to retire during the 2020s, with only Sizewell B in Suffolk due to still be operating by 2030. Hunterston is scheduled to retire by 2023 and Dungeness by 2028.

Set against these losses, the UK has a pipeline of offshore windfarms, secured via “contracts for difference” with the government, at a series of auctions. The most recent auction, in September 2019, saw prices below £40 per megawatt hour – similar to current wholesale electricity prices.

However, the capacity contracted so far is not sufficient to meet the government’s target of 40GW by 2030, meaning further auctions – or some other policy mechanism – will be required.

Coal zero
As well as the switch between wind and nuclear, 2019 also saw coal fall below solar for the first time across a full year, echoing the 2016 moment when wind outgenerated coal across the UK, after it suffered another 60% reduction in electricity output. Just six coal plants remain in the UK, with Aberthaw B in Wales and Fiddlers Ferry in Cheshire closing in March.

Coal accounted for just 2% of UK generation in 2019, a record-low coal share since centralised electricity supplies started to operate in 1882. The fuel met 40% of UK needs as recently as 2012, but has plummeted thanks to falling demand, rising renewables, cheaper gas and higher CO2 prices.

The reduction in average coal generation hides the fact that the fuel is now often not required at all to meet the UK’s electricity needs. The chart below shows the number of days each year when coal output was zero in 2019 (red line) and the two previous years (blue).

 Cumulative number of days when UK electricity generation from renewable sources has been higher than that from fossil fuels. Source: BEIS energy trends, BM Reports and Carbon Brief analysis. Chart by Carbon Brief using Highcharts.
The 83 days in 2019 with zero coal generation amount to nearly a quarter of the year and include the record-breaking 18-day stretch without the fuel.

Great Britain has been running for a record TWO WEEKS without using coal to generate electricity – the first time this has happened since 1882.

The country’s grid has been coal-free for 45% of hours in 2019 so far.https://www.carbonbrief.org/countdown-to-2025-tracking-the-uk-coal-phase-out …

Coal generation was set for significant reductions around the world in 2019 – including a 20% reduction for the EU as a whole – according to analysis published by Carbon Brief in November.

Notably, overall UK electricity generation fell by another 9TWh in 2019 (3%), bringing the total decline to 58TWh since 2010. This is equivalent to more than twice the output from the Hinkley C scheme being built in Somerset. As Carbon Brief explained last year, falling demand has had a similar impact on electricity-sector CO2 emissions as the increase in output from renewables.

This is illustrated by the fact that the 9TWh reduction in overall generation translated into a 9TWh (6%) cut in fossil-fuel generation during 2019, with coal falling by 10TWh and gas rising marginally.

Increasingly renewable
As fossil-fuel output and overall generation have declined, the UK’s renewable sources of electricity have continued to increase. Their output has risen nearly five-fold in the past decade and their share of the UK total has increased from 7% in 2010 to 37% in 2019.

As a result, the UK’s increasingly renewable grid is seeing more minutes, hours and days during which the likes of wind, solar and biomass collectively outpace all fossil fuels put together, and on some days wind is the main source as well.

The chart below shows the number of days during each year when renewables generated more electricity than fossil fuels in 2019 (red line) and each of the previous four years (blue lines). In total, nearly two-fifths of days in 2019 crossed this threshold.

 Cumulative number of days when the UK has not generated any electricity from coal. Source: BEIS energy trends, BM Reports and Carbon Brief analysis. Chart by Carbon Brief using Highcharts.
There were also four months in 2019 when renewables generated more of the UK’s electricity than fossil fuels: March, August, September and December. The first ever such month came in September 2018 and more are certain to follow.

National Grid, which manages Great Britain’s high-voltage electricity transmission network, is aiming to be able to run the system without fossil fuels by 2025, at least for short periods. At present, it sometimes has to ask windfarm operators to switch off and gas plants to start running in order to keep the electricity grid stable.

Note that biomass accounted for 11% of UK electricity generation in 2019, nearly a third of the total from all renewables. Some two-thirds of the biomass output is from “plant biomass”, primarily wood pellets burnt at Lynemouth in Northumberland and the Drax plant in Yorkshire. The remainder was from an array of smaller sites based on landfill gas, sewage gas or anaerobic digestion.

The CCC says the UK should “move away” from large-scale biomass power plants, once existing subsidy contracts for Drax and Lynemouth expire in 2027.

Using biomass to generate electricity is not zero-carbon and in some circumstances could lead to higher emissions than from fossil fuels. Moreover, there are more valuable uses for the world’s limited supply of biomass feedstock, the CCC says, including carbon sequestration and hard-to-abate sectors with few alternatives.

Methodology
The figures in the article are from Carbon Brief analysis of data from BEIS Energy Trends chapter 5 and chapter 6, as well as from BM Reports. The figures from BM Reports are for electricity supplied to the grid in Great Britain only and are adjusted to include Northern Ireland.

In Carbon Brief’s analysis, the BM Reports numbers are also adjusted to account for electricity used by power plants on site and for generation by plants not connected to the high-voltage national grid. This includes many onshore windfarms, as well as industrial gas combined heat and power plants and those burning landfill gas, waste or sewage gas.

By design, the Carbon Brief analysis is intended to align as closely as possible to the official government figures on electricity generated in the UK, reported in BEIS Energy Trends table 5.1.

Briefly, the raw data for each fuel is in most cases adjusted with a multiplier, derived from the ratio between the reported BEIS numbers and unadjusted figures for previous quarters.

Carbon Brief’s method of analysis has been verified against published BEIS figures using “hindcasting”. This shows the estimates for total electricity generation from fossil fuels or renewables to have been within ±3% of the BEIS number in each quarter since Q4 2017. (Data before then is not sufficient to carry out the Carbon Brief analysis.)

For example, in the second quarter of 2019, a Carbon Brief hindcast estimates gas generation at 33.1TWh, whereas the published BEIS figure was 34.0TWh. Similarly, it produces an estimate of 27.4TWh for renewables, against a BEIS figure of 27.1TWh.

National Grid recently shared its own analysis for electricity in Great Britain during 2019 via its energy dashboard, which differs from Carbon Brief’s figures.


Related News

View more

Energy-insecure households in the U.S. pay 27% more for electricity than others

Community Solar for Low-Income Homes expands energy equity by delivering renewable energy access, predictable bill savings, and tax credit benefits to renters and energy-insecure households, accelerating distributed generation and storage adoption nationwide.


Key Points

A program model enabling renters and LMI households to subscribe to off-site solar and save on utility bills.

✅ Earn bill credits from shared solar generation.

✅ Expands access for renters and LMI subscribers.

✅ Often paired with storage and IRA tax credit adders.


On a square-foot basis, the issue of inequality is made worse by higher costs for energy usage in the nation. Efforts like community solar programs such as Maryland community solar are underway to boost low-income participation in the cost benefits of renewable energy.

The Energy Information Administration (EIA) shows that households that are considered energy insecure, or those that have the inability to adequately meet basic household energy costs, are paying more for electricity than their wealthier counterparts. 

On average in the United States in 2020, households were billed about $1.04 per square foot for all energy sources. For homes that did not report energy insecurity, that average was $0.98 per square foot, while homes with energy insecurity issues paid an average of $1.24 per square foot for energy. This means that U.S. residents that need the most support on their energy bills are stuck with costs 27% higher than their neighbors on square-foot-basis.

EIA said energy-insecure households have reduced or forgone basic necessities to pay energy bills, kept their houses at unsafe temperatures because of energy cost concerns, or been unable to repair heating or cooling equipment because of cost.

In 2020, households with income less than $10,000 a year were billed an average of $1.31 per square foot for energy, while households making $100,000 or more were billed an average of $0.96 per square foot, said EIA. Renters paid considerably more ($1.28 per square foot) than owners ($0.98 per square foot). There were also considerable differences between regions, with New England solar growth sparking grid upgrade debates, ethnic groups and races, and insulation levels, as seen below.

The energy transition toward renewables like solar has offered price stability, amid record solar and storage growth nationwide, but thus far energy-insecure communities have relatively been left behind. A recent Berkeley Lab report, Residential Solar-Adopter Income and Demographic Trends, indicates that even though the rate of solar adoption among low-income residents is increasing (from 5% in 2010 to 11% in 2021), that segment of energy consumers remains under-represented among solar adopters, relative to its share of the population.


Community solar efforts

As such, the United States is targeting communities most impacted by energy costs that have not benefitted from the transition, highlighting “Energy Communities” that are eligible for an additional 10% tax credit through funds made possible by the Inflation Reduction Act.

Additionally, a push for community solar development is taking place nationwide to extend access to affordable solar energy to renters and other residents that aren’t able to leverage finances to invest in predictable, low-cost residential solar systems. The Biden Administration set a goal this year to sign up 5 million community solar households, achieving $1 billion in bill savings by 2025. The community solar model only represents about 8% of the total distributed solar capacity in the nation. This target would entail a jump from 3 GW installed capacity to 20 GW by the target year. The Department of Energy estimates community solar subscribers save an average of 20% on their bills.

California this year passed AB 2316, the Community Renewable Energy Act takes aim at four acute problems in the state’s power market: reliability amid rising outage risks, rates, climate and equity. The law creates a community renewable energy program, including community solar-plus-storage, supported by cheaper batteries, to overcome access barriers for nearly half of Californians who rent or have low incomes. Community solar typically involves customers subscribing to an off-site solar facility, receiving a utility bill credit for the power it generates.

“Community renewable energy is a proven powerful tool to help close California’s clean energy gap, bringing much needed relief to millions struggling with high housing costs and utility debt,” said Alexis Sutterman, energy equity program manager at the California Environmental Justice Alliance.

The program has energy equity baked into its structure, working to make sure Californians of all income levels participate in the benefits of the energy transition. Not only does it open solar access to renters, the law ensures that at least 51% of subscribers are low-income customers, which is expected to make projects eligible for a 10% tax credit adder under the IRA.

“The money’s on the table now,” said Jeff Cramer, president and chief executive of the Coalition for Community Solar Access. “While there are groups pushing for solar access for all, and states with strong legislation, there are other pockets of interest in surprising places in the United States. For example, Louisiana has no policy for community solar or support for low-income residents going solar but the city of New Orleans has its own utility commission with a community solar program. In Nebraska, forward-looking co-operatives have created community solar projects.

Community solar markets are active in 22 states, with more expected to come online in the future as states pursue 100% clean energy targets across the country. However, the market is expected to require strong community outreach efforts to foster trust and gain subscribers.

“There is a distrust of community solar initially in LMI communities as many have been burned before by retail energy false promises,” said Eric LaMora, executive director, community solar, Nautilus Solar on a panel at the Solar Energy Industries Association Finance, Tax, and Buyers seminar. “People are suspicious but there really are no hooks with community solar.”

LMI residents are leery to provide tax records or much documents at all in order to sign up for community solar, LaMora said. “We were surprised to see less of a default rate with LMI residents. We attribute this to the fact that they see significant savings on their electric bill, making it easier to pay each month,” he said.


Related News

View more

Energy prices trigger EU inflation, poor worst hit

EU Energy Price Surge is driving up electricity and gas costs, inflation, and cost of living across the EU, prompting tax cuts, price caps, subsidies, and household support measures in France, Italy, Spain, and Germany.


Key Points

A surge in EU gas and electricity costs driving inflation and prompting government subsidies, tax cuts, and price caps.

✅ Low-income EU households now spend 50-70 percent more on energy.

✅ Governments deploy tax cuts, price caps, and direct subsidies.

✅ Gas-dependent power markets drive electricity price spikes.


Higher energy prices, including for natural gas, are pushing up electricity prices and the cost of living for households across the EU, prompting governments to cut taxes and provide financial support to the tune of several billion euros.

In the United Kingdom, households are bracing for high winter energy bills this season.

A series of reports published by Cambridge Econometrics in October and November 2022 found that households in EU countries are spending much more on energy than in 2020 and that governments are spending billions of euros to help consumers pay bills and cut taxes.

In France, for example, the poorest households now spend roughly one-third more on energy than in 2020. Between August 2020 and August 2022, household energy prices increased by 37 percent, while overall inflation increased by 9.2 percent.

“We estimate that the increase in household energy prices make an average French household €410 worse off in 2022 compared to 2020, mostly due to higher gas prices,” said the report.

In response to rising energy prices, the French government has adopted price caps and support measures forecast to cost over €71 billion, equivalent to 2.9 percent of French GDP, according to the U.K.-based consultancy.

In Italy, fossil fuels alone were responsible for roughly 30 percent of the country’s annual rate of inflation during spring 2022, according to Cambridge Econometrics. Unlike in other European countries, retail electricity prices have outpaced other energy prices in Italy and were 112 percent higher in July 2022 than in August 2020, the report found. Over the same time period, retail petrol prices were up 14 percent, diesel up 22 percent, and natural gas up 42 percent.

We estimate that households in the lowest-income quintile now spend about 50 percent more on energy than in 2020.

“We estimate that before government support, an average Italian household will be spending around €1,400 more on energy and fuel bills this year than in 2020,” the report said. “Low-income households are worse affected by the increasing energy prices: we estimate that households in the lowest-income quintile now spend about 50 percent more on energy than in 2020.”

Electricity production in Italy is dominated by natural gas, which has also led to a spike in wholesale electricity prices. In 2010, natural gas accounted for 50 percent of all electricity production. The share of natural gas fell to 33 percent in 2014, but then rose again, reaching 48 percent in 2021, and 56 percent in the first half of 2022, according to the report, as gas filled the gap of record low hydro power production in 2022.

In Spain, where electricity prices have seen extreme spikes, low-income households are now spending an estimated 70% more on energy than in 2020, according to Cambridge Econometrics.


Low-income squeeze
In Spain, low-income households are now spending an estimated 70% more on energy than in 2020, according to Cambridge Econometrics. It noted that the Spanish government has intervened heavily in energy markets by cutting taxes, introducing cash transfers for households, and capping the price of natural gas for power generators. The latter has led to lower electricity prices than in many other EU countries.

These support measures are forecast to cost the Spanish government over €35 billion, equivalent to nearly 3 percent of Spain’s GDP. Yet consumers will still feel the burden of higher costs of living, and rolling back electricity prices may prove difficult in the near term.

In March, electricity prices alone were responsible for 45 percent of year-on-year inflation in Spain but prices have since fallen as a result of government intervention, Cambridge Econometrics said. Between May and July, fossil fuels prices accounted for 19-25 percent of the overall inflation rate, and electricity prices for 16 percent.


Support measures
Rising inflation is also a real challenge in Germany, Europe’s largest economy, where German power prices have surged this year, adding pressure. Also there, higher gas prices are to blame.

“We estimate that the increase in energy prices currently make an average household €735 worse off in 2022 compared to 2020, mostly due to higher gas prices,” Cambridge Econometrics said, in a report focused on Germany.

The German government has introduced a number of support measures in order to help households, businesses and industry to pay energy bills, amid rising heating and electricity costs for consumers, including price caps that are expected to take effect in March next year. Moreover, households’ energy bills for December this year will be paid by the state. According to the report, these interventions will mitigate the impact of higher prices “to some extent”, but the aid measures are forecast to cost the government nearly 5 percent of GDP.


Fossil-fuel effect
In addition to gas, higher coal prices have also pushed up inflation in some countries, and U.S. electricity prices have reached multi-decade highs as inflation endures.

In Poland, which is heavily dependent on coal for electricity generation, fossil fuels accounted for roughly 40 percent of Poland’s overall year-on-year inflation rate in June 2022, which stood at over 14 percent, the consultancy said.

The price of household coal, which is widely used in heating Polish homes, increased by 157 percent between August 2021 and August 2022.

Higher energy prices in Poland are partly due to Polish and EU sanctions against Russian gas and coal. Other drivers are the weakening of the Polish zloty against the U.S. dollar and the euro, and the uptick in global demand after COVID-19 lockdowns, said Cambridge Econometrics.

Electricity prices have risen at a much slower pace than energy for transport and heating, with an annualized increase of 5.1 percent.


Related News

View more

FPL Proposes Significant Rate Hikes Over Four Years

FPL Rate Increase Proposal 2026-2029 outlines $9B base-rate hikes as Florida grows, citing residential demand, grid infrastructure investments, energy mix diversification, and Florida PSC review impacting customer bills, reliability, and fuel price volatility mitigation.


Key Points

A $9B base-rate plan FPL filed with the Florida PSC to fund growth, grid upgrades, and energy diversification through 2029.

✅ Adds 275k since 2021; +335k customers projected by 2029.

✅ Monthly bills rise to about $157 by 2029, up ~22% total.

✅ Investments in poles, wires, transformers, substations, renewables.


Florida Power & Light (FPL), the state's largest utility provider, has submitted a proposal to the Florida Public Service Commission (PSC) seeking a substantial increase in customer base rates over the next four years, amid ongoing scrutiny, including a recent hurricane surcharge controversy that heightened public attention.

Rationale Behind the Rate Increase

FPL's request is primarily influenced by Florida's robust population growth. Since 2021, the utility has added about 275,000 customers and projects an additional 335,000 by the end of 2029. This surge necessitates significant investments in transmission and distribution infrastructure, including poles, wires, transformers, and substations, to maintain reliable service. Moreover, FPL aims to diversify its energy mix to shield customers from fuel price volatility, even as the state declined federal solar incentives that could influence renewable adoption, ensuring a stable and sustainable power supply.

Impact on Customer Bills

If approved, the proposed rate increases would affect residential customers as follows:

  • 2026: An estimated increase of $11.52 per month, raising the typical bill to $145.66.

  • 2027: An additional $6.05 per month, bringing the bill to $151.71.

  • 2028: A further increase of $3.64 per month, totaling $155.35.

  • 2029: An extra $2.06 per month, resulting in a final bill of $157.41.

These adjustments represent a cumulative increase of approximately 22% over the four-year period, while in other regions some customers face sharper spikes, such as Pennsylvania's winter price increases this season.

Comparison with Previous Rate Hikes

This proposal follows a series of rate increases approved in recent years, as California electricity bills have soared and prompted calls for action in that state. For instance, Tampa Electric Co. (TECO) received approval for rate hikes totaling $287.9 million in 2025, with additional increases planned for 2026 and 2027. Consumer groups have expressed intentions to challenge these rate hikes, indicating a trend of growing scrutiny over utility rate adjustments.

Regulatory Review Process

The PSC is scheduled to review FPL's rate increase proposal in the coming months. A staff recommendation is expected by March 14, 2025, with a final decision anticipated at a commission conference on March 20, 2025. This process allows for public input and thorough evaluation of the proposed rate changes, while elsewhere some utilities anticipate stabilization, such as PG&E's 2025 outlook in California.

Customer and Consumer Advocacy Responses

The proposed rate hikes have elicited concerns from consumer advocacy groups. Organizations like Food & Water Watch have criticized the scale of the increase, labeling it as the largest rate hike request in U.S. history, amid mixed signals such as Gulf Power's one-time 40% bill decrease earlier this year. They argue that such substantial increases could place undue financial strain on households, especially those with fixed incomes.

Additionally, the Florida Public Service Commission has faced challenges in approving rate hikes for other utilities, such as TECO, and a recent Florida court decision on electricity monopolies that may influence the policy landscape, with consumer groups planning to appeal these decisions. This backdrop of heightened scrutiny suggests that FPL's proposal will undergo rigorous examination.

As Florida continues to experience rapid growth, balancing the need for infrastructure development and reliable energy services with the financial impact on consumers remains a critical challenge. The PSC's forthcoming decisions will play a pivotal role in shaping the state's energy landscape, influencing both the economy and the daily lives of Floridians.


Related News

View more

Dubai Planning Large-Scale Solar Powered Hydrogen Production

Dubai Green Hydrogen advances electrolysis at the Mohammed Bin Rashid Al Maktoum Solar Park, with DEWA and Siemens enabling clean energy storage, re-electrification, and fuel-cell mobility for Expo 2020 Dubai and public transport.


Key Points

Dubai Green Hydrogen is a DEWA-Siemens project making solar hydrogen for storage, mobility, and reelectrification.

✅ Electrolysis at Mohammed Bin Rashid Al Maktoum Solar Park

✅ Partners: DEWA and Siemens; public-private demonstration plant

✅ Hydrogen for buses, re-electrification, and energy storage


Something you hear frequently if you are a clean tech aficionado is that excess solar and wind power can be used to split water into oxygen and hydrogen. The Dubai Supreme Council of Energy, the 2020 Dubai Higher Committee and the Dubai Electricity and Water Authority broke ground in early February on a solar power hydrogen electrolysis facility located in the Mohammed Bin Rashid Al Maktoum Solar Park, and related initiatives like the Solar Decathlon Middle East underscore Dubai's clean energy focus. Sheikh Ahmed bin Saeed Al Maktoum, chairman of the Dubai Supreme Council of Energy and chairman of the Expo 2020 Dubai Higher Committee, participated in the groundbreaking ceremony, according to a report by Khaleej Times.

Saeed Mohammed Al Tayer, CEO of DEWA, said at the groundbreaking ceremony the project is important to understanding the limits of green hydrogen technology and how it can contribute to the UAE’s vision of clean energy, and aligns with DEWA's latest renewable initiatives now progressing in the emirate. “This pioneering project is a role model for strategic partnerships between the public and private sectors. It will contribute to developing the green economy concept in the UAE and explore the potential of green hydrogen technology. The hydrogen produced at the facility will be stored and deployed for re-electrification, transportation and other uses.”

Siemens is providing much of the technology that will be used at the demonstration facility, while DEWA expands its China outreach to woo renewable energy firms that can contribute to the ecosystem. Joe Kaeser, president and CEO of Siemens, said the UAE was the perfect location for Siemens to test the technology, building on advances in offshore green hydrogen the company is pursuing. One of the primary uses of the hydrogen produced will be to power Dubai’s public transportation system.

“We are aware of the stress that is placed on vehicles in this region due to the high levels of heat; with hydrogen cells, you are not putting as much strain on the vehicle and that improves its longevity,” Kaeser said. “However, this is only the first step and we are eager to explore more ways in which we can adapt the technology to other sectors. The interest from various companies and partners has been immense and we are eager to work with all interested parties.”

“Dewa, Expo 2020 Dubai and Siemens are working together to help realize His Highness Sheikh Mohammed bin Rashid Al Maktoum, Vice-President and Prime Minister of the UAE and Ruler of Dubai’s, vision to identify new energy resources and provide sustainable power as part of a balanced approach that prioritizes the environment. Our aim is to make Dubai a model of energy efficiency and safety,” said Sheikh Ahmed.

Expo 2020 Dubai intends to use the hydrogen generated at the facility to transport visitors to the Expo 2020 Dubai and the Mohammed bin Rashid Al Maktoum Solar Park, reflecting regional momentum such as Saudi Arabia's clean energy plans over the next decade, in hydrogen fuel cell powered vehicles. Live data of the green hydrogen electrolysis will be displayed at Expo 2020 Dubai to help inform broader efforts like hydrogen hubs in the United States.


Related News

View more

COVID-19 Pandemic Puts $35 Billion in Wind Energy Investments at Risk, Says Industry Group

COVID-19 Impact on U.S. Wind Industry: disrupting wind power projects, tax credits, and construction timelines, risking rural revenues, jobs, and $35B investments; AWEA seeks Congressional flexibility as OEM shutdowns like Siemens Gamesa intensify delays.


Key Points

Pandemic disruptions threaten 25 GW of projects, $35B investment, rural revenues, jobs, and tax-credit timelines.

✅ 25 GW at risk; $35B investment jeopardized

✅ Rural taxes and land-lease payments may drop $8B

✅ AWEA seeks Congressional flexibility on tax-credit deadlines


In one of the latest examples of the havoc that the novel coronavirus is wreaking on the U.S. economy and the crisis hitting solar and wind sector alike, the American Wind Energy Association (AWEA) -- the national trade association for the U.S. wind industry -- yesterday stated its concerns that COVID-19 will "pose significant challenges to the American wind power industry." According to AWEA's calculations, the disease is jeopardizing the development of approximately 25 gigawatts of wind projects, representing $35 billion in investments, even as wind additions persist in some markets amid the pandemic.

Rural communities, where about 99% of wind projects are located, in particular, face considerable risk. The AWEA estimates that rural communities stand to lose about $8 billion in state and local tax payments and land-lease payments to private landowners. In addition, it's estimated that the pandemic threatens the loss of over 35,000 jobs, and the U.S. wind jobs outlook underscores the stakes, including wind turbine technicians, construction workers, and factory workers.

The development of wind projects is heavily reliant on the earning of tax credits, and debates over a Solar ITC extension highlight potential impacts on wind. However, in order to qualify for the current credits, project developers are bound to begin construction before Dec. 31, 2020. With local and state governments implementing various measures to stop the spread of the virus, the success of project developers' meeting this deadline is dubious, as utility-scale solar construction slows nationwide due to COVID-19. Addressing this and other challenges, the AWEA is turning to the government for help. In the trade association's press release, it states that "to protect the industry and these workers, AWEA is asking Congress for flexibility in allowing existing policies to continue working for the industry through this period of uncertainty."

Illustrating one of the ways in which COVID-19 is affecting the industry, Siemens Gamesa, a global leader in the manufacturing of wind turbines, closed a second Spanish factory this week after learning that a second of its employees had tested positive for the novel coronavirus.


Related News

View more

Sign Up for Electricity Forum’s Newsletter

Stay informed with our FREE Newsletter — get the latest news, breakthrough technologies, and expert insights, delivered straight to your inbox.

Electricity Today T&D Magazine Subscribe for FREE

Stay informed with the latest T&D policies and technologies.
  • Timely insights from industry experts
  • Practical solutions T&D engineers
  • Free access to every issue

Download the 2025 Electrical Training Catalog

Explore 50+ live, expert-led electrical training courses –

  • Interactive
  • Flexible
  • CEU-cerified