IESO appeals for reduced electricity consumption in the GTA

By Canada News Wire


CSA Z462 Arc Flash Training - Electrical Safety Essentials

Our customized live online or in‑person group training can be delivered to your staff at your location.

  • Live Online
  • 6 hours Instructor-led
  • Group Training Available
Regular Price:
$249
Coupon Price:
$199
Reserve Your Seat Today
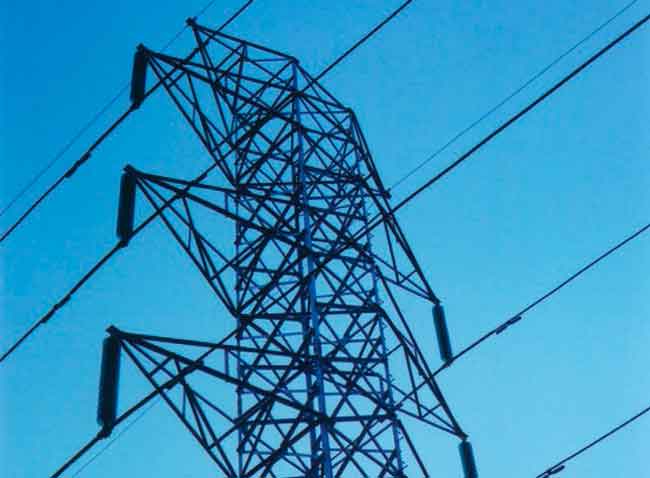
The Independent Electricity System Operator (IESO) is asking consumers in the Greater Toronto Area (GTA) to reduce their use of electricity during peak demand times for June 26 and 27.

High temperatures and high humidity levels are resulting in increased demand for electricity through air conditioning use. There are also limitations on the generation and transmission system serving the GTA as a result of equipment outages.

As a precautionary measure, the IESO is asking customers to reduce demand to help relieve the strain on the system serving the GTA. Curtailment efforts can reduce demand and provide additional operating flexibility to help maintain reliability in the area should further problems develop.

Residential and business consumers are being asked to reduce their electricity consumption, where possible, between noon and 8:00 p.m. over the next two days.

Consumers can reduce the demands on the electricity system between noon and 8:00 p.m. by:

- Turning off all but essential internal and external lights;

- Set air conditioners to 26 degrees Celsius or higher, or use fans as an alternative;

- Close curtains and blinds to keep out the sun and retain cooler air inside; and

- Limit the use of major power-consuming equipment such as dishwashers, washers and dryers and swimming pool pumps.

Related News

B.C. Hydro misled regulator: report

BC Hydro SAP Oversight Report assesses B.C. Utilities Commission findings on misleading testimony, governance failures, public funds oversight, IT project risk, compliance gaps, audit controls, ratepayer impacts, and regulatory accountability in major enterprise software decisions.


Key Points

A summary of BCUC findings on BC Hydro's SAP IT project oversight, governance lapses, and regulatory compliance.

✅ BCUC probed testimony, cost overruns, and governance failures

✅ Project split to avoid scrutiny; incomplete records and late corrections

✅ Reforms pledged: stronger business cases, compliance, audit controls


B.C. Hydro misled the province’s independent regulator about an expensive technology program, thereby avoiding scrutiny on how it spent millions of dollars in public money, according to a report by the B.C. Utilities Commission.

The Crown power corporation gave inaccurate testimony to regulators about the software it had chosen, called SAP, for an information technology project that has cost $197 million, said the report.

“The way the SAP decision was made prevented its appropriate scrutiny by B.C. Hydro’s board of directors and the BCUC, reflecting governance risks seen in Manitoba Hydro board changes in other jurisdictions,” the commission found.

“B.C. Hydro’s CEO and CFO and its (audit and risk management board committee) members did not exhibit good business judgment when reviewing and approving the SAP decision without an expenditure approval or business case, highlighting how board upheaval at Hydro One can carry market consequences.”

The report was the result of a complaint made in 2016 by then-opposition NDP MLA Adrian Dix, who alleged B.C. Hydro lied to the regulatory commission to try to get approval for a risky IT project in 2008 that then went over budget and resulted in the firing of Hydro’s chief information officer.

The commission spent two years investigating. Its report outlined how B.C. Hydro split the IT project into smaller components to avoid scrutiny, failed to produce the proper planning document when asked, didn’t disclose cost increases of up to $38 million, reflecting pressures seen at Manitoba Hydro's debt across the sector, gave incomplete testimony and did not quickly correct the record when it realized the mistakes.

“Essentially all of the things I asserted were substantiated, and so I’m pleased,” Dix, who is now minister of health, said on Monday. “I think ratepayers can be pleased with it, because even though it was an elaborate process, it involves hundreds of millions of spending by a public utility and it clearly required oversight.”

The BCUC stopped short of agreeing with Dix’s allegation that the errors were deliberate. Instead it pointed toward a culture at B.C. Hydro of confusion, misunderstanding and fear of dealing with the independent regulatory process.

“Therefore, the panel finds that there was a culture of reticence to inform the BCUC when there was doubt about something, even among individuals that understood or should have understood the role of the BCUC, a pattern that can fuel Hydro One investor concerns in comparable markets,” read the report.

“Because of this doubt and uncertainty among B.C. Hydro staff, the panel finds no evidence to support a finding that the BCUC was intentionally misled. The panel finds B.C. Hydro’s culture of reticence to be inappropriate.”

By law, B.C. Hydro is supposed to get approval by the commission for rate changes and major expenditures. Its officials are often put under oath when providing information.

B.C. Hydro apologized for its conduct in 2016. The Crown corporation said Monday it supports the commission’s findings and has made improvements to management of IT projects, including more rigorous business case analyses.

“We participated fully in the commission’s process and acknowledged throughout the inquiry that we could have performed better during the regulatory hearings in 2008,” said spokesperson Tanya Fish.

“Since then, we have taken steps to ensure we meet the highest standards of openness and transparency during regulatory proceedings, including implementing a (thorough) awareness program to support staff in providing transparent and accurate testimony at all times during a regulatory process.”

The Ministry of Energy, which is responsible for B.C. Hydro, said in a statement it accepts all of the BCUC recommendations and will include the findings as part of a review it is conducting into Hydro’s operations and finances, including its deferred operating costs for context, and regulatory oversight.

Dix, who is now grappling with complex IT project management in his Health Ministry, said the lessons learned by B.C. Hydro and outlined in the report are important.

“I think the report is useful reading on all those scores,” he said. “It’s a case study in what shouldn’t happen in a major IT project.”


Related News

View more

UK low-carbon electricity generation stalls in 2019

UK low-carbon electricity 2019 saw stalled growth as renewables rose slightly, wind expanded, nuclear output fell, coal hit record lows, and net-zero targets demand faster deployment to cut CO2 intensity below 100gCO2/kWh.


Key Points

Low-carbon sources supplied 54% of UK power in 2019, up just 1TWh; wind grew, nuclear fell, and coal dropped to 2%.

✅ Wind up 8TWh; nuclear down 9TWh amid outages

✅ Fossil fuels 43% of generation; coal at 2%

✅ Net-zero needs 15TWh per year added to 2030


The amount of electricity generated by low-carbon sources in the UK stalled in 2019, Carbon Brief analysis shows.

Low-carbon electricity output from wind, solar, nuclear, hydro and biomass rose by just 1 terawatt hour (TWh, less than 1%) in 2019. It represents the smallest annual increase in a decade, where annual growth averaged 9TWh. This growth will need to double in the 2020s to meet UK climate targets while replacing old nuclear plants as they retire.

Some 54% of UK electricity generation in 2019 came from low-carbon sources, including 37% from renewables and 20% from wind alone, underscoring wind's leading role in the power mix during key periods. A record-low 43% was from fossil fuels, with 41% from gas and just 2% from coal, also a record low. In 2010, fossil fuels generated 75% of the total.

Carbon Brief’s analysis of UK electricity generation in 2019 is based on figures from BM Reports and the Department for Business, Energy and Industrial Strategy (BEIS). See the methodology at the end for more on how the analysis was conducted.

The numbers differ from those published earlier in January by National Grid, which were for electricity supplied in Great Britain only (England, Wales and Scotland, but excluding Northern Ireland), including via imports from other countries.

Low-carbon low
In 2019, the UK became the first major economy to target net-zero greenhouse gas emissions by 2050, increasing the ambition of its legally binding Climate Change Act.

To date, the country has cut its emissions by around two-fifths since 1990, with almost all of its recent progress coming from the electricity sector.

Emissions from electricity generation have fallen rapidly in the decade since 2010 as coal power has been almost phased out and even gas output has declined. Fossil fuels have been displaced by falling demand and by renewables, such as wind, solar and biomass.

But Carbon Brief’s annual analysis of UK electricity generation shows progress stalled in 2019, with the output from low-carbon sources barely increasing compared to a year earlier.

The chart below shows low-carbon generation in each year since 2010 (grey bars) and the estimated level in 2019 (red). The pale grey bars show the estimated future output of existing low-carbon sources after old nuclear plants retire and the pale red bars show the amount of new generation needed to keep electricity sector emissions to less than 100 grammes of CO2 per kilowatt hour (gCO2/kWh), the UK’s nominal target for the sector.

 Annual electricity generation in the UK by fuel, terawatt hours, 2010-2019. Top panel: fuel by fuel. Bottom panel: cumulative total generation from all sources. Source: BEIS energy trends, BM Reports and Carbon Brief analysis. Chart by Carbon Brief using Highcharts.
As the chart shows, the UK will require significantly more low-carbon electricity over the next decade as part of meeting its legally binding climate goals.

The nominal 100gCO2/kWh target for 2030 was set in the context of the UK’s less ambitious goal of cutting emissions to 80% below 1990 levels by 2050. Now that the country is aiming to cut emissions to net-zero by 2050, that 100gCO2/kWh indicator is likely to be the bare minimum.

Even so, it would require a rapid step up in the pace of low-carbon expansion, compared to the increases seen over the past decade. On average, low-carbon generation has risen by 9TWh each year in the decade since 2010 – including a rise of just 1TWh in 2019.

Given scheduled nuclear retirements and rising demand expected by the Committee on Climate Change (CCC) – with some electrification of transport and heating – low-carbon generation would need to increase by 15TWh each year until 2030, just to meet the benchmark of 100gCO2/kWh.

For context, the 3.2 gigawatt (GW) Hinkley C new nuclear plant being built in Somerset will generate around 25TWh once completed around 2026. The world’s largest offshore windfarm, the 1.2GW Hornsea One scheme off the Yorkshire coast, will generate around 5TWh each year.

The new Conservative government is targeting 40GW of offshore wind by 2030, up from today’s figure of around 8GW. If policies are put in place to meet this goal, then it could keep power sector emissions below 100gCO2/kWh, depending on the actual performance of the windfarms built.

However, new onshore wind and solar, further new nuclear or other low-carbon generation, such as gas with carbon capture and storage (CCS), is likely to be needed if demand is higher than expected, or if the 100gCO2/kWh benchmark is too weak in the context of net-zero by 2050.

The CCC says it is “likely” to “reflect the need for more rapid deployment” of low-carbon towards net-zero emissions in its advice on the sixth UK carbon budget for 2033-2037, due in September.

Trading places
Looking more closely at UK electricity generation in 2019, Carbon Brief’s analysis shows why there was so little growth for low-carbon sources compared to the previous year.

There was another increase for wind power in 2019 (up 8TWh, 14%), with record wind generation as several large new windfarms were completed including the 1.2GW Hornsea One project in October and the 0.6GW Beatrice offshore windfarm in Q2 of 2019. But this was offset by a decline for nuclear (down 9TWh, 14%), due to ongoing outages for reactors at Hunterston in Scotland and Dungeness in Kent.

(Analysis of data held by trade organisation RenewableUK suggests some 0.6GW of onshore wind capacity also started operating in 2019, including the 0.2GW Dorenell scheme in Moray, Scotland.)

As a result of these movements, the UK’s windfarms overtook nuclear for the first time ever in 2019, becoming the country’s second-largest source of electricity generation, and earlier, wind and solar together surpassed nuclear in the UK as momentum built. This is shown in the figure below, with wind (green line, top panel) trading places with nuclear (purple) and gas (dark blue) down around 25% since 2010 but remaining the single-largest source.

 Annual electricity generation in the UK by fuel, terawatt hours, 2010-2019. Top panel: fuel by fuel. Bottom panel: cumulative total generation from all sources. Source: BEIS energy trends, BM Reports and Carbon Brief analysis. Chart by Carbon Brief using Highcharts.
The UK’s currently suspended nuclear plants are due to return to service in January and March, according to operator EDF, the French state-backed utility firm. However, as noted above, most of the UK’s nuclear fleet is set to retire during the 2020s, with only Sizewell B in Suffolk due to still be operating by 2030. Hunterston is scheduled to retire by 2023 and Dungeness by 2028.

Set against these losses, the UK has a pipeline of offshore windfarms, secured via “contracts for difference” with the government, at a series of auctions. The most recent auction, in September 2019, saw prices below £40 per megawatt hour – similar to current wholesale electricity prices.

However, the capacity contracted so far is not sufficient to meet the government’s target of 40GW by 2030, meaning further auctions – or some other policy mechanism – will be required.

Coal zero
As well as the switch between wind and nuclear, 2019 also saw coal fall below solar for the first time across a full year, echoing the 2016 moment when wind outgenerated coal across the UK, after it suffered another 60% reduction in electricity output. Just six coal plants remain in the UK, with Aberthaw B in Wales and Fiddlers Ferry in Cheshire closing in March.

Coal accounted for just 2% of UK generation in 2019, a record-low coal share since centralised electricity supplies started to operate in 1882. The fuel met 40% of UK needs as recently as 2012, but has plummeted thanks to falling demand, rising renewables, cheaper gas and higher CO2 prices.

The reduction in average coal generation hides the fact that the fuel is now often not required at all to meet the UK’s electricity needs. The chart below shows the number of days each year when coal output was zero in 2019 (red line) and the two previous years (blue).

 Cumulative number of days when UK electricity generation from renewable sources has been higher than that from fossil fuels. Source: BEIS energy trends, BM Reports and Carbon Brief analysis. Chart by Carbon Brief using Highcharts.
The 83 days in 2019 with zero coal generation amount to nearly a quarter of the year and include the record-breaking 18-day stretch without the fuel.

Great Britain has been running for a record TWO WEEKS without using coal to generate electricity – the first time this has happened since 1882.

The country’s grid has been coal-free for 45% of hours in 2019 so far.https://www.carbonbrief.org/countdown-to-2025-tracking-the-uk-coal-phase-out …

Coal generation was set for significant reductions around the world in 2019 – including a 20% reduction for the EU as a whole – according to analysis published by Carbon Brief in November.

Notably, overall UK electricity generation fell by another 9TWh in 2019 (3%), bringing the total decline to 58TWh since 2010. This is equivalent to more than twice the output from the Hinkley C scheme being built in Somerset. As Carbon Brief explained last year, falling demand has had a similar impact on electricity-sector CO2 emissions as the increase in output from renewables.

This is illustrated by the fact that the 9TWh reduction in overall generation translated into a 9TWh (6%) cut in fossil-fuel generation during 2019, with coal falling by 10TWh and gas rising marginally.

Increasingly renewable
As fossil-fuel output and overall generation have declined, the UK’s renewable sources of electricity have continued to increase. Their output has risen nearly five-fold in the past decade and their share of the UK total has increased from 7% in 2010 to 37% in 2019.

As a result, the UK’s increasingly renewable grid is seeing more minutes, hours and days during which the likes of wind, solar and biomass collectively outpace all fossil fuels put together, and on some days wind is the main source as well.

The chart below shows the number of days during each year when renewables generated more electricity than fossil fuels in 2019 (red line) and each of the previous four years (blue lines). In total, nearly two-fifths of days in 2019 crossed this threshold.

 Cumulative number of days when the UK has not generated any electricity from coal. Source: BEIS energy trends, BM Reports and Carbon Brief analysis. Chart by Carbon Brief using Highcharts.
There were also four months in 2019 when renewables generated more of the UK’s electricity than fossil fuels: March, August, September and December. The first ever such month came in September 2018 and more are certain to follow.

National Grid, which manages Great Britain’s high-voltage electricity transmission network, is aiming to be able to run the system without fossil fuels by 2025, at least for short periods. At present, it sometimes has to ask windfarm operators to switch off and gas plants to start running in order to keep the electricity grid stable.

Note that biomass accounted for 11% of UK electricity generation in 2019, nearly a third of the total from all renewables. Some two-thirds of the biomass output is from “plant biomass”, primarily wood pellets burnt at Lynemouth in Northumberland and the Drax plant in Yorkshire. The remainder was from an array of smaller sites based on landfill gas, sewage gas or anaerobic digestion.

The CCC says the UK should “move away” from large-scale biomass power plants, once existing subsidy contracts for Drax and Lynemouth expire in 2027.

Using biomass to generate electricity is not zero-carbon and in some circumstances could lead to higher emissions than from fossil fuels. Moreover, there are more valuable uses for the world’s limited supply of biomass feedstock, the CCC says, including carbon sequestration and hard-to-abate sectors with few alternatives.

Methodology
The figures in the article are from Carbon Brief analysis of data from BEIS Energy Trends chapter 5 and chapter 6, as well as from BM Reports. The figures from BM Reports are for electricity supplied to the grid in Great Britain only and are adjusted to include Northern Ireland.

In Carbon Brief’s analysis, the BM Reports numbers are also adjusted to account for electricity used by power plants on site and for generation by plants not connected to the high-voltage national grid. This includes many onshore windfarms, as well as industrial gas combined heat and power plants and those burning landfill gas, waste or sewage gas.

By design, the Carbon Brief analysis is intended to align as closely as possible to the official government figures on electricity generated in the UK, reported in BEIS Energy Trends table 5.1.

Briefly, the raw data for each fuel is in most cases adjusted with a multiplier, derived from the ratio between the reported BEIS numbers and unadjusted figures for previous quarters.

Carbon Brief’s method of analysis has been verified against published BEIS figures using “hindcasting”. This shows the estimates for total electricity generation from fossil fuels or renewables to have been within ±3% of the BEIS number in each quarter since Q4 2017. (Data before then is not sufficient to carry out the Carbon Brief analysis.)

For example, in the second quarter of 2019, a Carbon Brief hindcast estimates gas generation at 33.1TWh, whereas the published BEIS figure was 34.0TWh. Similarly, it produces an estimate of 27.4TWh for renewables, against a BEIS figure of 27.1TWh.

National Grid recently shared its own analysis for electricity in Great Britain during 2019 via its energy dashboard, which differs from Carbon Brief’s figures.


Related News

View more

Fixing California's electric grid is like repairing a car while driving

CAISO Clean Energy Transition outlines California's path to 100% carbon-free power by 2045, scaling renewables, battery storage, and offshore wind while safeguarding grid reliability, managing natural gas, and leveraging Western markets like EDAM.


Key Points

CAISO Clean Energy Transition is the plan to reach 100% carbon-free power by 2045 while maintaining grid reliability.

✅ Target: add 7 GW/year to reach 120 GW capacity by 2045

✅ Battery storage up 30x; smooths intermittent solar and wind

✅ EDAM and WEIM enhance imports, savings, and reliability


Mark Rothleder, Chief Operating Officer and Senior Vice President at the California Independent System Operator (CAISO), which manages roughly 80% of California’s electric grid, has expressed cautious optimism about meeting the state's ambitious clean energy targets while keeping the lights on across the grid. However, he acknowledges that this journey will not be without its challenges.

California aims to transition its power system to 100% carbon-free sources by 2045, ensuring a reliable electricity supply at reasonable costs for consumers. Rothleder, aware of the task's enormity, likens it to a complex car repair performed while the vehicle is in motion.

Recent achievements have demonstrated California's ability to temporarily sustain its grid using clean energy sources. According to Rothleder, the real challenge lies in maintaining this performance round the clock, every day of the year.

Adding thousands of megawatts of renewable energy into California’s existing 50-gigawatt system, which needs to expand to 120 gigawatts to meet the 2045 goal, poses a significant challenge, though recent grid upgrade funding offers some support for needed infrastructure. CAISO estimates that an addition of 7 gigawatts of clean power per year for the next two decades is necessary, all while ensuring uninterrupted power delivery.

While natural gas currently constitutes California's largest single source of power, Rothleder notes the need to gradually decrease reliance on it, even as it remains an operational necessity in the transition phase.

In 2023, CAISO added 5,660 megawatts of new power to the grid, with plans to integrate over 1,100 additional megawatts in the next six to eight months of 2024. Battery storage, crucial for mitigating the intermittent nature of wind and solar power, has seen substantial growth as California turns to batteries for grid support, increasing 30-fold in three years.

Rothleder emphasizes that electricity reliability is paramount, as consumers always expect power availability. He also highlights the potential of offshore wind projects to significantly contribute to California's power mix by 2045.

The offshore wind industry faces financial and supply chain challenges despite these plans. CAISO’s 20-year outlook indicates a significant increase in utility-scale solar, requiring extensive land use and wider deployment of advanced inverters for grid stability.

Addressing affordability is vital, especially as California residents face increasing utility bills. Rothleder suggests a broader energy cost perspective, encompassing utility and transportation expenses.

Despite smooth grid operations in 2023, challenges in previous years, including extreme weather-induced power outages driven by climate change, underscore the need for a robust, adaptable grid. California imports about a quarter of its power from neighbouring states and participates in the Western Energy Imbalance Market, which has yielded significant savings.

CAISO is also working on establishing an extended day-ahead electricity market (EDAM) to enhance the current energy market's success, building on insights from a Western grid integration report that supports expanded coordination.

Rothleder believes that a thoughtfully designed, diverse power system can offer greater reliability and resilience in the long run. A future grid reliant on multiple, smaller power sources such as microgrids could better absorb potential losses, ensuring a more reliable electricity supply for California.


Related News

View more

India's electricity demand falls at the fastest pace in at least 12 years

India Industrial Output Slowdown deepens as power demand slumps, IIP contracts, and electricity, manufacturing, and mining weaken; capital goods plunge while RBI rate cuts struggle to lift GDP growth, infrastructure, and fuel demand.


Key Points

A downturn where IIP contracts as power demand, manufacturing, mining, and capital goods fall despite RBI rate cuts.

✅ IIP fell 4.3% in Sep, worst since Feb 2013.

✅ Power demand dropped for a third month, signaling weak industry.

✅ Capital goods output plunged 20.7%, highlighting weak investment.


India's power demand fell at the fastest pace in at least 12 years in October, signalling a continued decline in the industrial output, mirroring how China's power demand dropped when plants were shuttered, according to government data. Electricity has about 8% weighting in the country's index for industrial production.

India needs electricity to fuel its expanding economy and has at times rationed coal supplies when demand surged, but a third decline in power consumption in as many months points to tapering industrial activity in a nation that aims to become a $5 trillion economy by 2024.

India's industrial output fell at the fastest pace in over six years in September, adding to a series of weak indicators that suggests that the country’s economic slowdown is deep-rooted and interest rate cuts alone may not be enough to revive growth.

Annual industrial output contracted 4.3% in September, government data showed on Monday. It was the worst performance since a 4.4% contraction in February 2013, according to Refinitiv data.

Analysts polled by Reuters had forecast industrial output to fall 2% for the month.

“A contraction of industrial production by 4.3% in September is serious and indicative of a significant slowdown as both investment and consumption demand have collapsed,” said Rupa Rege Nitsure, chief economist of L&T Finance Holdings.

The industrial output figure is the latest in a series of worrying economic data in Asia's third largest economy, which is also the world's third-largest electricity producer as well.

Economists say that weak series of data could mean economic growth for July-September period will remain near April-June quarter levels of 5%, which was a six-year low, and some analysts argue for rewiring India's electricity to bolster productivity. The Indian government is likely to release April-September economic growth figures by the end of this month.

Subdued inflation and an economic slowdown have prompted the Reserve Bank of India (RBI) to cut interest rates by a total of 135 basis points this year, while coal and electricity shortages eased in recent months.

“These are tough times for the RBI, as it cannot do much about it but there will be pressures on it to act ...Blunt tools like monetary policy may not be effective anymore,” Nitsure said.

Data showed in September mining sector fell 8.5%, while manufacturing and electricity fell 3.9% and 2.6% respectively, even as imported coal volumes rose during April-October. Capital goods output during the month fell 20.7%, indicating sluggish demand.

“IIP (Index of Industrial Production) growth in October 2019 is also likely to be in negative territory and only since November 2019 one can expect mild IIP expansion, said Devendra Kumar Pant, Chief Economist and Senior Director, Public Finance, India Ratings & Research (Fitch Group).

Infrastructure output, which comprises eight main sectors, in September showed a contraction of 5.2%, the worst in 14 years, even as global daily electricity demand fell about 15% during pandemic lockdowns.

India's fuel demand fell to its lowest in more than two years in September, with consumption of diesel to its lowest levels since January 2017. Diesel and gasoline together make up over 7.4% of the IIP weightage.

In 2019/20 India's fuel demand — also seen as an indicator of economic and industrial activity — is expected to post the slowest growth in about six years.


Related News

View more

Ontario introduces new fixed COVID-19 hydro rate

Ontario Electricity COVID-19 Recovery Rate sets a fixed price of 12.8 cents/kWh, replacing time-of-use billing and aligning costs across off-peak, mid-peak, and on-peak periods per Ontario Energy Board guidance through Oct. 31.


Key Points

A flat 12.8 cents/kWh electricity price in Ontario that temporarily replaces time-of-use rates from June 1 to Oct. 31.

✅ Fixed 12.8 cents/kWh, all hours, June 1 to Oct. 31

✅ Higher than off-peak 10.1, lower than mid/on-peak

✅ Based on Ontario Energy Board average cost


Ontario residents will now have to pay a fixed electricity price that is higher than the off-peak hydro rate many in the province have been allowed to pay so far due to the pandemic. 

The announcement, which was made in a news release on Saturday, comes after the Ontario government suspended the normal “time-of-use” billing system on March 24 and as electricity rates are about to change across Ontario. 

The government moved all customers onto the lowest winter rate in response to the pandemic as emergency measures meant more people would be at home during the middle of the day when electricity costs are the highest. 

Now, the government has introduced a new “COVID-19 recovery rate” of 12.8 cents per kilowatt hour at all times of the day. The fixed price will be in place from June 1 to Oct. 31. 

The fixed price is higher than the winter off-peak price, which stood at 10.1 per kilowatt hour. However, it is lower than the mid-peak rate of 14.4 per kilowatt hour and the high-peak rate of 20.8 per kilowatt hour, even though typical bills may rise as fixed pricing ends for many households. 

“Since March 24, 2020, we have invested just over $175 million to deliver emergency rate relief to residential, farm and small business electricity consumers by suspending time-of-use electricity pricing,” Greg Rickford, the minister of energy, northern development and mines, said in a news release. 

“This investment was made to protect the people of Ontario from a marked increase in electricity rates as they did their part by staying home to prevent the further spread of the virus.”

Rickford said that the COVID-19 recovery rate is based on the average cost of electricity set by the Ontario Energy Board. 

“This fixed rate will continue to suspend time-of-use prices in a fiscally responsible manner,” he said. "Consumers will have greater flexibility to use electricity when they need it without paying on-peak and mid-peak prices, and some may benefit from ultra-low electricity rates under new time-of-use options."


Related News

View more

More Managers Charged For Price Fixing At Ukraine Power Producer

DTEK Rotterdam+ price-fixing case scrutinizes alleged collusion over coal-based electricity tariffs in Ukraine, with NABU probing NERC regulators, market manipulation, consumer overpayment, and wholesale pricing tied to imported coal benchmarks.


Key Points

NABU probes alleged DTEK-NERC collusion to inflate coal power tariffs via Rotterdam+; all suspects deny wrongdoing.

✅ NABU alleges tariff manipulation tied to coal import benchmarks.

✅ Four DTEK execs and four NERC officials reportedly charged.

✅ Probe centers on 2016-2017 overpayments; defendants contest.


Two more executives of DTEK, Ukraine’s largest private power and coal producer and recently in energy talks with Octopus Energy, have been charged in a criminal case on August 14 involving an alleged conspiracy to fix electricity prices with the state energy regulator, Interfax reported.

They are Ivan Helyukh, the CEO of subsidiary DTEK Grid, which operates as Ukraine modernizes its network alongside global moves toward a smart electricity grid, and Borys Lisoviy, a top manager of power generation company Skhidenergo, according to Kyiv-based Concorde Capital investment bank.

Ukraine’s Anti-Corruption Bureau (NABU) alleges that now four DTEK managers “pressured” and colluded with four regulators at the National Energy and Utilities Regulatory Commission to manipulate tariffs on electricity generated from coal that forced consumers to overpay, reflecting debates about unjustified profits in the UK, $747 million in 2016-2017.


DTEK allegedly benefited $560 million in the scheme.

All eight suspects are charged with “abuse of office” and deny wrongdoing, similar to findings in a B.C. Hydro regulator report published in Canada.

There is “no legitimate basis for suspicions set out in the investigation,” DTEK said in an August 8 statement.

Suspect Dmytro Vovk, the former head of NERC, dismissed the investigation as a “wild goose chase” on Facebook.

In separate statements over the past week, DTEK said the managers who are charged have prematurely returned from vacation to “fully cooperate” with authorities in order to “help establish the truth.”

A Kyiv court on August 14 set bail at $400,000 for one DTEK manager who wasn’t named, as enforcement actions like the NT Power penalty highlight regulatory consequences.

The so-called Rotterdam+ pricing formula that NABU has been investigating since March 2017, similar to federal scrutiny of TVA rates, was in place from April 2016 until July of this year.

It based the wholesale price of electricity by Ukrainian thermal power plants on coal prices set in the Rotterdam port plus delivery costs to Ukraine.

NABU alleges that at certain times it has not seen documented proof that the purchased coal originated in Rotterdam, insisting that there was no justification for the price hikes, echoing issues around paying for electricity in India in some markets.

Ukraine started facing thermal-coal shortages after fighting between government forces and Russia-backed separatists in the eastern part of the country erupted in April 2014. A vast majority of the anthracite-coal mines on which many Ukrainian plants rely are located on territory controlled by the separatists.

Overnight, Ukraine went from being a net exporter of coal to a net importer and started purchasing coal from as far away as South Africa and Australia.


Related News

View more

Sign Up for Electricity Forum’s Newsletter

Stay informed with our FREE Newsletter — get the latest news, breakthrough technologies, and expert insights, delivered straight to your inbox.

Electricity Today T&D Magazine Subscribe for FREE

Stay informed with the latest T&D policies and technologies.
  • Timely insights from industry experts
  • Practical solutions T&D engineers
  • Free access to every issue

Download the 2025 Electrical Training Catalog

Explore 50+ live, expert-led electrical training courses –

  • Interactive
  • Flexible
  • CEU-cerified