British Columbia electricity rate increase will raise BC Hydro bills 3.75% over 2025-2026 to fund infrastructure, Site C, and clean energy, balancing affordability, reliability, and energy security while keeping prices below the North American average.
Key Points
BC will raise BC Hydro rates 3.75% in 2025-2026, about $3.75/month, to fund grid upgrades, Site C, and clean energy.
✅ 3.75% over 2025-2026; about $3.75/month on $100 average bill
✅ Funds Site C, grid maintenance, and clean energy capacity
✅ Keeps BC Hydro rates below North American averages
British Columbia's electricity rates will experience a 3.75% increase over the next two years, following an earlier 3% rate increase approval that set the stage, as confirmed by the provincial government on March 17, 2025. The announcement was made by Minister of Energy and Climate Solutions, Adrian Dix, who emphasized the decision's necessity for maintaining BC Hydro’s infrastructure while balancing affordability for residents.
For most households, the increase will amount to an additional $3.75 per month, based on an average BC Hydro bill of $100, though some coverage framed an earlier phase as a BC Hydro $2/month proposal that later evolved. While this may seem modest, the increase reflects a broader strategy to stabilize the utility's rates amidst economic challenges and ensure long-term energy security for the province.
Reasons Behind the Rate Hike
The rate increase comes during a period of rising costs in both global markets and local economies. According to Dix, the economic uncertainty stemming from trade dynamics and inflation has forced the government to act. Despite these pressures, and after a prior B.C. rate freeze to moderate impacts, the increase remains below cumulative inflation over the last several years, a move designed to shield consumers from the full force of these economic changes.
Dix also noted that, when adjusted for inflation, electricity rates in British Columbia in 2025 are effectively at the same price they were four decades ago. This stability, he argued, underscores the provincial government’s commitment to keeping rates as low as possible for residents, even as operating costs rise.
“We must take urgent action to protect British Columbians from the uncertainty posed by rising costs while building a strong, resilient electricity system for the long-term benefit of B.C.’s energy independence,” Dix said. He also highlighted the government's approach to minimizing the financial burden on consumers by keeping electricity costs well below the North American average.
Infrastructure and Maintenance Costs
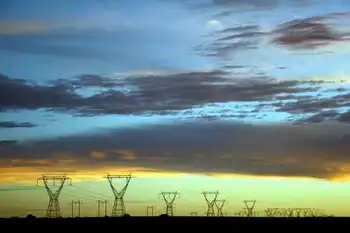
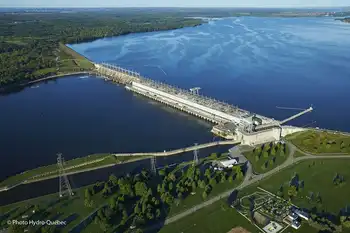
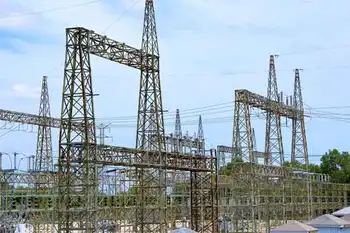
The primary justification for the rate increase is to allow BC Hydro to continue its critical infrastructure development, including the Site C hydroelectric project, which is expected to become operational in the coming years. The increased costs of maintaining and upgrading the province's electricity grid also contribute to the need for higher rates.
The Site C project, a massive hydroelectric dam under construction on the Peace River, is expected to provide a substantial increase in clean, renewable energy capacity. However, such large-scale projects require significant investment and maintenance, both of which have contributed to the increased operating costs for BC Hydro.
A Strategic Move for Rate Stability
The provincial government has been clear that the rate increase will allow for a continuation of infrastructure development while keeping the rates manageable for consumers. The 3.75% increase will be spread across two years, with the first hike scheduled for April 1, 2025, reflecting the typical April rate changes BC Hydro implements, and the second for April 1, 2026.
Dix confirmed that the rate hike would still keep electricity costs among the lowest in North America, noting that British Columbians pay about half of what residents in Alberta pay for electricity. This is part of a broader effort by the provincial government to provide stable energy pricing while bolstering the transition to clean energy solutions, such as the Site C project and other renewable energy initiatives.
Addressing Public Concerns
Although the government has framed the increase as a necessary measure to ensure the province's long-term energy independence and reliability, the rate hikes are likely to face scrutiny from residents, particularly those already struggling with the rising cost of living, even as provinces like Ontario face their own Ontario hydro rate increase pressures this fall.
Public reactions to utility rate increases are often contentious, as residents feel the pressure of rising prices across various sectors, from housing to healthcare. However, the government has promised that the new rates will remain manageable, especially considering the relatively low rate increases compared to inflation and other regions where Manitoba Hydro scaled back a planned increase to temper impacts.
Furthermore, the increase comes as part of a broader strategy that aims to keep the overall impact on consumers as low as possible. Minister Dix emphasized that these rate increases were intended to ensure the continued reliability of BC Hydro’s services, without overwhelming ratepayers.
Long-Term Goals
Looking ahead, the province's strategy centers on not only maintaining affordable electricity rates but also reinforcing the importance of renewable energy, while some jurisdictions consider a 2.5% annual increase plan over multiple years to stabilize their grids. As climate change becomes an increasingly pressing issue, BC’s investments in clean energy projects like Site C aim to provide sustainable power for generations to come.
The government’s long-term vision involves building a resilient, energy-independent province that can weather future economic and environmental challenges. In this context, the rate increases are framed not just as a response to immediate inflationary pressures but as a necessary step in preparing BC’s energy infrastructure for the future.
The 3.75% rate increase set for 2025 and 2026 represents a balancing act between managing the financial health of BC Hydro and protecting consumers from higher costs. While the increase will have a modest effect on household bills, the long-term goal is to build a more robust and sustainable electricity system for British Columbia’s future. Through investments in clean energy and strategic infrastructure development, the province aims to keep electricity rates competitive while positioning itself as a leader in energy independence and climate action.
Related News