New England Is Burning the Most Oil for Electricity Since 2018
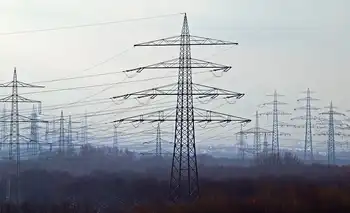

oil graph

CSA Z463 Electrical Maintenance

Our customized live online or in‑person group training can be delivered to your staff at your location.

  • Live Online
  • 6 hours Instructor-led
  • Group Training Available
Regular Price:
$249
Coupon Price:
$199
Reserve Your Seat Today

New England oil-fired generation surges as ISO New England manages a cold snap, dual-fuel switching, and a natural gas price spike, highlighting winter reliability challenges, LNG and pipeline limits, and rising CO2 emissions.


Key Points

Reliance on oil-burning power plants during winter demand spikes when natural gas is costly or constrained.

✅ Driven by dual-fuel switching amid high natural gas prices

✅ ISO-NE winter reliability rules encourage oil stockpiles

✅ Raises CO2 emissions despite coal retirements and renewables growth


New England is relying on oil-fired generators for the most electricity since 2018 as a frigid blast boosts demand for power and natural gas prices soar across markets. 

Oil generators were producing more than 4,200 megawatts early Thursday, accounting for about a quarter of the grid’s power supply, according to ISO New England. That was the most since Jan. 6, 2018, when oil plants produced as much as 6.4 gigawatts, or 32% of the grid’s output, said Wood Mackenzie analyst Margaret Cashman.  

Oil is typically used only when demand spikes, because of higher costs and emissions concerns. Consumption has been consistently high over the past three weeks as some generators switch from gas, which has surged in price in recent months. New England generators are producing power from oil at an average rate of almost 1.8 gigawatts so far this month, the highest for January in at least five years. 

Oil’s share declined to 16% Friday morning ahead of an expected snowstorm, which was “a surprise,” Cashman said. 

“It makes me wonder if some of those generators are aiming to reserve their fuel for this weekend,” she said.

During the recent cold snap, more than a tenth of the electricity generated in New England has been produced by power plants that haven’t happened for at least 15 years.

Burning oil for electricity was standard practice throughout the region for decades. It was once our most common fuel for power and as recently as 2000, fully 19% of the six-state region’s electricity came from burning oil, according to ISO-New England, more than any other source except nuclear power at the time.

Since then, however, natural gas has gotten so cheap that most oil-fired plants have been shut or converted to burn gas, to the point that just 1% of New England’s electricity came from oil in 2018, whereas about half our power came from natural gas generation regionally during that period. This is good because natural gas produces less pollution, both particulates and greenhouse gasses, although exactly how much less is a matter of debate.

But as you probably know, there’s a problem: Natural gas is also used for heating, which gets first dibs. Prolonged cold snaps require so much gas to keep us warm, a challenge echoed in Ontario’s electricity system as supply tightens, that there might not be enough for power plants – at least, not at prices they’re willing to pay.

After we came close to rolling brownouts during the polar vortex in the 2017-18 winter because gas-fired power plants cut back so much, ISO-NE, which has oversight of the power grid, established “winter reliability” rules. The most important change was to pay power plants to become dual-fuel, meaning they can switch quickly between natural gas and oil, and to stockpile oil for winter cold snaps.

We’re seeing that practice in action right now, as many dual-fuel plants have switched away from gas to oil, just as was intended.

That switch is part of the reason EPA says the region’s carbon emissions have gone up in the pandemic, from 22 million tons of CO2 in 2019 to 24 million tons in 2021. That reverses a long trend caused partly by closing of coal plants and partly by growing solar and offshore wind capacity: New England power generation produced 36 million tons of CO2 a decade ago.

So if we admit that a return to oil burning is bad, and it is, what can we do in future winters? There are many possibilities, including tapping more clean imports such as Canadian hydropower to diversify supply.

The most obvious solution is to import more natural gas, especially from fracked fields in New York state and Pennsylvania. But efforts to build pipelines to do that have been shot down a couple of times and seem unlikely to go forward and importing more gas via ocean tanker in the form of liquefied natural gas (LNG) is also an option, but hits limits in terms of port facilities.

Aside from NIMBY concerns, the problem with building pipelines or ports to import more gas is that pipelines and ports are very expensive. Once they’re built they create a financial incentive to keep using natural gas for decades to justify the expense, similar to moves such as Ontario’s new gas plants that lock in generation. That makes it much harder for New England to decarbonize and potentially leaves ratepayers on the hook for a boatload of stranded costs.

Related News

Biggest in Canada: Bruce Power doubles PPE donation

Bruce Power PPE Donation supports Canada COVID-19 response, supplying 1.2 million masks, gloves, and gowns to Ontario hospitals, long-term care, and first responders, plus face shields, hand sanitizer, and funding for testing and food banks.


Key Points

Bruce Power PPE Donation is a broad COVID-19 aid delivering PPE, supplies, and funding across Ontario.

✅ 1.2 million masks, gloves, gowns to Ontario care providers

✅ 3-D printed face shields and 50,000 bottles of sanitizer

✅ Funding testing research and supporting regional food banks


The world’s largest nuclear plant, which recently marked an operating record during sustained operations, just made Canada’s largest donation of personal protective equipment (PPE).

Bruce Power is doubling its initial donation of 600,000 masks, gloves and gowns for front-line health workers, to 1.2 million pieces of PPE.

The company, which operates the Bruce Nuclear station near Kincardine, Ont., where a major reactor refurbishment is underway, plans to have the equipment in the hands of hospitals, long-term care homes and first responders by the end of April.

It’s not the only thing Bruce Power is doing to help out Ontario during the COVID-19 pandemic:

 Bruce Power has donated $300,000 to 37 food banks in Midwestern Ontario, highlighting the broader economic benefits of Canadian nuclear projects for communities.

  •  They’re also working with NPX in Kincardine to make face shields with 3-D printers, leveraging local manufacturing contracts to accelerate production.
  •  They’re teaming up with the Power Worker’s Union to fund testing research in Toronto.
  •  They’re working with Three Sheets Brewing and Junction 56 Distillery to distribute 50,000 bottles of hand sanitizer to those that need it.

And that’s all on top of what they’ve been doing for years, producing Cobalt-60, a medical isotope to sterilize medical equipment, and, after a recent output upgrade at the site, producing about 30 per cent of Ontario’s electricity as the province advances the Pickering B refurbishment to bolster grid reliability.

Bruce Power has over 4,000 employees working out of their nuclear plant, on the shores of Lake Huron, as it explores the proposed Bruce C project for potential future capacity.


Related News

View more

Energy dashboard: how is electricity generated in Great Britain?

Great Britain electricity generation spans renewables and baseload: wind, solar, nuclear, gas, and biomass, supported by National Grid interconnectors, embedded energy estimates, and BMRS data for dynamic imports and exports across Europe.


Key Points

A diverse, weather-driven mix of renewables, gas, nuclear, and imports coordinated by National Grid.

✅ Baseload from nuclear and biomass; intermittent wind and solar

✅ Interconnectors trade zero carbon imports via subsea cables

✅ Data from BMRS and ESO covers embedded energy estimates


Great Britain has one of the most diverse ranges of electricity generation in Europe, with everything from windfarms off the coast of Scotland to a nuclear power station in Suffolk tasked with keeping the lights on. The increasing reliance on renewable energy sources, as part of the country’s green ambitions, also means there can be rapid shifts in the main source of electricity generation. On windy days, most electricity generation comes from record wind generation across onshore and offshore windfarms. When conditions are cold and still, gas-fired power stations known as peaking plants are called into action.

The electricity system in Great Britain relies on a combination of “baseload” power – from stable generators such as nuclear and biomass plants – and “intermittent” sources, such as wind and solar farms that need the right weather conditions to feed energy into the grid. National Grid also imports energy from overseas, through subsea cables known as interconnectors that link to France, Belgium, Norway and the Netherlands. They allow companies to trade excess power, such as renewable energy created by the sun, wind and water, between different countries. By 2030 it is hoped that 90% of the energy imported by interconnectors will be from zero carbon energy sources, though low-carbon electricity generation stalled in 2019 for the UK.

The technology behind Great Britain’s power generation has evolved significantly over the last century, and at times wind has been the main source of electricity. The first integrated national grid in the world was formed in 1935 linking seven regions of the UK. In the aftermath of industrialisation, coal provided the vast majority of power, before oil began to play an increasingly important part in the 1950s. In 1956, the world’s first commercial nuclear reactor, Calder Hall 1 at Windscale (later Sellafield), was opened by Queen Elizabeth II. Coal use fell significantly in the 1990s while the use of combined cycle gas turbines grew, and in 2016 wind generated more electricity than coal for the first time. Now a combination of gas, wind, nuclear and biomass provide the bulk of Great Britain’s energy, with smaller sources such as solar and hydroelectric power also used. From October 2024, coal will no longer be used to generate electricity, following coal-free power records set in recent years.

Energy generation data is fetched from the Balancing Mechanism Reporting Service public feed, provided by Elexon – which runs the wholesale energy market – and is updated every five minutes, covering periods when wind led the power mix as well.

Elexon’s data does not include embedded energy, which is unmetered and therefore invisible to Great Britain’s National Grid. Embedded energy comprises all solar energy and wind energy generated from non-metered turbines. To account for these figures we use embedded energy estimates from the National Grid electricity system operator, which are published every 30 minutes.

Import figures refer to the net flow of electricity from the interconnectors with Europe and with Northern Ireland. A positive value represents import into the GB transmission system, while a negative value represents an export.

Hydro figures combine renewable run-of-the-river hydropower and pumped storage.

Biomass figures include Elexon’s “other” category, which comprises coal-to-biomass conversions and biomass combined heat and power plants.


Related News

View more

Pandemic causes drop in electricity demand across the province: Manitoba Hydro

Manitoba Electricity Demand Drop reflects COVID-19 effects, lowering peak demand about 6% as businesses and offices close, impacting the regional grid; recession-like patterns emerge while Winnipeg water consumption stays steady and peak usage shifts later.


Key Points

An observed 6% decline in Manitoba peak electricity during COVID-19 due to closures; Winnipeg water use remains steady.

✅ Daily peak load down roughly 6% provincewide

✅ Business and office shutdowns drive lower consumption

✅ Winnipeg peak water time shifts to 9 a.m., volume steady


The COVID-19 pandemic has caused a drop in the electricity demand across the province, according to Manitoba Hydro, mirroring the Ontario electricity usage decline reported elsewhere in Canada.

On Tuesday, Manitoba Hydro said it has tracked overall electrical use, which includes houses, farms and businesses both large and small, while also cautioning customers about pandemic-related scam calls in recent weeks.

Hydro said it has seen about a six per cent reduction in the daily peak electricity demand, adding this is due to the many businesses and downtown offices which are temporarily closed, even as residential electricity use has increased in many regions.


"Currently, the impact on Manitoba electricity demand appears to be consistent with what we saw during the 2008 recession," Bruce Owen, the media relations officer for Manitoba Hydro, noting a similar Ottawa demand decline during the pandemic, said in an email to CTV News.

Owen added this trend of reduced electricity demand is being seen across North America, with BC Hydro pandemic load patterns reported and the regional grid in the American Midwest – an area where Manitoba Hydro is a member.

While electricity demand is down, BC Hydro expects holiday usage to rise and water usage in Winnipeg has remained the same.

The City of Winnipeg said it has not seen any change in overall water consumption, but as Hydro One kept peak rates in Ontario, peak demand times have moved from 7 – 8 a.m. to 9 a.m.


Related News

View more

Energy-insecure households in the U.S. pay 27% more for electricity than others

Community Solar for Low-Income Homes expands energy equity by delivering renewable energy access, predictable bill savings, and tax credit benefits to renters and energy-insecure households, accelerating distributed generation and storage adoption nationwide.


Key Points

A program model enabling renters and LMI households to subscribe to off-site solar and save on utility bills.

✅ Earn bill credits from shared solar generation.

✅ Expands access for renters and LMI subscribers.

✅ Often paired with storage and IRA tax credit adders.


On a square-foot basis, the issue of inequality is made worse by higher costs for energy usage in the nation. Efforts like community solar programs such as Maryland community solar are underway to boost low-income participation in the cost benefits of renewable energy.

The Energy Information Administration (EIA) shows that households that are considered energy insecure, or those that have the inability to adequately meet basic household energy costs, are paying more for electricity than their wealthier counterparts. 

On average in the United States in 2020, households were billed about $1.04 per square foot for all energy sources. For homes that did not report energy insecurity, that average was $0.98 per square foot, while homes with energy insecurity issues paid an average of $1.24 per square foot for energy. This means that U.S. residents that need the most support on their energy bills are stuck with costs 27% higher than their neighbors on square-foot-basis.

EIA said energy-insecure households have reduced or forgone basic necessities to pay energy bills, kept their houses at unsafe temperatures because of energy cost concerns, or been unable to repair heating or cooling equipment because of cost.

In 2020, households with income less than $10,000 a year were billed an average of $1.31 per square foot for energy, while households making $100,000 or more were billed an average of $0.96 per square foot, said EIA. Renters paid considerably more ($1.28 per square foot) than owners ($0.98 per square foot). There were also considerable differences between regions, with New England solar growth sparking grid upgrade debates, ethnic groups and races, and insulation levels, as seen below.

The energy transition toward renewables like solar has offered price stability, amid record solar and storage growth nationwide, but thus far energy-insecure communities have relatively been left behind. A recent Berkeley Lab report, Residential Solar-Adopter Income and Demographic Trends, indicates that even though the rate of solar adoption among low-income residents is increasing (from 5% in 2010 to 11% in 2021), that segment of energy consumers remains under-represented among solar adopters, relative to its share of the population.


Community solar efforts

As such, the United States is targeting communities most impacted by energy costs that have not benefitted from the transition, highlighting “Energy Communities” that are eligible for an additional 10% tax credit through funds made possible by the Inflation Reduction Act.

Additionally, a push for community solar development is taking place nationwide to extend access to affordable solar energy to renters and other residents that aren’t able to leverage finances to invest in predictable, low-cost residential solar systems. The Biden Administration set a goal this year to sign up 5 million community solar households, achieving $1 billion in bill savings by 2025. The community solar model only represents about 8% of the total distributed solar capacity in the nation. This target would entail a jump from 3 GW installed capacity to 20 GW by the target year. The Department of Energy estimates community solar subscribers save an average of 20% on their bills.

California this year passed AB 2316, the Community Renewable Energy Act takes aim at four acute problems in the state’s power market: reliability amid rising outage risks, rates, climate and equity. The law creates a community renewable energy program, including community solar-plus-storage, supported by cheaper batteries, to overcome access barriers for nearly half of Californians who rent or have low incomes. Community solar typically involves customers subscribing to an off-site solar facility, receiving a utility bill credit for the power it generates.

“Community renewable energy is a proven powerful tool to help close California’s clean energy gap, bringing much needed relief to millions struggling with high housing costs and utility debt,” said Alexis Sutterman, energy equity program manager at the California Environmental Justice Alliance.

The program has energy equity baked into its structure, working to make sure Californians of all income levels participate in the benefits of the energy transition. Not only does it open solar access to renters, the law ensures that at least 51% of subscribers are low-income customers, which is expected to make projects eligible for a 10% tax credit adder under the IRA.

“The money’s on the table now,” said Jeff Cramer, president and chief executive of the Coalition for Community Solar Access. “While there are groups pushing for solar access for all, and states with strong legislation, there are other pockets of interest in surprising places in the United States. For example, Louisiana has no policy for community solar or support for low-income residents going solar but the city of New Orleans has its own utility commission with a community solar program. In Nebraska, forward-looking co-operatives have created community solar projects.

Community solar markets are active in 22 states, with more expected to come online in the future as states pursue 100% clean energy targets across the country. However, the market is expected to require strong community outreach efforts to foster trust and gain subscribers.

“There is a distrust of community solar initially in LMI communities as many have been burned before by retail energy false promises,” said Eric LaMora, executive director, community solar, Nautilus Solar on a panel at the Solar Energy Industries Association Finance, Tax, and Buyers seminar. “People are suspicious but there really are no hooks with community solar.”

LMI residents are leery to provide tax records or much documents at all in order to sign up for community solar, LaMora said. “We were surprised to see less of a default rate with LMI residents. We attribute this to the fact that they see significant savings on their electric bill, making it easier to pay each month,” he said.


Related News

View more

California’s Solar Power Cost Shift: A Misguided Policy Threatening Energy Equity

California Rooftop Solar Cost Shift examines PG&E rate hikes, net metering changes, and utility infrastructure spending impacts on low-income households, distributed generation, and clean energy adoption, potentially raising bills and undermining grid resilience.


Key Points

A claim that rooftop solar shifts fixed grid costs to others; critics cite PG&E rates, avoided costs, and impacts.

✅ PG&E rates outpace national average, underscoring cost drivers.

✅ Net metering cuts risk burdening low- and middle-income homes.

✅ Distributed generation avoids infrastructure spend and grid strain.


California is grappling with soaring electricity prices across the state, with Pacific Gas & Electric (PG&E) rates more than double the national average and increasing at an average of 12.5% annually over the past six years. In response, Governor Gavin Newsom issued an executive order directing state energy agencies to identify ways to reduce power costs. However, recent policy shifts targeting rooftop solar users may exacerbate the problem rather than alleviate it.

The "Cost Shift" Theory

A central justification for these pricing changes is the "cost shift" theory. This theory posits that homeowners with rooftop solar panels reduce their electricity consumption from the grid, thereby shifting the fixed costs of maintaining and operating the electrical grid onto non-solar customers. Proponents argue that this leads to higher rates for those without solar installations.

However, this theory is based on a flawed assumption: that PG&E owns 100% of the electricity generated by its customers and is entitled to full profits even for energy it does not deliver. In reality, rooftop solar users supply only about half of their energy needs and still pay for the rest. Moreover, their investments in solar infrastructure reduce grid strain and save ratepayers billions by avoiding costly infrastructure projects and reducing energy demand growth, aligning with efforts to revamp electricity rates to clean the grid as well.

Impact on Low- and Middle-Income Households

The majority of rooftop solar users are low- and middle-income households. These individuals often invest in solar panels to lower their energy bills and reduce their carbon footprint. Policy changes that undermine the financial viability of rooftop solar disproportionately affect these communities, and efforts to overturn income-based charges add uncertainty about affordability and access.

For instance, Assembly Bill 942 proposes to retroactively alter contracts for millions of solar consumers, cutting the compensation they receive from providing energy to the grid, raising questions about major changes to your electric bill that could follow if their home is sold or transferred. This would force those with solar leases—predominantly lower-income individuals—to buy out their contracts when selling their homes, potentially incurring significant financial burdens.

The Real Drivers of Rising Energy Costs

While rooftop solar users are being blamed for rising electricity rates, calls for action have mounted as the true culprits lie elsewhere. Unchecked utility infrastructure spending has been a significant factor in escalating costs. For example, PG&E's rates have increased rapidly, yet the utility's spending on infrastructure projects has often been criticized for inefficiency and lack of accountability. Instead of targeting solar users, policymakers should scrutinize utility profit motives and infrastructure investments to identify areas where costs can be reduced without sacrificing service quality.

California's approach to addressing rising electricity costs by targeting rooftop solar users is misguided. The "cost shift" theory is based on flawed assumptions and overlooks the substantial benefits that rooftop solar provides to the grid and ratepayers. To achieve a sustainable and equitable energy future, the state must focus on controlling utility spending, promoting clean energy access for all, especially as it exports its energy policies across the West, and ensuring that policies support—not undermine—the adoption of renewable energy technologies.


Related News

View more

Offshore wind is set to become a $1 trillion business

Offshore wind power accelerates low-carbon electrification, leveraging floating turbines, high capacity factors, HVDC transmission, and hydrogen production to decarbonize grids, cut CO2, and deliver competitive, reliable renewable energy near demand centers.


Key Points

Offshore wind power uses offshore turbines to deliver low-carbon electricity with high capacity factors and falling costs.

✅ Sea-based wind farms with 40-50% capacity factors

✅ Floating turbines unlock deep-water, far-shore resources

✅ Enables hydrogen production and strengthens grid reliability


The need for affordable low-carbon technologies is greater than ever

Global energy-related CO2 emissions reached a historic high in 2018, driven by an increase in coal use in the power sector. Despite impressive gains for renewables, fossil fuels still account for nearly two-thirds of electricity generation, the same share as 20 years ago. There are signs of a shift, with increasing pledges to decarbonise economies and tackle air pollution, and with World Bank support helping developing countries scale wind, but action needs to accelerate to meet sustainable energy goals. As electrification of the global energy system continues, the need for clean and affordable low-carbon technologies to produce this electricity is more pressing than ever. This World Energy Outlook special report offers a deep dive on a technology that today has a total capacity of 23 GW (80% of it in Europe) and accounts for only 0.3% of global electricity generation, but has the potential to become a mainstay of the world's power supply. The report provides the most comprehensive analysis to date of the global outlook for offshore wind, its contributions to electricity systems and its role in clean energy transitions.


The offshore wind market has been gaining momentum

The global offshore wind market grew nearly 30% per year between 2010 and 2018, benefitting from rapid technology improvements. Over the next five years, about 150 new offshore wind projects are scheduled to be completed around the world, pointing to an increasing role for offshore wind in power supplies. Europe has fostered the technology's development, led by the UK offshore wind sector alongside Germany and Denmark. The United Kingdom and Germany currently have the largest offshore wind capacity in operation, while Denmark produced 15% of its electricity from offshore wind in 2018. China added more capacity than any other country in 2018.


The untapped potential of offshore wind is vast

The best offshore wind sites could supply more than the total amount of electricity consumed worldwide today. And that would involve tapping only the sites close to shores. The IEA initiated a new geospatial analysis for this report to assess offshore wind technical potential country by country. The analysis was based on the latest global weather data on wind speed and quality while factoring in the newest turbine designs. Offshore wind's technical potential is 36 000 TWh per year for installations in water less than 60 metres deep and within 60 km from shore. Global electricity demand is currently 23 000 TWh. Moving further from shore and into deeper waters, floating turbines could unlock enough potential to meet the world's total electricity demand 11 times over in 2040. Our new geospatial analysis indicates that offshore wind alone could meet several times electricity demand in a number of countries, including in Europe, the United States and Japan. The industry is adapting various floating foundation technologies that have already been proven in the oil and gas sector. The first projects are under development and look to prove the feasibility and cost-effectiveness of floating offshore wind technologies.


Offshore wind's attributes are very promising for power systems

New offshore wind projects have capacity factors of 40-50%, as larger turbines and other technology improvements are helping to make the most of available wind resources. At these levels, offshore wind matches the capacity factors of gas- and coal-fired power plants in some regions – though offshore wind is not available at all times. Its capacity factors exceed those of onshore wind and are about double those of solar PV. Offshore wind output varies according to the strength of the wind, but its hourly variability is lower than that of solar PV. Offshore wind typically fluctuates within a narrower band, up to 20% from hour to hour, than solar PV, which varies up to 40%.

Offshore wind's high capacity factors and lower variability make its system value comparable to baseload technologies, placing it in a category of its own – a variable baseload technology. Offshore wind can generate electricity during all hours of the day and tends to produce more electricity in winter months in Europe, the United States and China, as well as during the monsoon season in India. These characteristics mean that offshore wind's system value is generally higher than that of its onshore counterpart and more stable over time than that of solar PV. Offshore wind also contributes to electricity security, with its high availability and seasonality patterns it is able to make a stronger contribution to system needs than other variable renewables. In doing so, offshore wind contributes to reducing CO2 and air pollutant emissions while also lowering the need for investment in dispatchable power plants. Offshore wind also has the advantage of avoiding many land use and social acceptance issues that other variable renewables are facing.


Offshore wind is on track to be a competitive source of electricity

Offshore wind is set to be competitive with fossil fuels within the next decade, as well as with other renewables including solar PV. The cost of offshore wind is declining and is set to fall further. Financing costs account for 35% to 50% of overall generation cost, and supportive policy frameworks are now enabling projects to secure low cost financing in Europe, with zero-subsidy tenders being awarded. Technology costs are also falling. The levelised cost of electricity produced by offshore wind is projected to decline by nearly 60% by 2040. Combined with its relatively high value to the system, this will make offshore wind one of the most competitive sources of electricity. In Europe, recent auctions indicate that offshore wind will soon beat new natural gas-fired capacity on cost and be on a par with solar PV and onshore wind. In China, offshore wind is set to become competitive with new coal-fired capacity around 2030 and be on par with solar PV and onshore wind. In the United States, recent project proposals indicate that offshore wind will soon be an affordable option, even as the 1 GW timeline continues to evolve, with potential to serve demand centres along the country's east coast.

Innovation is delivering deep cost reductions in offshore wind, and transmission costs will become increasingly important. The average upfront cost to build a 1 gigawatt offshore wind project, including transmission, was over $4 billion in 2018, but the cost is set to drop by more than 40% over the next decade. This overall decline is driven by a 60% reduction in the costs of turbines, foundations and their installation. Transmission accounts for around one-quarter of total offshore wind costs today, but its share in total costs is set to increase to about one-half as new projects move further from shore. Innovation in transmission, for example through work to expand the limits of direct current technologies, will be essential to support new projects without raising their overall costs.


Offshore wind is set to become a $1 trillion business

Offshore wind power capacity is set to increase by at least 15-fold worldwide by 2040, becoming a $1 trillion business. Under current investment plans and policies, the global offshore wind market is set to expand by 13% per year, reflecting its growth despite Covid-19 in recent years, passing 20 GW of additions per year by 2030. This will require capital spending of $840 billion over the next two decades, almost matching that for natural gas-fired or coal-fired capacity. Achieving global climate and sustainability goals would require faster growth: capacity additions would need to approach 40 GW per year in the 2030s, pushing cumulative investment to over $1.2 trillion. 

The promising outlook for offshore wind is underpinned by policy support in an increasing number of regions. Several European North Seas countries – including the United Kingdom, Germany, the Netherlands and Denmark – have policy targets supporting offshore wind. Although a relative newcomer to the technology, China is quickly building up its offshore wind industry, aiming to develop a project pipeline of 10 GW by 2020. In the United States, state-level targets and federal incentives are set to kick-start the U.S. offshore wind surge in the coming years. Additionally, policy targets are in place and projects under development in Korea, Japan, Chinese Taipei and Viet Nam.

 The synergies between offshore wind and offshore oil and gas activities provide new market opportunities. Since offshore energy operations share technologies and elements of their supply chains, oil and gas companies started investing in offshore wind projects many years ago. We estimate that about 40% of the full lifetime costs of an offshore wind project, including construction and maintenance, have significant synergies with the offshore oil and gas sector. That translates into a market opportunity of $400 billion or more in Europe and China over the next two decades. The construction of foundations and subsea structures offers potential crossover business, as do practices related to the maintenance and inspection of platforms. In addition to these opportunities, offshore oil and gas platforms require electricity that is often supplied by gas turbines or diesel engines, but that could be provided by nearby wind farms, thereby reducing CO2 emissions, air pollutants and costs.


Offshore wind can accelerate clean energy transitions

Offshore wind can help drive energy transitions by decarbonising electricity and by producing low-carbon fuels. Over the next two decades, its expansion could avoid between 5 billion and 7 billion tonnes of CO2 emissions from the power sector globally, while also reducing air pollution and enhancing energy security by reducing reliance on imported fuels. The European Union is poised to continue leading the wind energy at sea in Europe industry in support of its climate goals: its offshore wind capacity is set to increase by at least fourfold by 2030. This growth puts offshore wind on track to become the European Union's largest source of electricity in the 2040s. Beyond electricity, offshore wind's high capacity factors and falling costs makes it a good match to produce low-carbon hydrogen, a versatile product that could help decarbonise the buildings sector and some of the hardest to abate activities in industry and transport. For example, a 1 gigawatt offshore wind project could produce enough low-carbon hydrogen to heat about 250 000 homes. Rising demand for low-carbon hydrogen could also dramatically increase the market potential for offshore wind. Europe is looking to develop offshore "hubs" for producing electricity and clean hydrogen from offshore wind.


It's not all smooth sailing

Offshore wind faces several challenges that could slow its growth in established and emerging markets, but policy makers and regulators can clear the path ahead. Developing efficient supply chains is crucial for the offshore wind industry to deliver low-cost projects. Doing so is likely to call for multibillion-dollar investments in ever-larger support vessels and construction equipment. Such investment is especially difficult in the face of uncertainty. Governments can facilitate investment of this kind by establishing a long-term vision for offshore wind and by drawing on U.K. policy lessons to define the measures to be taken to help make that vision a reality. Long-term clarity would also enable effective system integration of offshore wind, including system planning to ensure reliability during periods of low wind availability.

The success of offshore wind depends on developing onshore grid infrastructure. Whether the responsibility for developing offshore transmission lies with project developers or transmission system operators, regulations should encourage efficient planning and design practices that support the long-term vision for offshore wind. Those regulations should recognise that the development of onshore grid infrastructure is essential to the efficient integration of power production from offshore wind. Without appropriate grid reinforcements and expansion, there is a risk of large amounts of offshore wind power going unused, and opportunities for further expansion could be stifled. Development could also be slowed by marine planning practices, regulations for awarding development rights and public acceptance issues.

The future of offshore wind looks bright but hinges on the right policies

The outlook for offshore wind is very positive as efforts to decarbonise and reduce local pollution accelerate. While offshore wind provides just 0.3% of global electricity supply today, it has vast potential around the world and an important role to play in the broader energy system. Offshore wind can drive down CO2 emissions and air pollutants from electricity generation. It can also do so in other sectors through the production of clean hydrogen and related fuels. The high system value of offshore wind offers advantages that make a strong case for its role alongside other renewables and low-carbon technologies. Government policies will continue to play a critical role in the future of offshore wind and  the overall pace of clean energy transitions around the world.


Related News

View more

Sign Up for Electricity Forum’s Newsletter

Stay informed with our FREE Newsletter — get the latest news, breakthrough technologies, and expert insights, delivered straight to your inbox.

Electricity Today T&D Magazine Subscribe for FREE

Stay informed with the latest T&D policies and technologies.
  • Timely insights from industry experts
  • Practical solutions T&D engineers
  • Free access to every issue

Download the 2025 Electrical Training Catalog

Explore 50+ live, expert-led electrical training courses –

  • Interactive
  • Flexible
  • CEU-cerified