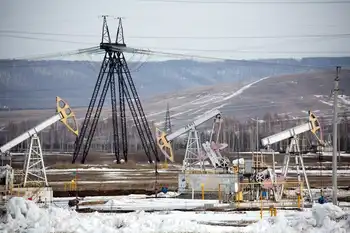
San Antonio Spurs' arena to be powered by wind

By Associated Press


Substation Relay Protection Training

Our customized live online or in‑person group training can be delivered to your staff at your location.

  • Live Online
  • 12 hours Instructor-led
  • Group Training Available
Regular Price:
$699
Coupon Price:
$599
Reserve Your Seat Today
The arena where the San Antonio Spurs play will be powered solely by wind-generated electricity for the next two years.

Spurs owner Peter Holt said that the energy switch is part of an initiative to make the AT&T Center the greenest arena in the U.S.

"We are exploring recycling and water conservation ideas as well," Holt said in a press release. "We really want to be a model for arenas across the country regarding sensitivity to the environment."

The arena has been powered with "Windtricity" from CPS Energy since June 1.

Related News

A tidal project in Scottish waters just generated enough electricity to power nearly 4,000 homes

MeyGen Tidal Stream Project delivers record 13.8 GWh to Scotland's grid, showcasing renewable ocean energy. Simec Atlantis Energy's 6 MW array of tidal turbines advances EU power goals and plans an ocean-powered data center.


Key Points

A Scottish tidal energy array exporting record power, using four 1.5 MW turbines and driving renewable innovation.

✅ Delivered 13.8 GWh to the grid in 2019, a project record.

✅ Four 1.5 MW turbines in Phase 1A, 6 MW installed.

✅ Plans include an ocean-powered data center near site.


A tidal power project in waters off the north coast of Scotland, where Scotland’s wind farms also deliver significant output, sent more than 13.8 gigawatt hours (GWh) of electricity to the grid last year, according to an operational update issued Monday. This figure – a record – almost doubled the previous high of 7.4 GWh in 2018.

In total, the MeyGen tidal stream array has now exported more than 25.5 GWh of electricity to the grid since the start of 2017, according to owners Simec Atlantis Energy. Phase 1A of the project is made up of four 1.5 megawatt (MW) turbines.

The 13.8 GWh of electricity exported in 2019 equates to the average yearly electricity consumption of roughly 3,800 “typical” homes in the U.K., where wind power records have been set recently, according to the company, with revenue generation amounting to £3.9 million ($5.09 million).

Onshore maintenance is now set to be carried out on the AR1500 turbine used by the scheme, with Atlantis aiming to redeploy the technology in spring.

In addition to the production of electricity, Atlantis is also planning to develop an “ocean-powered data centre” near the MeyGen project.

The European Commission has described “ocean energy” as being both abundant and renewable, and milestones like the biggest offshore windfarm starting U.K. supply underscore wider momentum, too. It’s estimated that ocean energy could potentially contribute roughly 10% of the European Union’s power demand by the year 2050, according to the Commission.

While tidal power has been around for decades — EDF’s 240 MW La Rance Tidal Power Plant in France was built as far back as 1966, and the country’s first offshore wind turbine has begun producing electricity — recent years have seen a number of new projects take shape.

In December last year, Scottish tidal energy business Nova Innovation was issued with a permit to develop a project in Nova Scotia, Canada, aiming to harness the Bay of Fundy tides in the region further.

In an announcement at the time, the firm said a total of 15 tidal stream turbines would be installed by the year 2023. The project, according to the firm, will produce enough electricity to power 600 homes, as companies like Sustainable Marine begin delivering tidal energy to the Nova Scotia grid.

Elsewhere, a business called Orbital Marine Power is developing what it describes as the world’s most powerful tidal turbine, with grid-supplied output already demonstrated.

The company says the turbine will have a swept area of more than 600 square meters and be able to generate “over 2 MW from tidal stream resources.” It will use a 72-meter-long “floating superstructure” to support two 1 MW turbines.


Related News

View more

Imported coal volumes up 17% during Apr-Oct as domestic supplies shrink

India Thermal Power Coal Imports surged 17.6% as CEA-monitored plants offset weaker CIL and SCCL supplies, driven by Saubhagya-led electricity demand, regional power deficits, and varied consumption across Uttar Pradesh, Bihar, Maharashtra, and Gujarat.


Key Points

Fuel volumes imported for Indian thermal plants, tracked by CEA, reflecting shifts in CIL/SCCL supply, demand, and regional power deficits.

✅ Imports up 17.6% as domestic CIL/SCCL deliveries lag targets

✅ Saubhagya-driven demand lifts generation in key beneficiary states

✅ Industrial slowdowns cut usage in Maharashtra, Tamil Nadu, Gujarat


The receipt of imported coal by thermal power plants, where plant load factors have risen, has shot up by 17.6 per cent during April-October. The coal import volumes refer to the power plants monitored by the Central Electricity Authority (CEA), and come amid moves to ration coal supplies as electricity demand surges, a power update report from CARE Ratings showed.

Imports escalated as domestic supplies by Coal India Ltd (CIL) and another state run producer- Singareni Collieries Company Ltd (SCCL) dipped in the period, after earlier shortages that have since eased in later months. Rate of supplies by the two coal companies to the CEA monitored power stations stood at 80.4 per cent, indicating a shortfall of 19.6 per cent against the allocated quantity.

According to the study by CARE Ratings, total coal supplied by CIL and SCCL to the power sector stood at 315.9 million tonnes (mt) during April-October as against 328.5 mt in the comparable period of last fiscal year.

The study noted that growth in power generation during the April-October 2019, with India now the third-largest electricity producer globally, was on account of higher demand from Pradhan Mantri Sahaj Bijli Har Ghar Yojana or Saubhagya Scheme beneficiary states. Providing connection to households in order to achieve 100% per cent electrification has in part helped the sector avert de-growth, as part of efforts to rewire Indian electricity and expand access.

Large states namely Uttar Pradesh, Bihar, Punjab, West Bengal and Rajasthan have recorded over five per cent growth in consumption of power. These states along with Odisha, Madhya Pradesh and Assam accounted for 75 per cent of the beneficiaries under the Saubhagya Scheme (Household Electrification Scheme). The ongoing economic downturn has led to a sharp fall in electricity demand from industrialised states. Maharashtra, which is also the largest power consuming state in India, recorded a decline in consumption of 5.6 per cent.

Other states namely Tamil Nadu, Telangana, Gujarat and Odisha too recorded fall in power consumed, echoing global dips in daily electricity demand seen later during the pandemic. These states house large clusters of mining, automobile, cement and other manufacturing industries, and a decline in these sectors led to fall in demand for power across these states. - The demand-supply gap or power deficit has remained at 0.6 per cent during the April-October 2019. North-East reported 4.8 per cent of power deficit followed by Northern Region at 1.3 per cent. Within Northern Region, Jammu & Kashmir and Uttar Pradesh accounted for 65 per cent and 30 per cent respectively of the regions power supply deficit.


Related News

View more

NL Consumer Advocate says 18% electricity rate hike 'unacceptable'

Newfoundland and Labrador electricity rate hike examines a proposed 18.6% increase under the PUB's Rate Stabilization Plan, driven by oil prices at Holyrood, with Consumer Advocate concerns over rate shock and use of RSP balances.


Key Points

A proposed 18.6% July 2017 increase under the RSP, driven by oil prices, now under PUB review for potential mitigation.

✅ PUB flags potential rate shock from proposed adjustment

✅ RSP balances cited to offset increases without depleting fund

✅ Oil-fired Holyrood volatility drives fuel cost uncertainty


How much of a rate hike is reasonable for users of electricity in Newfoundland and Labrador?

That's a question before the Public Utilities Board (PUB) as it examines an application by Newfoundland and Labrador Hydro, which could see consumers pay up to 18.6 per cent more as of July 1, reflecting regional pressures seen in Nova Scotia, where regulators approved a 14% rate hike earlier this year.

"The estimated rate increase for July 2017 is such a significant increase that it may be argued that it would cause rate shock," said the PUB, asking the company to revise its application.

NL Hydro said the price adjustment is part of what happens every year through the Rate Stabilization Plan (RSP), which is used to offset the ups and downs of oil prices.

"The cost of fuel is volatile and as long as we rely on oil-fired generation at Holyrood, customers will continue to be impacted by this electricity price uncertainty," said the company in a statement to CBC News.

It noted that customers received a break from RSP adjustments in 2015 and 2016, even as costs from the Muskrat Falls project begin to be reflected.

The PUB noted that under the rate stabilization plan, prices have gone up or down by about 10 per cent in the past.

The regulatory board said the impact of the latest request would be a 27.6 per cent hike to Newfoundland Power, with "an estimated average end customer impact of 18.6 per cent."

Hydro's estimates are based on an average price for oil of $81.40 per barrel from July 2017 to June 2018, according to the PUB.


'Unacceptable' burden: Consumer Advocate

"To burden ratepayers with an 18 per cent rate increase is unacceptable," said Consumer Advocate Dennis Browne, echoing pushback in Nova Scotia, where the premier urged regulators to reject a 14% hike at the time.

Browne is arguing that there is money in the RSP to reduce the proposed increase, including the possibility of a lump-sum bill credit for customers.

"These ratepayer balances — which, according to NL Power, totals $77.4 million — are not the property of Hydro," he wrote in a letter to the PUB.

"No utility has the right to squirrel away ratepayers' money to be used by that utility for some future purpose. The Board has jurisdiction over those balances," Browne said.

Browne also wants the RSP overhauled so that it can be applied to price fluctuations every quarter, as opposed to annually.

Hydro has expressed concern that depleting the rate stabilization fund would lead to other, more significant, rate increases in the future.

It said several alternatives to mitigate high rates have been provided to the PUB, which has final say, similar to how Manitoba Hydro scaled back a planned increase in the next year.


Related News

View more

EV Sales Still Behind Gas Cars

U.S. EV and Hybrid Sales 2024 show slower adoption versus gas-powered cars, as charging infrastructure gaps, range anxiety, higher upfront costs, and affordability concerns persist despite incentives, battery tech advances, and expanding fast-charging networks.


Key Points

They represent 10-15% of U.S. car sales, lagging gas models due to costs, charging gaps, range anxiety, and access.

✅ 10-15% of U.S. auto sales; gas cars dominate

✅ Barriers: upfront cost, limited charging, range anxiety

✅ Incentives, battery tech, and networks may boost adoption


Sales of hybrid and electric vehicles (EVs) in the U.S. are continuing to trail behind traditional gas-powered vehicles in 2024, despite significant advancements in automotive technology and growing public awareness of environmental concerns. While the electric vehicle market has seen steady growth and recent sales momentum over the past few years, the gap between EVs and gasoline-powered cars remains wide.

In 2024, hybrid and electric vehicles are projected to account for roughly 10-15% of total car sales in the U.S., a figure that, though significant, still lags far behind the sales of gas-powered vehicles and follows a Q1 2024 EV market share dip in the U.S., according to recent data. Analysts point to several factors contributing to this slower adoption rate, including higher upfront costs, limited charging infrastructure, and consumer concerns over range anxiety. Additionally, while EVs and hybrids offer lower lifetime operating costs, the initial price difference remains a hurdle for many prospective buyers.

One of the key challenges for EV sales continues to be the perception of cost, even as analyses show they can be better for the planet and often your budget over time. While federal and state incentives have made EVs more affordable, especially for lower-income buyers, the price tag for many electric models remains steep, particularly for higher-end vehicles. Even with government rebates, EVs can still be priced higher than their gasoline counterparts, making them less accessible for middle-class consumers. Many potential buyers are also hesitant to make the switch, unsure if the long-term savings will outweigh the initial investment.

Another critical factor is the limited charging infrastructure in many parts of the country. Though major cities have seen significant improvements in charging stations, rural areas and smaller towns still lack the necessary infrastructure to support widespread EV use. This uneven distribution of charging stations leads to concerns about being stranded in areas without access to fast-charging options. While automakers are working on expanding charging networks, the pace of this development is slow, and EVs won't go mainstream until key problems are fixed according to industry leaders.

Range anxiety is also a continuing issue, despite improvements in battery technology. Though newer electric vehicles can go further on a single charge than ever before, the range of many EVs still doesn't meet the expectations of some drivers, particularly those who regularly take long road trips or live in rural areas. The longer charging times and the necessity of planning routes around charging stations add to the hesitation, especially when gasoline-powered vehicles provide greater convenience and flexibility.

The shift toward EVs is further hindered by the continued dominance of gas-powered cars in the market. Gasoline vehicles benefit from decades of development, an extensive fueling infrastructure, and familiarity with the technology. For many consumers, the convenience, affordability, and ease of use of gas-powered vehicles still outweigh the benefits of switching to an electric alternative. Additionally, with fluctuating fuel prices, many drivers continue to find gas-powered cars relatively cost-effective in terms of daily commuting, especially when compared to the current costs of EV ownership.

Despite these challenges, there is hope for a future shift. The federal government’s push for stricter emissions regulations and tax incentives continues to fuel growth in the electric vehicle market. As automakers ramp up production and more affordable options become available, EV sales are expected to increase in the coming years. Companies like Tesla, Ford, whose hybrids are getting a boost, and General Motors are leading the charge, while new manufacturers like Rivian and Lucid Motors are offering alternatives to traditional gasoline vehicles.

Furthermore, the development of new technologies, such as solid-state batteries and faster charging systems, could help alleviate some of the current drawbacks of electric vehicles. If these advancements reach mass-market production in the next few years, they could help make EVs a more attractive and practical option for consumers, aligning with within-a-decade adoption forecasts from some industry observers.

In conclusion, while hybrid and electric vehicles are growing in popularity, gas-powered vehicles continue to dominate the U.S. car market in 2024. Challenges such as high upfront costs, limited charging infrastructure, and concerns about range persist, making it difficult for many consumers to make the switch to electric even as they ask if it's time to buy an EV in 2024. However, with continued investment in technology and infrastructure, the gap between EVs and gas-powered vehicles could narrow in the years to come.


Related News

View more

What Will Drive Utility Revenue When Electricity Is Free?

AI-Powered Utility Customer Experience enables transparency, real-time pricing, smart thermostats, demand response, and billing optimization, helping utilities integrate distributed energy resources, battery storage, and microgrids while boosting customer satisfaction and reducing costs.


Key Points

An approach where utilities use AI and real-time data to personalize service, optimize billing, and cut energy costs.

✅ Real-time pricing aligns retail and wholesale market signals

✅ Device control via smart thermostats and home energy management

✅ Analytics reveal appliance-level usage and personalized savings


The latest electric utility customer satisfaction survey results from the American Customer Satisfaction Index (ACSI) Energy Utilities report reveal that nearly every investor-owned utility saw customer satisfaction go down from 2018 to 2019. Residential customers are sending a clear message in the report: They want more transparency and control over energy usage, billing and ways to reduce costs.

With both customer satisfaction and utility revenues on the decline, utilities are facing daunting challenges to their traditional business models amid flat electricity demand across many markets today. That said, it is the utilities that see these changing times as an opportunity to evolve that will become the energy leaders of tomorrow, where the customer relationship is no longer defined by sales volume but instead by a utility company's ability to optimize service and deliver meaningful customer solutions.

We have seen how the proliferation of centralized and distributed renewables on the grid has already dramatically changed the cost profile of traditional generation and variability of wholesale energy prices. This signals the real cost drivers in the future will come from optimizing energy service with things like batteries, microgrids and peer-to-peer trading networks. In the foreseeable future, flat electricity rates may be the norm, or electricity might even become entirely free as services become the primary source of utility revenue.

The key to this future is technological innovation that allows utilities to better understand a customer’s unique needs and priorities and then deliver personalized, well-timed solutions that make customers feel valued and appreciated as their utility helps them save and alleviates their greatest pain points.

I predict utilities that adopt new technologies focused on customer experience, aligned with key utility trends shaping the sector, and deliver continual service improvements and optimization will earn the most satisfied, most loyal customers.

To illustrate this, look at how fixed pricing today is applied for most residential customers. Unless you live in one of the states with deregulated utilities where most customers are free to choose a service provider in a competitive marketplace, as consumers in power markets increasingly reshape offerings, fixed-rate tariffs or time-of-use tariffs might be the only rate structures you have ever known, though new utility rate designs are being tested nationwide today. These tariffs are often market distortions, bearing little relation to the real-time price that the utility pays on the wholesale market.

It can be easy enough to compare the rate you pay as a consumer and the market rate that utilities pay. The California ISO has a public dashboard -- as do other grid operators -- that shows the real-time marginal cost of energy. On a recent Friday, for example, a buyer in San Francisco could go to the real-time market and procure electricity at a rate of around 9.5 cents per kilowatt-hour (kWh), yet a residential customer can pay the utility PG&E between 22 cents and 49 cents per kWh amid major changes to electric bills being debated, depending on usage.

The problem is that utility customers do not usually see this data or know how to interpret it in a way that helps add value to their service or drive down the cost.

This is a scenario ripe for innovation. Artificial intelligence (AI) technologies are beginning to be applied to give customers the transparency and control over the energy they desire, and a new type of utility is emerging using real-time pricing signals from wholesale markets to give households hassle-free energy savings. Evolve Energy in Texas is developing a utility service model, even as Texas utilities revisit smart home network strategies, that delivers electricity to consumers at real-time market prices and connects to smart thermostats and other connected devices in the home for simple monitoring and control -- all managed via an intuitive consumer app.

My company, Bidgely, partners with utilities and energy retailers all over the world to apply artificial intelligence and machine learning algorithms to customer data in order to bring transparency to their electricity bills, showing exactly where the customers’ money is going down to the appliance and offering personalized, actionable advice on how to save.

Another example is from energy management company Keewi. Its wireless outlet adaptors are revealing real-time energy usage information to Texas A&M dorm residents as well as providing students the ability to conserve energy through controlling items in their rooms from their smartphones.

These are but a few examples of innovations among many in play that answer the consumer demand for increased transparency and control over energy usage.

Electric service providers will be closely watching how consumers respond to AI-driven innovation, including providers in traditionally regulated markets that are exploring equitable regulation approaches now, to stay aligned with policy and customer expectations. While regulated utilities have no reason to fear that their customers might sign up with a competitor, they understand that the revenues from electricity sales are going down and the deployment of distributed energy resources is going up. Both trends were reflected in a March report from Bloomberg New Energy Finance (via ThinkProgress) that claimed unsubsidized storage projects co-located with solar or wind are starting to compete with coal and gas for dispatchable power. Change is coming to regulated markets, and some of that change can be attributed to customer dissatisfaction with utility service.

Like so many industries before, the utility-customer relationship is on track to become less about measuring unit sales and more about driving revenue through services and delivering the best customer value. Loyal customers are most likely to listen and follow through on the utility’s advice and to trust the utility for a wide range of energy-related products and services. Utilities that make customer experience the highest priority today will emerge tomorrow as the leaders of a new energy service era.


Related News

View more

Solar + Wind = 10% of US Electricity Generation in 1st Half of 2018

US Electricity Generation H1 2018 saw wind and solar gains but hydro declines, as natural gas led the grid mix and coal fell; renewables' share, GWh, emissions, and capacity additions shaped the power sector.


Key Points

It is the H1 2018 US power mix, where natural gas led, coal declined, and wind and solar grew while hydro fell.

✅ Natural gas reached 32% of generation, highest share

✅ Coal fell; renewables roughly tied nuclear at ~20%

✅ Wind and solar up; hydro output down vs 2017


To complement our revival of US electricity capacity reports, here’s a revival of our reports on US electricity generation.

As with the fresh new capacity report, things are not looking too bright when it comes to electricity generation. There’s still a lot of grey — in the bar charts below, in the skies near fossil fuel power plants, and in the human and planetary outlook based on how slowly we are cutting fossil fuel electricity generation.

As you can see in the charts above, wind and solar energy generation increased notably from the first half of 2017 to the first half of 2018, and the EIA expected larger summer solar and wind generation in subsequent months, reinforcing that momentum.

A large positive when it comes to the environment and human health is that coal generation dropped a great deal year over year — by even more than renewables increased, though the EIA later noted an increase in coal-fired generation in a subsequent year, complicating the trend. However, on the down side, natural gas soared as it became the #1 source of electricity generation in the United States (32% of US electricity). Furthermore, coal was still solidly in the #2 position (27% of US electricity). Renewables and nuclear were essentially in a tie at 19.8% of generation, with renewables just a tad above nuclear.

Actually, combined with an increase in nuclear power generation, natural gas electricity production increased so much that the renewable energy share of electricity generation actually dropped in the first half of 2018 versus the first half of 2017, even amid declining electricity use in some periods. It was 19.8% this year and 20% last year.

Again, solar and wind saw a significant growth in its market share, from 9% to 9.9%, but hydro brought the whole category down due to a decrease from 9% to 8%.

The visuals above are probably the best way to examine it all. The H1 2018 chart was still dominated by fossil fuels, which together accounted for approximately 60% of electricity generation, even though by 2021 non-fossil sources supplied about 40% of U.S. electricity, highlighting the longer-term shift. In H1 2017, the figure was 59.7%. Furthermore, if you switch to the “Change H1 2018 vs H1 2017 (GWh)” chart, you can watch a giant grey bar representing natural gas take over the top of the chart. It almost looks like it’s part of the border of the chart. The biggest glimmer of positivity in that chart is seeing the decline in coal at the bottom.

What will the second half of the year bring? Well, the gigantic US electricity generation market shifts slowly, even as monthly figures can swing, as January generation jumped 9.3% year over year according to the EIA, reminding us about volatility. There is so much base capacity, and power plants last so long, that it takes a special kind of magic to create a rapid transition to renewable energy. As you know from reading this quarter’s US renewable energy capacity report, only 43% of new US power capacity in the first half of the year was from renewables. The majority of it was from natural gas. Along with other portions of the calculation, that means that electricity generation from natural gas is likely to increase more than electricity generation from renewables.

Jump into the numbers below and let us know if you have any more thoughts.


Related News

View more

Sign Up for Electricity Forum’s Newsletter

Stay informed with our FREE Newsletter — get the latest news, breakthrough technologies, and expert insights, delivered straight to your inbox.

Electricity Today T&D Magazine Subscribe for FREE

Stay informed with the latest T&D policies and technologies.
  • Timely insights from industry experts
  • Practical solutions T&D engineers
  • Free access to every issue

Live Online & In-person Group Training

Advantages To Instructor-Led Training – Instructor-Led Course, Customized Training, Multiple Locations, Economical, CEU Credits, Course Discounts.

Request For Quotation

Whether you would prefer Live Online or In-Person instruction, our electrical training courses can be tailored to meet your company's specific requirements and delivered to your employees in one location or at various locations.