Testing of schools conducted near hydro corridor

By Toronto Star


NFPA 70e Training

Our customized live online or in‑person group training can be delivered to your staff at your location.

  • Live Online
  • 6 hours Instructor-led
  • Group Training Available
Regular Price:
$199
Coupon Price:
$149
Reserve Your Seat Today
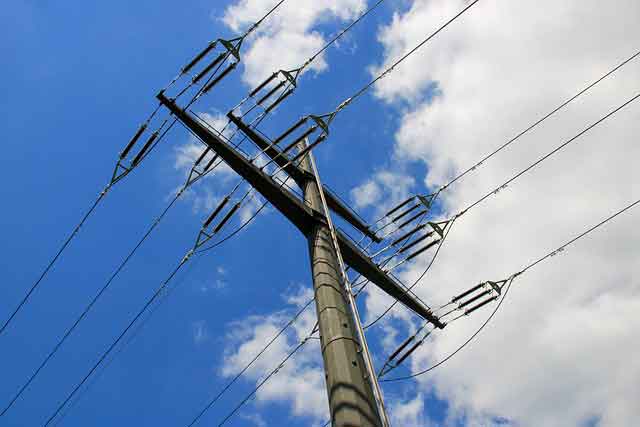
Two Toronto schools found to have high readings for electromagnetic fields will be undergoing further testing to ensure students and staff aren't at risk, a Toronto Public Health official says.

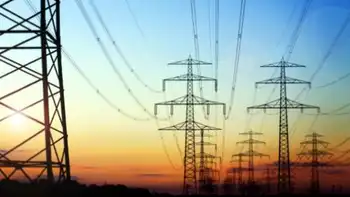
In what's believed to be a first in the city, Toronto Public Health tested 31 schools this spring that are next to hydro corridors.

The tests found that two – Monsignor John Corrigan elementary in Etobicoke, and JS Woodsworth senior public school in Scarborough – had the highest readings.

The Etobicoke Catholic school had a snapshot reading of 69.9 milligauss (mG) and the one in Scarborough showed 29 mG. According to public health, background levels of electromagnetic fields (EMF) in urban areas are usually less than 1 mG.

Both tests were done outside, on school property. Further testing is scheduled for inside.

A test at Tamarisk Park, near the Etobicoke school, had readings of between 33 and 81 mG.

Though Canada follows international guidelines permitting short-term exposure at no more than 833 mG, studies have shown the risk of leukemia in children increases if they're exposed to average levels, year-round, above 3 or 4 mG.

Ronald Macfarlane, a supervisor in the city's environmental health assessment section, said short-term exposure to high EMF levels won't significantly raise a person's yearly average level. There's no need for parents to be alarmed, he said.

"We're encouraging schools to take practical measures to not unduly increase exposure to EMF," Macfarlane said.

Still, public health is recommending the schools come up with a "management plan" so children at the two schools aren't exposed too long to areas with high readings, Macfarlane said.

The Catholic board will notify parents in a letter.

The public board will wait for the results from indoor testing, and if concerns remain after those results are in, a meeting will be scheduled with parents.

Electric and magnetic fields are invisible lines of force, part of the spectrum of electromagnetic radiation.

Aside from studying EMF levels beside hydro corridors, public health has published an extensive new report on EMF exposure in general. In it, Dr. David McKeown, the city's medical officer of health, calls for housing developments, schools and recreational facilities beside these corridors to develop "management plans."

The goal is to minimize yearly average exposure, especially for children. Plans can be as simple as locating areas of high child activity away from EMF hot spots.

Related News

BC Hydro says three LNG companies continue to demand electricity, justifying Site C

BC Hydro LNG Load Forecast signals rising electricity demand from LNG Canada, Woodfibre, and Tilbury, aligning Site C dam capacity with BCUC review, hydroelectric supply, and a potential fourth project in feasibility study British Columbia.


Key Points

BC Hydro's projection of LNG-driven power demand, guiding Site C capacity, BCUC review, and grid planning.

✅ Includes LNG Canada, Woodfibre, and Tilbury load requests

✅ Aligns Site C hydroelectric output with industrial electrification

✅ Notes feasibility study for a fourth LNG project


Despite recent project cancellations, such as the Siwash Creek independent power project now in limbo, BC Hydro still expects three LNG projects — and possibly a fourth, which is undergoing a feasibility study — will need power from its controversial and expensive Site C hydroelectric dam.

In a letter sent to the British Columbia Utilities Commission (BCUC) on Oct. 3, BC Hydro’s chief regulatory officer Fred James said the provincially owned utility’s load forecast includes power demand for three proposed liquefied natural gas projects because they continue to ask the company for power.

The letter and attached report provide some detail on which of the LNG projects proposed in B.C. are more likely to be built, given recent project cancellations.

The documents are also an attempt to explain why BC Hydro continues to forecast a surge in electricity demand in the province, as seen in its first call for power in 15 years driven by electrification, even though massive LNG projects proposed by Malaysia’s state owned oil company Petronas and China’s CNOOC Nexen have been cancelled.

An explanation is needed because B.C.’s new NDP government had promised the BCUC would review the need for the $9-billion Site C dam, which was commissioned to provide power for the province’s nascent LNG industry, amid debates over alternatives like going nuclear among residents. The commission had specifically asked for an explanation of BC Hydro’s electric load forecast as it relates to LNG projects by Wednesday.

The three projects that continue to ask BC Hydro for electricity are Shell Canada Ltd.’s LNG Canada project, the Woodfibre LNG project and a future expansion of FortisBC’s Tilbury LNG storage facility.

None of those projects have officially been sanctioned but “service requests from industrial sector customers, including LNG, are generally included in our industrial load forecast,” the report noted, even as Manitoba Hydro warned about energy-intensive customers in a separate notice.

In a redacted section of the report, BC Hydro also raises the possibility of a fourth LNG project, which is exploring the need for power in B.C.

“BC Hydro is currently undertaking feasibility studies for another large LNG project, which is not currently included in its Current Load Forecast,” one section of the report notes, though the remainder of the section is redacted.

The Site C dam, which has become a source of controversy in B.C. and was an important election issue, is currently under construction and, following two new generating stations recently commissioned, is expected to be in service by 2024, a timeline which had been considered to provide LNG projects with power by the time they are operational.

BC Hydro’s letter to the BCUC refers to media and financial industry reports that indicate global LNG markets will require more supply by 2023.

“While there remains significant uncertainty, global LNG demand will continue to grow and there is opportunity for B.C. LNG,” the report notes.


Related News

View more

Wind has become the ‘most-used’ source of renewable electricity generation in the US

U.S. Wind Generation surpassed hydroelectric output in 2019, EIA data shows, becoming the top renewable electricity source, driven by PTC incentives, expanded capacity, and utility-scale projects across states, boosting the national electricity mix.


Key Points

U.S. Wind Generation is the nation's top renewable, surpassing hydro as EIA-tracked capacity grows under PTC incentives.

✅ EIA: wind topped hydro in 2019, over 300M MWh generated

✅ PTC credits spurred growth in utility-scale wind projects

✅ 103 GW installed; 77% added in the last decade


Last year saw wind power surging in the U.S. to overtake hydroelectric generation for the first time, according to data from the U.S. Energy Information Administration (EIA).

Released Wednesday, the figures from the EIA’s “Electric Power Monthly” report show that yearly wind generation hit a little over 300 million megawatt hours (MWh) in 2019. This was roughly 26 million MWh more than hydroelectric production.

Wind now represents the “most-used renewable electricity generation source” in the U.S., the EIA said, and renewables hit a 28% monthly record in April in later data.

Overall, total renewable electricity generation — which includes sources such as solar's 4.7% share in 2022 as one example, geothermal and landfill gas — at utility scale facilities hit more than 720 million MWh in 2019, compared to just under 707 million MWh in 2018. To put things in perspective, generation from coal came to more than 966 million MWh in 2019, while renewables surpassed coal in 2022 nationally according to later analyses.

According to the EIA’s “Today in Energy” briefing, which was also published Wednesday, generation from wind power has grown “steadily” across the last decade, and by 2020, renewables became the second-most prevalent source in the U.S. power mix.

This, it added, was partly down to the extension of the Production Tax Credit, or PTC, amid favorable government plans supporting solar and wind growth. According to the EIA, the PTC is a system which gives operators a tax credit per kilowatt hour of renewable electricity production. It applies for the first 10 years of a facility’s operation.

At the end of 2019, the country was home to 103 gigawatts (GW) of wind capacity, with 77% of this being installed in the last decade, and wind capacity surpassed hydro in 2016 according to industry data. The U.S. is home 80 GW of hydroelectric capacity, according to the EIA.

“The past decade saw a steady increase in wind capacity across the country and we capped the decade with a monumental achievement for the industry in reaching more than 100 GW,” Tom Kiernan, the American Wind Energy Association’s CEO, said in a statement issued Thursday.

“And more wind energy is coming, as the industry is well into investing $62 billion in new projects over the next few years that put us on the path to achieving 20 percent of the nation’s electricity mix in 2030,” Kiernan went on to state.

“As a result, wind is positioned to remain the largest renewable energy generator in the country for the foreseeable future.”


Related News

View more

Energy-hungry Europe to brighten profit at US solar equipment makers

European Solar Inverter Demand surges as photovoltaics and residential solar expand during the clean energy transition, driven by high natural gas prices; Germany leads, boosting Enphase and SolarEdge sales for rooftop systems and grid-tied installations.


Key Points

Rising European need for solar inverters, fueled by residential PV growth, high energy costs, and clean energy policies.

✅ Germany leads EU rooftop PV installations

✅ Enphase and SolarEdge see revenue growth

✅ High gas prices and policies spur adoption


Solar equipment makers are expected to post higher quarterly profit, benefiting from strong demand in Europe for critical components that convert energy from the sun into electricity, amid record renewable momentum worldwide.

The continent is emerging as a major market for solar firms as it looks to reduce its dependence on the Russian energy supply and accelerate its clean energy transition, with solar already reshaping power prices in Northern Europe across the region, brightening up businesses of companies such as Enphase Energy (ENPH.O) and SolarEdge Technologies (SEDG.O), which make solar inverters.

Wall Street expects Enphase and SolarEdge to post a combined adjusted net income of $323.8 million for the April-June quarter, a 56.7% jump from a year earlier, even as demand growth slows in the United States.

The energy crisis in Europe is not as acute as last year when Western sanctions on Russia severely crimped supplies, but prices of natural gas and electricity continue to be much higher than in the United States, Raymond James analyst Pavel Molchanov said.

As a result, demand for residential solar keeps growing at a strong pace in the region, with Germany being one of the top markets and solar adoption in Poland also accelerating in recent years across the region.

About 159,000 residential solar systems became operational in the first quarter in Germany amid a solar power boost that reflects policy and demand, a 146% rise from a year earlier, according to BSW solar power association.

Adoption of solar is also helping European homeowners have greater control over their energy costs as fossil fuel prices tend to be more volatile, Morningstar analyst Brett Castelli said.

SolarEdge, which has a bigger exposure to Europe than Enphase, said its first-quarter revenue from the continent more than doubled compared with last year.

In comparison, growth in the United States has been tepid due to lukewarm demand in states like Texas and Arizona where cheaper electricity prices make the economics of residential solar less attractive, even though solar is now cheaper than gas in parts of the U.S. market.

Higher interest rates following the U.S. Federal Reserve's recent actions to tame inflation are also weighing on demand, even as power outage risks rise across the United States.

Analysts also expect weakness in California where a new metering reform reduces the money credited to rooftop solar owners for sending excess power into the grid, underscoring how policy shifts can reshape the sector. The sunshine state accounts for nearly a third of the U.S. residential solar market.

Enphase will report its results on Thursday after the bell, while SolarEdge will release its second-quarter numbers on Aug. 1.


Related News

View more

UK low-carbon electricity generation stalls in 2019

UK low-carbon electricity 2019 saw stalled growth as renewables rose slightly, wind expanded, nuclear output fell, coal hit record lows, and net-zero targets demand faster deployment to cut CO2 intensity below 100gCO2/kWh.


Key Points

Low-carbon sources supplied 54% of UK power in 2019, up just 1TWh; wind grew, nuclear fell, and coal dropped to 2%.

✅ Wind up 8TWh; nuclear down 9TWh amid outages

✅ Fossil fuels 43% of generation; coal at 2%

✅ Net-zero needs 15TWh per year added to 2030


The amount of electricity generated by low-carbon sources in the UK stalled in 2019, Carbon Brief analysis shows.

Low-carbon electricity output from wind, solar, nuclear, hydro and biomass rose by just 1 terawatt hour (TWh, less than 1%) in 2019. It represents the smallest annual increase in a decade, where annual growth averaged 9TWh. This growth will need to double in the 2020s to meet UK climate targets while replacing old nuclear plants as they retire.

Some 54% of UK electricity generation in 2019 came from low-carbon sources, including 37% from renewables and 20% from wind alone, underscoring wind's leading role in the power mix during key periods. A record-low 43% was from fossil fuels, with 41% from gas and just 2% from coal, also a record low. In 2010, fossil fuels generated 75% of the total.

Carbon Brief’s analysis of UK electricity generation in 2019 is based on figures from BM Reports and the Department for Business, Energy and Industrial Strategy (BEIS). See the methodology at the end for more on how the analysis was conducted.

The numbers differ from those published earlier in January by National Grid, which were for electricity supplied in Great Britain only (England, Wales and Scotland, but excluding Northern Ireland), including via imports from other countries.

Low-carbon low
In 2019, the UK became the first major economy to target net-zero greenhouse gas emissions by 2050, increasing the ambition of its legally binding Climate Change Act.

To date, the country has cut its emissions by around two-fifths since 1990, with almost all of its recent progress coming from the electricity sector.

Emissions from electricity generation have fallen rapidly in the decade since 2010 as coal power has been almost phased out and even gas output has declined. Fossil fuels have been displaced by falling demand and by renewables, such as wind, solar and biomass.

But Carbon Brief’s annual analysis of UK electricity generation shows progress stalled in 2019, with the output from low-carbon sources barely increasing compared to a year earlier.

The chart below shows low-carbon generation in each year since 2010 (grey bars) and the estimated level in 2019 (red). The pale grey bars show the estimated future output of existing low-carbon sources after old nuclear plants retire and the pale red bars show the amount of new generation needed to keep electricity sector emissions to less than 100 grammes of CO2 per kilowatt hour (gCO2/kWh), the UK’s nominal target for the sector.

 Annual electricity generation in the UK by fuel, terawatt hours, 2010-2019. Top panel: fuel by fuel. Bottom panel: cumulative total generation from all sources. Source: BEIS energy trends, BM Reports and Carbon Brief analysis. Chart by Carbon Brief using Highcharts.
As the chart shows, the UK will require significantly more low-carbon electricity over the next decade as part of meeting its legally binding climate goals.

The nominal 100gCO2/kWh target for 2030 was set in the context of the UK’s less ambitious goal of cutting emissions to 80% below 1990 levels by 2050. Now that the country is aiming to cut emissions to net-zero by 2050, that 100gCO2/kWh indicator is likely to be the bare minimum.

Even so, it would require a rapid step up in the pace of low-carbon expansion, compared to the increases seen over the past decade. On average, low-carbon generation has risen by 9TWh each year in the decade since 2010 – including a rise of just 1TWh in 2019.

Given scheduled nuclear retirements and rising demand expected by the Committee on Climate Change (CCC) – with some electrification of transport and heating – low-carbon generation would need to increase by 15TWh each year until 2030, just to meet the benchmark of 100gCO2/kWh.

For context, the 3.2 gigawatt (GW) Hinkley C new nuclear plant being built in Somerset will generate around 25TWh once completed around 2026. The world’s largest offshore windfarm, the 1.2GW Hornsea One scheme off the Yorkshire coast, will generate around 5TWh each year.

The new Conservative government is targeting 40GW of offshore wind by 2030, up from today’s figure of around 8GW. If policies are put in place to meet this goal, then it could keep power sector emissions below 100gCO2/kWh, depending on the actual performance of the windfarms built.

However, new onshore wind and solar, further new nuclear or other low-carbon generation, such as gas with carbon capture and storage (CCS), is likely to be needed if demand is higher than expected, or if the 100gCO2/kWh benchmark is too weak in the context of net-zero by 2050.

The CCC says it is “likely” to “reflect the need for more rapid deployment” of low-carbon towards net-zero emissions in its advice on the sixth UK carbon budget for 2033-2037, due in September.

Trading places
Looking more closely at UK electricity generation in 2019, Carbon Brief’s analysis shows why there was so little growth for low-carbon sources compared to the previous year.

There was another increase for wind power in 2019 (up 8TWh, 14%), with record wind generation as several large new windfarms were completed including the 1.2GW Hornsea One project in October and the 0.6GW Beatrice offshore windfarm in Q2 of 2019. But this was offset by a decline for nuclear (down 9TWh, 14%), due to ongoing outages for reactors at Hunterston in Scotland and Dungeness in Kent.

(Analysis of data held by trade organisation RenewableUK suggests some 0.6GW of onshore wind capacity also started operating in 2019, including the 0.2GW Dorenell scheme in Moray, Scotland.)

As a result of these movements, the UK’s windfarms overtook nuclear for the first time ever in 2019, becoming the country’s second-largest source of electricity generation, and earlier, wind and solar together surpassed nuclear in the UK as momentum built. This is shown in the figure below, with wind (green line, top panel) trading places with nuclear (purple) and gas (dark blue) down around 25% since 2010 but remaining the single-largest source.

 Annual electricity generation in the UK by fuel, terawatt hours, 2010-2019. Top panel: fuel by fuel. Bottom panel: cumulative total generation from all sources. Source: BEIS energy trends, BM Reports and Carbon Brief analysis. Chart by Carbon Brief using Highcharts.
The UK’s currently suspended nuclear plants are due to return to service in January and March, according to operator EDF, the French state-backed utility firm. However, as noted above, most of the UK’s nuclear fleet is set to retire during the 2020s, with only Sizewell B in Suffolk due to still be operating by 2030. Hunterston is scheduled to retire by 2023 and Dungeness by 2028.

Set against these losses, the UK has a pipeline of offshore windfarms, secured via “contracts for difference” with the government, at a series of auctions. The most recent auction, in September 2019, saw prices below £40 per megawatt hour – similar to current wholesale electricity prices.

However, the capacity contracted so far is not sufficient to meet the government’s target of 40GW by 2030, meaning further auctions – or some other policy mechanism – will be required.

Coal zero
As well as the switch between wind and nuclear, 2019 also saw coal fall below solar for the first time across a full year, echoing the 2016 moment when wind outgenerated coal across the UK, after it suffered another 60% reduction in electricity output. Just six coal plants remain in the UK, with Aberthaw B in Wales and Fiddlers Ferry in Cheshire closing in March.

Coal accounted for just 2% of UK generation in 2019, a record-low coal share since centralised electricity supplies started to operate in 1882. The fuel met 40% of UK needs as recently as 2012, but has plummeted thanks to falling demand, rising renewables, cheaper gas and higher CO2 prices.

The reduction in average coal generation hides the fact that the fuel is now often not required at all to meet the UK’s electricity needs. The chart below shows the number of days each year when coal output was zero in 2019 (red line) and the two previous years (blue).

 Cumulative number of days when UK electricity generation from renewable sources has been higher than that from fossil fuels. Source: BEIS energy trends, BM Reports and Carbon Brief analysis. Chart by Carbon Brief using Highcharts.
The 83 days in 2019 with zero coal generation amount to nearly a quarter of the year and include the record-breaking 18-day stretch without the fuel.

Great Britain has been running for a record TWO WEEKS without using coal to generate electricity – the first time this has happened since 1882.

The country’s grid has been coal-free for 45% of hours in 2019 so far.https://www.carbonbrief.org/countdown-to-2025-tracking-the-uk-coal-phase-out …

Coal generation was set for significant reductions around the world in 2019 – including a 20% reduction for the EU as a whole – according to analysis published by Carbon Brief in November.

Notably, overall UK electricity generation fell by another 9TWh in 2019 (3%), bringing the total decline to 58TWh since 2010. This is equivalent to more than twice the output from the Hinkley C scheme being built in Somerset. As Carbon Brief explained last year, falling demand has had a similar impact on electricity-sector CO2 emissions as the increase in output from renewables.

This is illustrated by the fact that the 9TWh reduction in overall generation translated into a 9TWh (6%) cut in fossil-fuel generation during 2019, with coal falling by 10TWh and gas rising marginally.

Increasingly renewable
As fossil-fuel output and overall generation have declined, the UK’s renewable sources of electricity have continued to increase. Their output has risen nearly five-fold in the past decade and their share of the UK total has increased from 7% in 2010 to 37% in 2019.

As a result, the UK’s increasingly renewable grid is seeing more minutes, hours and days during which the likes of wind, solar and biomass collectively outpace all fossil fuels put together, and on some days wind is the main source as well.

The chart below shows the number of days during each year when renewables generated more electricity than fossil fuels in 2019 (red line) and each of the previous four years (blue lines). In total, nearly two-fifths of days in 2019 crossed this threshold.

 Cumulative number of days when the UK has not generated any electricity from coal. Source: BEIS energy trends, BM Reports and Carbon Brief analysis. Chart by Carbon Brief using Highcharts.
There were also four months in 2019 when renewables generated more of the UK’s electricity than fossil fuels: March, August, September and December. The first ever such month came in September 2018 and more are certain to follow.

National Grid, which manages Great Britain’s high-voltage electricity transmission network, is aiming to be able to run the system without fossil fuels by 2025, at least for short periods. At present, it sometimes has to ask windfarm operators to switch off and gas plants to start running in order to keep the electricity grid stable.

Note that biomass accounted for 11% of UK electricity generation in 2019, nearly a third of the total from all renewables. Some two-thirds of the biomass output is from “plant biomass”, primarily wood pellets burnt at Lynemouth in Northumberland and the Drax plant in Yorkshire. The remainder was from an array of smaller sites based on landfill gas, sewage gas or anaerobic digestion.

The CCC says the UK should “move away” from large-scale biomass power plants, once existing subsidy contracts for Drax and Lynemouth expire in 2027.

Using biomass to generate electricity is not zero-carbon and in some circumstances could lead to higher emissions than from fossil fuels. Moreover, there are more valuable uses for the world’s limited supply of biomass feedstock, the CCC says, including carbon sequestration and hard-to-abate sectors with few alternatives.

Methodology
The figures in the article are from Carbon Brief analysis of data from BEIS Energy Trends chapter 5 and chapter 6, as well as from BM Reports. The figures from BM Reports are for electricity supplied to the grid in Great Britain only and are adjusted to include Northern Ireland.

In Carbon Brief’s analysis, the BM Reports numbers are also adjusted to account for electricity used by power plants on site and for generation by plants not connected to the high-voltage national grid. This includes many onshore windfarms, as well as industrial gas combined heat and power plants and those burning landfill gas, waste or sewage gas.

By design, the Carbon Brief analysis is intended to align as closely as possible to the official government figures on electricity generated in the UK, reported in BEIS Energy Trends table 5.1.

Briefly, the raw data for each fuel is in most cases adjusted with a multiplier, derived from the ratio between the reported BEIS numbers and unadjusted figures for previous quarters.

Carbon Brief’s method of analysis has been verified against published BEIS figures using “hindcasting”. This shows the estimates for total electricity generation from fossil fuels or renewables to have been within ±3% of the BEIS number in each quarter since Q4 2017. (Data before then is not sufficient to carry out the Carbon Brief analysis.)

For example, in the second quarter of 2019, a Carbon Brief hindcast estimates gas generation at 33.1TWh, whereas the published BEIS figure was 34.0TWh. Similarly, it produces an estimate of 27.4TWh for renewables, against a BEIS figure of 27.1TWh.

National Grid recently shared its own analysis for electricity in Great Britain during 2019 via its energy dashboard, which differs from Carbon Brief’s figures.


Related News

View more

Shell says electricity to meet 60 percent of China's energy use by 2060

China 2060 Carbon-Neutral Energy Transition projects tripled electricity, rapid electrification, wind and solar dominance, scalable hydrogen, CCUS, and higher carbon pricing to meet net-zero goals while decarbonizing heavy industry and transport.


Key Points

Shell's outlook for China to reach net zero by 2060 via electrification, renewables, hydrogen, CCUS, and carbon pricing.

✅ Power supply to 60% of energy; generation triples by 2060.

✅ Wind and solar reach 80% of electricity; coal declines sharply.

✅ Hydrogen scales to 17 EJ; CCUS and carbon pricing expand.


China may triple electricity generation to supply 60 percent of the country's total energy under Beijing's carbon-neutral goal by 2060, up from the current 23 per cent, according to Royal Dutch Shell.

Shell is one of the largest global investors in China's energy sector, with business covering gas production, petrochemicals and a retail fuel network. A leading supplier of liquefied natural gas, it has recently expanded into low-carbon business such as hydrogen power and electric vehicle charging.

In a rare assessment of the country's energy sector by an international oil major, Shell said China needed to take quick action this decade to stay on track to reach the carbon-neutrality goal.

China has mapped out plans to reach peak emissions by 2030, and aims to reduce coal power production over the coming years, but has not yet revealed any detailed carbon roadmap for 2060.

This includes investing in a reliable and renewable power system, including compressed air generation, and demonstrating technologies that transform heavy industry using hydrogen, biofuel and carbon capture and utilization.

"With early and systematic action, China can deliver better environmental and social outcomes for its citizens while being a force for good in the global fight against climate change," Mallika Ishwaran, chief economist of Shell International, told a webinar hosted by the company's China business.

Shell expects China's electricity generation to rise three-fold to more than 60 exajoules (EJ) in 2060 from 20 EJ in 2020, even amid power supply challenges reported recently.

Solar and wind power are expected to surpass coal as the largest sources of electricity by 2034 in China, reflecting projections that renewables will eclipse coal globally by mid-decade, versus the current 10 percent, rising to 80 percent by 2060, Shell said.

Hydrogen is expected to scale up to 17 EJ, or equivalent to 580 million tonnes of coal by 2060, up from almost negligible currently, adding over 85 percent of the hydrogen will be produced through electrolysis, supported by PEM hydrogen R&D across the sector, powered by renewable and nuclear electricity, Shell said.

Hydrogen will meet 16 percent of total energy use in 2060 with heavy industry and long-distance transport as top hydrogen users, the firm added.

The firm also expects China's carbon price to rise to 1,300 yuan (CDN$256.36) per tonne in 2060 from 300 yuan in 2030.

Nuclear, on a steady development track, and biomass will have niche but important roles for power generation in the years to come, Shell said.

Electricity generated from biomass, combined with carbon, capture, utilization and storage (CCUS), provide a source of negative emissions for the rest of the energy system from 2053, it added.


Related News

View more

Electricity demand set to reduce if UK workforce self-isolates

UK Energy Networks Coronavirus Contingency outlines ESO's lockdown electricity demand forecast, reduced industrial and commercial load, rising domestic use, Ofgem guidance needs, grid resilience, control rooms, mutual aid, and backup centers.


Key Points

A coordinated plan with ESO forecasts, safeguards, and mutual aid to keep power and gas services during a lockdown.

✅ ESO forecasts lower industrial use, higher domestic demand

✅ Control rooms protected; backup sites and cross-trained staff

✅ Mutual aid and Ofgem coordination bolster grid resilience


National Grid ESO is predicting a reduction in electricity demand, consistent with residential use trends observed during the pandemic, in the case of the coronavirus spread prompting a lockdown across the country.

Its analysis shows the reduction in commercial and industrial use would outweigh an upsurge in domestic demand, mirroring Ontario demand data seen as people stayed home, according to similar analyses.

The prediction was included in an update from the Energy Networks Association (ENA), in which it sought to reassure the public that contingency plans are in place, reflecting utility disaster planning across electric and gas networks, to ensure services are unaffected by the coronavirus spread.

The body, which represents the UK's electricity and gas network companies, said "robust measures" had been put in place to protect control rooms and contact centres, similar to staff lockdown protocols considered by other system operators, to maintain resilience. To provide additional resilience, engineers have been trained across multiple disciplines and backup centres exist should operations need to be moved if, for example, deep cleaning is required, the ENA said.

Networks also have industry-wide mutual aid arrangements, similar to grid response measures outlined in the U.S., for people and the equipment needed to keep gas and electricity flowing.

ENA chief executive, David Smith, said, echoing system reliability assurances from other markets: "The UK's electricity and gas network is one of the most reliable in the world and network operators are working with the authorities to ensure that their contingency plans are reviewed and delivered in accordance with the latest expert advice. We are following this advice closely and reassuring customers that energy networks are continuing to operate as normal for the public."

Utility Week spoke to a senior figure at one of the networks who reiterated the robust measures in place to keep the lights on, even as grid alerts elsewhere highlight the importance of contingency planning. However, they pleaded for more clarity from Ofgem and government on how its workers will be treated if the coronavirus spread becomes a pandemic in the UK.


Related News

View more

Sign Up for Electricity Forum’s Newsletter

Stay informed with our FREE Newsletter — get the latest news, breakthrough technologies, and expert insights, delivered straight to your inbox.

Electricity Today T&D Magazine Subscribe for FREE

Stay informed with the latest T&D policies and technologies.
  • Timely insights from industry experts
  • Practical solutions T&D engineers
  • Free access to every issue

Download the 2025 Electrical Training Catalog

Explore 50+ live, expert-led electrical training courses –

  • Interactive
  • Flexible
  • CEU-cerified