Wisconsin regulators approve tighter mercury limits

By Associated Press


Protective Relay Training - Basic

Our customized live online or in‑person group training can be delivered to your staff at your location.

  • Live Online
  • 12 hours Instructor-led
  • Group Training Available
Regular Price:
$699
Coupon Price:
$599
Reserve Your Seat Today
Wisconsin utilities would have to cut mercury emissions by 90 percent over the next decade under a rule the state Natural Resources Board unanimously approved.

The provision would create the tightest limits on mercury ever adopted in Wisconsin. State air officials say the rule will mean cleaner air and make fish safer to eat.

But environmentalists have complained the rule is weak.

Businesses say utilities will have to spend tens of millions of dollars to comply, driving up electric bills.

"The... board just voted to significantly raise the cost of energy for every household and every business in the state," Scott Manley, environmental policy director for Wisconsin Manufacturers & Commerce, said in a statement.

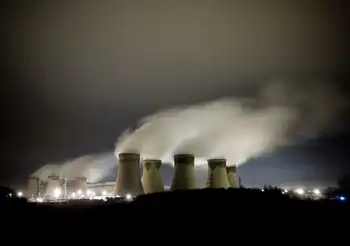
Mercury, a byproduct of burning coal at power plants, can cause neurological defects and increase the risk of heart disease. It can especially accumulate in fish, and the DNR has warned people for years to limit consumption from any state lake, river or stream because contamination is so widespread.

The DNR four years ago adopted rules that required major utilities to cut mercury emissions by 75 percent by 2015. Democratic Gov. Jim Doyle ordered the agency during his 2006 re-election campaign to bump that up to 90 percent by 2018.

Under the proposal the Natural Resources Board approved 7-0 at a meeting in Waupaca, utilities must reduce mercury emissions by 90 percent by 2015. They could extend that deadline until 2021 if they can achieve a 70 percent mercury reduction, an 85 percent reduction in sulfur dioxide and a 50 percent reduction in nitrogen oxide by 2015. Sulfur dioxide and nitrogen oxide contribute to smog and haze.

The DNR estimates utilities will have to spend $38 million to $91 million annually to comply, depending on whether they choose the cheaper mercury-sulfur dioxide-nitrogen oxide approach or the straight 90 percent mercury option. That would mean another $5 to $12 more annually for the average homeowner, according to the DNR.

Minnesota requires 90 percent reductions by 2015. Illinois requires 90 percent reductions between 2009 and 2015 depending on how a utility chooses to comply.

Dan Kohler, director of environmental advocacy group Wisconsin Environment, said Wisconsin is moving too slowly.

"2015 or 2021 isn't soon enough," Kohler said. "Given the importance of our lakes and people's right to be able to take their families out and eat the fish they catch, we ought to address this problem now."

Wisconsin utilities have been working on projects designed to reduce sulfur dioxide, nitrogen oxide and mercury. But technology that could generate 90 percent reductions in mercury emissions is still evolving, they say.

Connie Lawniczak oversees environmental compliance for Wisconsin Public Service Corp., the utility that serves much of northeastern Wisconsin. She said the rule should have called for 90 percent only if the technology becomes viable.

"There is no technology we can go buy off the shelf to get us to 90 percent removal at all plants," she said. "That's a number that's in the future."

A coalition of business groups, including WMC, sued to block the rule, claiming the DNR didn't prepare a proper estimate of the rule's impact. A Dane County judge dismissed the lawsuit on Monday, saying an estimate on mercury reductions in 2005 was sufficient, even though it didn't address the current proposal.

Manley said the state shouldn't adopt standards stricter than the 70 percent mercury reduction the U.S. Environmental Protection Agency adopted. A federal court struck down those standards earlier this year, but Manley said that level is more realistic for the state.

DNR Secretary Matt Frank defended the rule, saying the multi-pollutant approach is cost-effective and the provision will save health care costs and protect the state's $2.3 billion fishing industry.

"It's a worthwhile investment," Frank said.

The rule now goes to the Legislature's environmental committees, which can object to it and send it back to the DNR for changes. Mike Bruhn, a spokesman for state Rep. Scott Gunderson, a Waterford Republican and chairman of the Assembly Natural Resources Committee, said the 90 percent figure looks arbitrary and the plan appears too expensive for ratepayers to bear.

"Everybody wants clean air and everybody wants clean water. But the last time I checked, I don't know too many who don't have the lights on in their house and aren't going to use heat in the winter," he said.

Related News

There's a Russia-Sized Mystery in China's Electricity Sector

China Power Demand-Emissions Gap highlights surging grid demand outpacing renewables, with coal filling shortages despite record solar, wind, EV charging, and hydrogen growth, threatening decarbonization targets and net-zero pathways through 2030.


Key Points

China's power demand outpaces renewables, keeping coal dominant and raising emissions risk through the 2020s.

✅ Record solar and wind still lag fast grid demand growth

✅ Coal fills gaps as EV charging and hydrogen loads rise

✅ Forecasts diverge: CEC bullish vs IEA, BNEF conservative


Here’s a new obstacle that could prevent the world finally turning the corner on climate change: Imagine that over the coming decade a whole new economy the size of Russia were to pop up out of nowhere. With the world’s fourth-largest electricity sector and largest burden of power plant emissions after China, the U.S. and India, this new economy on its own would be enough to throw out efforts to halt global warming — especially if it keeps on growing through the 2030s.

That’s the risk inherent in China’s seemingly insatiable appetite for grid power, as surging electricity demand is putting systems under strain worldwide.

From the cracking pace of renewable build-out last year, you might think the country had broken the back of its carbon addiction. A record 55 gigawatts of solar power and 48 gigawatts of wind were connected — comparable to installing the generation capacity of Mexico in less than 12 months. This year will see an even faster pace, with 93 GW of solar and 50 GW of wind added, according to a report last week from the China Electricity Council, an industry association.

That progress could in theory see the country’s power sector emissions peak within months, rather than the late-2020s date the government has hinted at. Combined with a smaller quantity of hydro and nuclear, low-emissions sources will probably add about 310 terawatt-hours to zero-carbon generation this year. That 3.8% increase would be sufficient to power the U.K.

Countries that have reached China’s levels of per-capita electricity consumption (already on a par with most of Europe) typically see growth rates at less than half that level, even as global power demand has surged past pre-pandemic levels in recent years. Grid supply could grow at a faster pace than Brazil, Iran, South Korea or Thailand managed over the past decade without adding a ton of additional carbon to the atmosphere.

There’s a problem with that picture, however. If electricity demand grows at an even more headlong pace, there simply won’t be enough renewables to supply the grid. Fossil fuels, overwhelmingly coal, will fill the gap, a reminder of the iron law of climate dynamics in energy transitions.

Such an outcome looks distinctly possible. Electricity consumption in 2021 grew at an extraordinary rate of 10%, and will increase again by between 5% and 6% this year, according to the CEC. That suggests the country is on pace to match the CEC’s forecasts of bullish grid demand over the coming decade, with generation hitting 11,300 terawatt-hours in 2030. External analysts, such as the International Energy Agency and BloombergNEF, envisage a more modest growth to around 10,000 TWh. 

The difference between those two outlooks is vast — equivalent to all the electricity produced by Russia or Japan. If the CEC is right and the IEA and BloombergNEF are wrong, even the furious rate of renewable installations we’re seeing now won’t be enough to rein in China’s power-sector emissions.

Who’s correct? On one hand, it’s fair to say that power planners usually err on the side of overestimation. If your forecast for electricity demand is too high, state-owned generators will be less profitable than they otherwise would have been — but if it’s too low, you’ll see power cuts and shutdowns like China witnessed last autumn, with resulting power woes affecting supply chains beyond its borders.

On the other hand, the decarbonization of China’s economy itself should drive electricity demand well above what we’ve seen in the past, with some projections such as electricity meeting 60% of energy use by 2060 pointing to a profound shift. Some 3.3 million electric vehicles were sold in 2021 and BloombergNEF estimates a further 5.7 million will be bought in 2022. Every million EVs will likely add in the region of 2 TWh of load to the grid. Those sums quickly mounts up in a country where electric drivetrains are taking over a market that shifts more than 25 million new cars a year.

Decarbonizing industry, a key element on China’s road to zero emissions, could also change the picture. The IEA sees the country building 25 GW of electolysers to produce hydrogen by 2030, enough to consume some 200 TWh on their own if run close to full-time.

That’s still not enough to justify the scale of demand being forecast, though. China is already one of the least efficient countries in the world when it comes to translating energy into economic growth, and despite official pressure on the most wasteful, so called “dual-high” industries such as steel, oil refining, glass and cement, its targets for more thrifty energy usage remain pedestrian.

The countries that have decarbonized fastest are those, such as Germany, the U.K and the U.S., where Americans are using less electricity, that have seen power demand plateau or even decline, giving new renewable power a chance to swap out fossil-fired generators without chasing an ever-increasing burden on the grid. China’s inability to do this as its population peaks and energy consumption hits developed-country levels isn’t a sign of strength.

Instead, it’s a sign of a country that’s chronically unable to make the transition away from polluting heavy industry and toward the common prosperity and ecological civilization that its president keeps promising. Until China reins in that credit-fueled development model, the risks to its economy and the global climate will only increase.


Related News

View more

Nonstop Records For U.S. Natural-Gas-Based Electricity

U.S. Natural Gas Power Demand is surging for electricity generation amid summer heat, with ERCOT, Texas grid reserves tight, EIA reporting coal and nuclear retirements, renewables intermittency, and pipeline expansions supporting combined-cycle capacity and prices.


Key Points

It is rising use of natural gas for power, driven by summer heat, plant retirements, and new combined-cycle capacity.

✅ ERCOT reserve margin 9%, below 14% target in Texas

✅ Gas share of U.S. power near 40-43% this summer

✅ Coal and nuclear retirements shift capacity to combined cycle


As the hot months linger, it will be natural gas that is leaned on most to supply the electricity that we need to run our air conditioning loads on the grid and keep us cool.

And this is surely a great and important thing: "Heat causes most weather-related deaths, National Weather Service says."

Generally, U.S. gas demand for power in summer is 35-40% higher than what it was five years ago, with so much more coming (see Figure).

The good news is regions across the country are expected to have plenty of reserves to keep up with power demand.

The only exception is ERCOT, covering 90% of the electric load in Texas, where a 9% reserve margin is expected, below the desired 14%.

Last summer, however, ERCOT’s reserve margin also was below the desired level, yet the grid operator maintained system reliability with no load curtailments.

Simply put, other states are very lucky that Texas has been able to maintain gas at 50% of its generation, despite being more than justified to drastically increase that.

At about 1,600 Bcf per year, the flatness of gas for power demand in Texas since 2000 has been truly remarkable, especially since Lone Star State production is up 50% since then.

Increasingly, other U.S. states (and even countries) are wanting to import huge amounts of gas from Texas, a state that yields over 25% of all U.S. output.

Yet if Texas justifiably ever wants to utilize more of its own gas, others would be significantly impacted.

At ~480 TWh per year, if Texas was a country, it would be 9th globally for power use, even ahead of Brazil, a fast growing economy with 212 million people, and France, a developed economy with 68 million people.

In the near-term, this explains why a sweltering prolonged heat wave in July in Texas, with a hot Houston summer setting new electricity records, is the critical factor that could push up still very low gas prices.

But for California, our second highest gas using state, above-average snowpack should provide a stronger hydropower for this summer season relative to 2018.

Combined, Texas and California consume about 25% of U.S. gas, with Texas' use double that of California.


Across the U.S., gas could supply a record 40-43% of U.S. electricity this summer even as the EIA expects solar and wind to be larger sources of generation across the mix

Our gas used for power has increased 35-40% over the past five years, and January power generation also jumped on the year, highlighting broad momentum.

Our gas used for power has increased 35-40% over the past five years. DATA SOURCE: EIA; JTC

Indeed, U.S. natural gas for electricity has continued to soar, even as overall electricity consumption has trended lower in some years, at nearly 10,700 Bcf last year, a 16% rise from 2017 and easily the highest ever.

Gas is expected to supply 37% of U.S. power this year, even as coal-fired generation saw a brief uptick in 2021 in EIA data, versus 27% just five years ago (see Figure).

Capacity wise, gas is sure to continue to surge its share 45% share of the U.S. power system.

"More than 60% of electric generating capacity installed in 2018 was fueled by natural gas."

We know that natural gas will continue to be the go-to power source: coal and nuclear plants are retiring, and while growing, wind and solar are too intermittent, geography limited, and transmission short to compensate like natural gas can.

"U.S. coal power capacity has fallen by a third since 2010," and last year "16 gigawatts (16,000 MW) of U.S. coal-fired power plants retired."

This year, some 2,000 MW of coal was retired in February alone, with 7,420 MW expected to be closed in 2019.

Ditto for nuclear.

Nuclear retirements this year include Pilgrim, Massachusetts’s only nuclear plant, and Three Mile Island in Pennsylvania.

This will take a combined ~1,600 MW of nuclear capacity offline.

Another 2,500 MW and 4,300 MW of nuclear are expected to be leaving the U.S. power system in 2020 and 2021, respectively.

As more nuclear plants close, EIA projects that net electricity generation from U.S. nuclear power reactors will fall by 17% by 2025.

From 2019-2025 alone, EIA expects U.S. coal capacity to plummet nearly 25% to 176,000 MW, with nuclear falling 15% to 83,000 MW.

In contrast, new combined cycle gas plants will grow capacity almost 30% to around 310,000 MW.

Lower and lower projected commodity prices for gas encourage this immense gas build-out, not to mention non-stop increases in efficiency for gas-based units.

Remember that these are official U.S. Department of Energy estimates, not coming from the industry itself.

In other words, our Department of Energy concludes that gas is the future.

Our hotter and hotter summers are therefore more and more becoming: "summers for natural gas"

Ultimately, this shows why the anti-pipeline movement is so dangerous.

"Affordable Energy Coalition Highlights Ripple Effect of Natural Gas Moratorium."

In April, President Trump signed two executive orders to promote energy infrastructure by directing federal agencies to remove bottlenecks for gas transport into the Northeast in particular, where New England oil-fired generation has spiked, and to streamline federal reviews of border-crossing pipelines and other infrastructure.

Builders, however, are not relying on outside help: all they know is that more U.S. gas demand is a constant, so more infrastructure is mandatory.

They are moving forward diligently: for example, there are now some 27 pipelines worth $33 billion already in the works in Appalachia.


Related News

View more

Construction of expanded Hoa Binh Hydropower Plant to start October 2020

Expanded Hoa Binh Hydropower Plant increases EVN capacity with 480MW turbines, commercial loan financing, grid stability, flood control, and Da River reliability, supported by PECC1 feasibility work and CMSC collaboration on site clearance.


Key Points

A 480MW EVN expansion on the Da River to enhance grid stability, flood control, and seasonal water supply in Vietnam.

✅ 480MW, two turbines, EVN-led financing without guarantees

✅ Improves frequency modulation and national grid stability

✅ Supports flood control and dry-season water supply


The extended Hoa Binh Hydropower Plant, which is expected to break ground in October 2020, is considered the largest power project to be constructed this year, even as Vietnam advances a mega wind project planned for 2025.

Covering an area of 99.2 hectares, the project is invested by Electricity of Vietnam (EVN). Besides, Vietnam Electricity Power Projects Management Board No.1 (EVNPMB1) is the representative of the investor and Power Engineering Consulting JSC 1 (EVNPECC1) is in charge of building the feasibility report for the project. The expanded Hoa Binh Hydro Power Plant has a total investment of VND9.22 trillion ($400.87 million), 30 per cent of which is EVN’s equity and the remaining 70 per cent comes from commercial loans without a government guarantee.

According to the initial plan, EVN will begin the construction of the project in the second quarter of this year and is expected to take the first unit into operation in the third quarter of 2023, a timeline reminiscent of Barakah Unit 1 reaching full power, and the second one in the fourth quarter of the same year.

Chairman of the Committee for Management of State Capital at Enterprises (CMSC) Nguyen Hoang Anh said that in order to start the construction in time, CMSC will co-operate with EVN to work with partners as well as local and foreign banks to mobilise capital, reflecting broader nuclear project milestones across the energy sector.

In addition, EVN will co-operate with Hoa Binh People’s Committee to implement site clearance, remove Ba Cap port and select contractors.

Once completed, the project will contribute to preventing floods in the rainy season and supply water in the dry season. The plant expansion will include two turbines with the total capacity of 480MW, similar in scale to the 525-MW hydropower station China is building on a Yangtze tributary, and electricity output of about 488.3 million kWh per year.

In addition, it will help improve frequency modulation capability and stabilise the frequency of the national electricity system through approaches like pumped storage capacity, and reduce the working intensity of available turbines of the plant, thus prolonging the life of the equipment and saving maintenance and repair costs.

Built in the Da River basin in the northern mountainous province of Hoa Binh, at the time of its conception in 1979, Hoa Binh was the largest hydropower plant in Southeast Asia, while projects such as China’s Lawa hydropower station now dwarf earlier benchmarks.

The construction was supported by the Soviet Union all the way through, designing, supplying equipment, supervising, and helping it go on stream. Construction began in November 1979 and was completed 15 years later in December 1994, when it was officially commissioned, similar to two new BC generating stations recently brought online.


Related News

View more

27,000 Plus More Clean Energy Jobs Lost in May

U.S. Clean Energy Job Losses highlight COVID-19 impacts on renewable energy, solar, wind, and energy efficiency, with PPP fatigue, unemployment, and calls for Congressional stimulus, per Department of Labor data analyzed by E2.


Key Points

Pandemic-driven layoffs across renewable, solar, wind, and efficiency sectors, risking recovery without federal aid.

✅ Over 620,500 clean energy jobs lost in three months

✅ Energy efficiency, solar, and wind hit hardest nationwide

✅ Industry urges Congress for stimulus, tax credit relief


As Congress this week begins debating economic stimulus support for the energy industry, a new analysis of unemployment data shows the biggest part of America's energy economy - clean energy - lost another 27,000 jobs in May, bringing the total number of clean energy workers who have lost their jobs in the past three months to more than 620,500.

While May saw an improvement in new unemployment claims over March and April, the findings represent the sector's third straight month of significant job losses across solar, wind, energy efficiency, clean vehicles and other industries. With coronavirus cases once again rising in many states and companies beginning to run out of the Payroll Protection Program (PPP) funding that has helped small businesses keep workers employed, and as households confront pandemic power shut-offs that heighten energy insecurity, the report increases concerns the sector will be unable to resume its economy-leading jobs growth in the short- or long-term without a significant policy response.

Given the size and scope of the clean energy industry, such a sustained loss would cast a pall on the nation's overall economic recovery, as shifting electricity demand during COVID-19 complicates forecasts, according to the analysis of the Department of Labor's May unemployment data from E2 (Environmental Entrepreneurs), E4TheFuture and the American Council on Renewable Energy (ACORE).

Prior to COVID-19, clean energy - including energy efficiency, solar and wind generation, clean vehicles and related sectors - was among the U.S. economy's biggest and fastest-growing employment sectors, growing 10.4% since 2015 to nearly 3.4 million jobs at the end of 2019. That made clean energy by far the biggest employer of workers in all energy occupations, employing nearly three times as many people as the fossil fuel industry. For comparison, coal mining employs about 47,000 workers, even as clean energy projects in coal communities aim to revitalize local economies.

The latest monthly analysis for the groups by BW Research Partnership runs contrary to recent Bureau of Labor Statistics (BLS) reports, which indicated that a more robust economic rebound was underway, even as high fuel prices haven't spurred a green shift in adoption, while also acknowledging misclassifications and serious reporting difficulties in its own data.

Bob Keefe, Executive Director at E2, said:

"May's almost 30,000 clean energy jobs loss is sadly an improvement in the rate of jobs shed but make no mistake: There remains huge uncertainty and volatility ahead. It will be very tough for clean energy to make up these continuing job losses without support from Congress. Lawmakers must act now. If they do, we can get hundreds of thousands of these workers back on the job today and build a better, cleaner, more equitable economy for tomorrow. And who doesn't want that?"

Pat Stanton, Policy Director at E4TheFuture, said:

"Most of the time, energy efficiency workers need to go inside homes, businesses and other buildings to get the job done. Since they couldn't do that during COVID lockdowns, they couldn't work. Now states are opening up. But utilities, contractors and building owners need to protect employees and occupants from possible exposure to the virus and need more clarity about potential liabilities."

Gregory Wetstone, President and CEO of ACORE, said:

"In May, we saw thousands of additional renewable energy workers join the ranks of the unemployed, further underscoring the damage COVID-19 is inflicting on our workforce. Since the pandemic began, nearly 100,000 renewable energy workers have lost their jobs. We need help from Congress to get American clean energy workers back to work. With commonsense measures like temporary refundability and a delay in the phasedown of renewable energy tax credits, Congress can help restore these good-paying jobs so the renewable sector can continue to provide the affordable, pollution-free power American consumers and businesses want and deserve."

Phil Jordan, Vice President and Principal at BW Research Partnership, said:

"We understand the challenges and limitations of data collection for BLS in the middle of a global pandemic. But any suggestion that a strong employment rebound is underway in the United States simply is not reflected in the clean energy sector right now. And with PPP expiring, that only increases uncertainty in the months ahead."

The report comes as both the Senate Committee on Energy and Natural Resources and the House Energy and Commerce Committee are considering clean energy stimulus to restart the U.S. economy, and amid assessments of mixed results from the climate law shaping expectations, and as lawmakers in both the House and Senate are increasing calls for supporting clean energy workers and businesses, including this bicameral letter signed by 57 members of Congress and another signed today by 180 House members.

Industries Hit Hardest

According to the analysis, energy efficiency lost more jobs than any other clean energy sector for the third consecutive month in May, shedding about 18,900 jobs. These workers include electricians, HVAC technicians who work with high-efficiency systems, and manufacturing employees who make Energy Star appliances, LED lighting systems and efficient building materials.

Renewable energy, including solar and wind, lost nearly 4,300 jobs in May.

Clean grid and storage and clean vehicles manufacturing -- including grid modernization, energy storage, car charging and electric and plug-in hybrid vehicle manufacturing -- lost a combined 3,200 jobs in May, as energy crisis impacts electricity, gas, and EVs in several ways.

The clean fuels sector lost more than 650 jobs in May.

States and Localities Hit Across Country

California continues to be the hardest hit state in terms of total job losses, losing 4,313 jobs in May and more than 109,700 since the COVID-19 crisis began. Florida was the second hardest hit state in May, losing an additional 2,563 clean energy jobs, while Georgia, Texas, Washington, and Michigan all suffered more than 1,000 job losses across the sector. An additional 12 states saw at least 500 clean energy unemployment filings, and reports like Pennsylvania's clean energy jobs analysis provide added context, according to the latest analysis.

For a full breakdown of clean energy job losses in each state, along with a list of the hardest hit counties and metro areas, see the full analysis here.


Related News

View more

Is Hydrogen The Future For Power Companies?

Hydrogen Energy Transition accelerates green hydrogen, electrolyzers, renewables, and fuel cells, as the EU and US scale decarbonization, NextEra tests hydrogen-to-power, and DOE funds pilots to replace natural gas and cut CO2.


Key Points

A shift to deploy green hydrogen tech to decarbonize power, industry, and transport across EU and US energy systems.

✅ EU targets 40 GW electrolyzers plus 40 GW imports by 2030

✅ DOE funds pilots; NextEra trials hydrogen-to-power at Okeechobee

✅ Aims to replace natural gas, enable fuel cells, cut CO2


Last month, the European Union set out a comprehensive hydrogen strategy as part of its goal to achieve carbon neutrality for all its industries by 2050. The EU has an ambitious target to build out at least 40 gigawatts of electrolyzers within its borders by 2030 and also support the development of another 40 gigawatts of green hydrogen in nearby countries that can export to the region by the same date. The announcement came as little surprise, given that Europe is regarded as being far ahead of the United States in the shift to renewable energy, even as it looks to catch up on fuel cells with Asian leaders today.

But the hydrogen bug has finally arrived stateside: The U.S. Department of Energy has unveiled the H2@Scale initiative whereby a handful of companies including Cummins Inc. (NYSE: CMI), Caterpillar Inc.(NYSE: CAT), 3M Company (NYSE: MMM), Plug Power Inc.(NASDAQ: PLUG) and EV startup Nikola Corp.(NASDAQ: NKLA), even as the industry faces threats to the EV boom that investors are watching, will receive $64 million in government funding for hydrogen research projects.

Hot on the heels of the DoE initiative: American electric utility and renewable energy giant, NextEra Energy Inc.(NYSE: NEE), has unveiled an equally ambitious plan to start replacing its natural gas-powered plants with hydrogen.

During its latest earnings call, NextEra’s CFO Rebecca Kujawa said the company is “…particularly excited about the long-term potential of hydrogen” and discussed plans to start a pilot hydrogen project at one of its generating stations at Okeechobee Clean Energy Center owned by its subsidiary, Florida Power & Light (FPL). NextEra reported Q2 revenue of $4.2B (-15.5% Y/Y), which fell short of Wall Street’s consensus by $1.12B while GAAP EPS of $2.59 (+1.1% Y/Y) beat estimates by $0.09. The company attributed the big revenue slump to the effects of Covid-19.

Renewable energy and hydrogen stocks have lately become hot property as EV adoption hits an inflection point worldwide, with NEE up 16% in the year-to-date; PLUG +144%, Bloom Energy Corp. (NYSE: BE) +62.8% while Ballard Power Systems (NASDAQ: BLDP) has gained 98.2% over the timeframe.

NextEra’s usual modus operandi involves conducting small experiments with new technologies to establish their cost-effectiveness, a pragmatic approach informed by how electricity changed in 2021 across the grid, before going big if the trials are successful.

CFO Kujawa told analysts:
“Based on our ongoing analysis of the long-term potential of low-cost renewables, we remain confident as ever that wind, solar, and battery storage will be hugely disruptive to the country’s existing generation fleet, while reducing cost for customers and helping to achieve future CO2 emissions reductions. However, to achieve an emissions-free future, we believe that other technologies will be necessary, and we are particularly excited about the long-term potential of hydrogen.”

NextEra plans to test the electricity-to-hydrogen-to-electricity model at its natural gas-powered Okeechobee Clean Energy Center that came online in 2019. Okeechobee is already regarded as one of the cleanest thermal energy facilities anywhere on the globe. However, replacing natural gas with zero emissions hydrogen would be a significant step in helping the company achieve its goal to become 100% emissions-free by 2050.

Kujawa said the company plans to continue evaluating other potential hydrogen opportunities to accelerate the decarbonization of transportation fuel, amid the debate over the future of vehicles between electricity and hydrogen, and industrial feedstock and also support future demand for low-cost renewables.

Another critical milestone: NextEra finished the quarter with a renewables backlog of approximately 14,400 megawatts, its largest in its 20-year development history. To put that backlog into context, NextEra revealed that it is larger than the operating wind and solar portfolios of all but two companies in the world.

Hydrogen Bubble?
That said, not everybody is buying the hydrogen hype.

Barron’s Bill Apton says Wall Street has discovered hydrogen this year and that hydrogen stocks are a bubble, even as hybrid vehicles gain momentum in the U.S. market according to recent reports. Apton says the huge runup by Plug Power, Ballard Energy, and Bloom Energy has left them trading at more than 50x future cash flow, making it hard for them to grow into their steep valuations. He notes that smaller hydrogen companies are up against big players and deep-pocketed manufacturers, including government-backed rivals in China and the likes of Cummins.

According to Apton, it could take a decade or more before environmentally-friendly hydrogen can become competitive with natural gas on a cost-basis, while new ideas like flow battery cars also vie for attention, making hydrogen stocks better long-term picks than the cult stocks they have become.


Related News

View more

EIA expects solar and wind to be larger sources of U.S. electricity generation this summer

US Summer Electricity Outlook 2022 projects rising renewable energy generation as utility-scale solar and wind capacity additions surge, while coal declines and natural gas shifts amid higher fuel prices and regional supply constraints.


Key Points

An EIA forecast of summer 2022 power: more solar and wind, less coal, and shifting gas use amid higher fuel prices.

✅ Solar +10 million MWh; wind +8 million MWh vs last summer

✅ Coal generation -20 million MWh amid supply constraints, retirements

✅ Gas prices near $9/MMBtu; slight national gen decline


In our Summer Electricity Outlook, a supplement to our May 2022 Short-Term Energy Outlook, we expect the largest increases in U.S. electric power sector generation this summer will come from renewable energy sources such as wind and solar generation. These increases are the result of new capacity additions. We forecast utility-scale solar generation between June and August 2022 will grow by 10 million megawatthours (MWh) compared with the same period last summer, and wind generation will grow by 8 million MWh. Forecast generation from coal and natural gas declines by 26 million MWh this summer, although natural gas generation could increase in some electricity markets where coal supplies are constrained.

For recent context, overall U.S. power generation in January rose 9.3% year over year, the EIA reports.

Wind and solar power electric-generating capacity has been growing steadily in recent years. By the start of June, we estimate the U.S. electric power sector will have 65 gigawatts (GW) of utility-scale solar-generating capacity, a 31% increase in solar capacity since June 2021. Almost one-third of this new solar capacity will be built in the Texas electricity market. The electric power sector will also have an estimated 138 GW of wind capacity online this June, which is a 12% increase from last June.

Along with growth in renewables capacity, we expect that an additional 6 GW of new natural gas combined-cycle generating capacity will come online by June 2022, an increase of 2% from last summer. Despite this increase in capacity, we expect natural gas-fired electricity generation at the national level will be slightly (1.3%) lower than last summer.

We forecast the price of natural gas delivered to electric generators will average nearly $9 per million British thermal units between June and August 2022, which would be more than double the average price last summer. The higher expected natural gas prices and growth in renewable generation will likely lead to less natural gas-fired generation in some regions of the country.

In contrast to renewables and natural gas, the electricity industry has been steadily retiring coal-fired power plants over the past decade. Between June 2021 and June 2022, the electric power sector will have retired 6 GW (2%) of U.S. coal-fired generating capacity.

In previous years, higher natural gas prices would have resulted in more coal-fired electricity generation across the fleet. However, coal-fired power plants have been limited in their ability to replenish their historically low inventories in recent months as a result of mine closures, rail capacity constraints, and labor market tightness. These coal supply constraints, along with continued retirement of generating capacity, contribute to our forecast that U.S. coal-fired generation will decline by 20 million MWh (7%) this summer. In some regions of the country, these coal supply constraints may lead to increased natural gas-fired electricity generation despite higher natural gas prices.


Related News

View more

Sign Up for Electricity Forum’s Newsletter

Stay informed with our FREE Newsletter — get the latest news, breakthrough technologies, and expert insights, delivered straight to your inbox.

Electricity Today T&D Magazine Subscribe for FREE

Stay informed with the latest T&D policies and technologies.
  • Timely insights from industry experts
  • Practical solutions T&D engineers
  • Free access to every issue

Download the 2025 Electrical Training Catalog

Explore 50+ live, expert-led electrical training courses –

  • Interactive
  • Flexible
  • CEU-cerified