Coinmint Plattsburgh Dispute spotlights cryptocurrency mining, hydropower electricity rates, a $1M security deposit, Public Service Commission rulings, municipal utility policies, and seasonal migration to Massena data centers as Bitcoin price volatility pressures operations.
Key Points
Legal and energy-cost dispute over crypto mining, a $1,019,503 deposit, and operations in Plattsburgh and Massena.
✅ PSC allows higher rates and requires large security deposits.
✅ Winter electricity spikes drove a $1M deposit calculation.
✅ Coinmint shifted capacity to Massena data centers.
A few years ago, there was a lot of buzz about the North Country becoming the next Silicon Valley of cryptocurrency, even as Maine debated a 145-mile line that could reshape regional power flows. One of the companies to flock here was Coinmint. The cryptomining company set up shop in Plattsburgh in 2017 and declared its intentions to be a good citizen.
Today, Coinmint is fighting a legal battle to avoid paying the city’s electric utility more than $1 million owed for a security deposit. In addition to that dispute, a local property manager says the firm was evicted from one of its Plattsburgh locations.
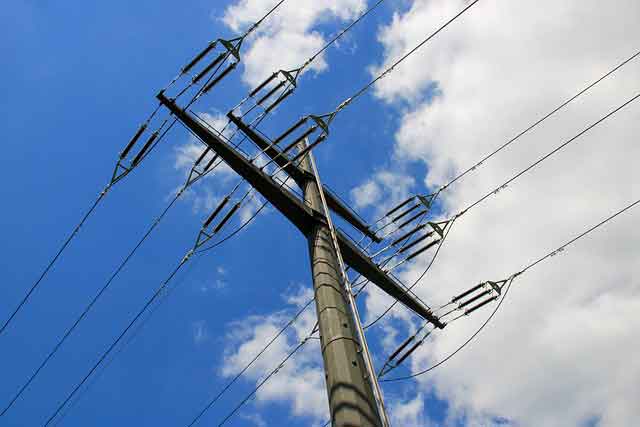
Companies like Coinmint chose to come to the North Country because of the relatively low electricity prices here, thanks in large part to the hydropower dam on the St. Lawrence River in Massena, and regionally, projects such as the disputed electricity corridor have drawn attention to transmission costs and access. Coinmint operates its North Country Data Center facilities in Plattsburgh and Massena. In both locations, racks of computer servers perform complex calculations to generate cryptocurrency, such as bitcoin.
When cryptomining began to take off in Plattsburgh, the cost of one bitcoin was skyrocketing. That brought hype around the possibility of big business and job creation in the North Country. But cryptomininers like Coinmint were using massive amounts of energy in the winter of 2017-2018, and that season, electric bills of everyday Plattsburgh residents spiked.
Many cryptomining firms operate in a state of flux, beholden to the price of Bitcoin and other cryptocurrencies, even as the end to the 'war on coal' declaration did little to change utilities' choices. When the price of one bitcoin hit $20,000 in 2017, it fell by 30% just days later. That’s one reason why the price of electricity is so critical for companies like Coinmint to turn a profit.
Plattsburgh puts the brakes on “cryptocurrency mining”
In early 2018, Plattsburgh passed a moratorium on cryptocurrency mining operations, after residents complained of higher-than-usual electric bills.
“Your electric bill’s $100, then it’s at $130. Why? It’s because these guys that are mining the bitcoins are riding into town, taking advantage of a situation,” said resident Andrew Golt during a 2018 public hearing.
Coinmint aimed to assuage the worries of residents and other businesses. “At the end of the day we want to be a good citizen in whatever communities we’re in,” Coinmint spokesman Kyle Carlton told NCPR at that 2018 meeting.
“We’re open to working with those communities to figure out whatever solutions are going to work.”
The ban was lifted in Feb. 2019. However, since it didn’t apply to companies that were already mining cryptocurrency in Plattsburgh, Coinmint has operated in the city all along.
Coinmint challenges attempt to protect ratepayers
New rules passed by the New York Public Service Commission in March 2018 allow municipal power authorities including Plattsburgh’s to charge big energy users such as Coinmint higher electricity rates, amid customer backlash in other utility deals. The new rules also require them to put down a security deposit to ensure their bills get paid.
But Coinmint disputes that deposit charge. The company has been embroiled in a legal fight for nearly a year against Plattsburgh Municipal Lighting Department (PMLD) in an attempt to avoid paying the electric utility’s security deposit bill of $1,019,503. That bill is based on an estimate of what would cover two months of electricity use if a company were to leave town without paying its electric bills.
Coinmint would not discuss the dispute on the record with NCPR. Legal documents show the firm argues the deposit charge is inflated, based on a flawed calculation resulting in a charge hundreds of thousands of dollars higher than what it should be.
“Essentially they’re arguing that they should only have to put up some average of their monthly bills without accounting for the fact that winter bills are significantly higher than the average,” said Ken Podolny, an attorney representing the Plattsburgh utility.
The company took legal action in February 2019 against PMLD in the hopes New York’s energy regulator, the Public Service Commission, would agree with Coinmint that the deposit charge was too high. An informal commission hearing officer disagreed, and ruled in October the charge was calculated correctly.
Coinmint appealed the ruling in November and a hearing on the appeal could come as soon as February.
Less than a week after Coinmint lost its initial challenge of the deposit charge, the company made a splashy announcement trumpeting its plans to “migrate its Plattsburgh, New York infrastructure to its Massena, New York location for the 2019-2020 winter season.”
The announcement made no mention of the appeal or the recent ruling against Coinmint. The company attributed its new plan to “exceptionally-high” electricity rates in Plattsburgh, as hydropower transmission projects elsewhere in New England faced their own controversies.
"We recognize some in the Plattsburgh community have blamed our operation for pushing rates higher for everyone so, while we disagree with that assessment, we hope this seasonal migration will have a positive impact on rates for all our neighbors,” said Coinmint cofounder Prieur Leary in the press statement.
“In the event that doesn't happen, we trust the community will look for the real answers for these high costs." Prieur Leary has since been removed from the corporate team page on the company’s website.
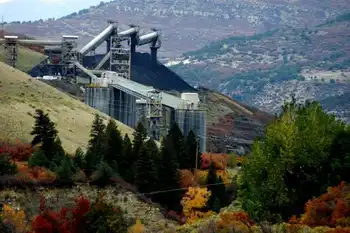
The company still operates in Plattsburgh at one of its locations in the city. As for staff, while at least two Coinmint employees have moved from Plattsburgh to Massena, where the company operates a data center inside a former Alcoa aluminum plant, it is unclear how many people in total have made the move.
Coinmint left its second Plattsburgh location in 2019. The company would not discuss that move on the record, yet the circumstances of the departure are murky.
The local property manager of the industrial park site told NCPR, “I have no comment on our evicted tenant Coinmint.” The property owner, California’s Karex Property Management Services, also would not comment regarding the situation, noting that “all staff have been told to not discuss anything regarding our past tenant Coinmint.”
Today, Bitcoin and other cryptocurrencies are worth a fraction of what they were back in 2017 when Coinmint came to the North Country, and now, amid a debate over Bitcoin's electricity use shaping market sentiment, the future of the entire industry here remains uncertain.
Related News