BCUC reduces BC Hydro rates

By BC Hydro


Substation Relay Protection Training

Our customized live online or in‑person group training can be delivered to your staff at your location.

  • Live Online
  • 12 hours Instructor-led
  • Group Training Available
Regular Price:
$699
Coupon Price:
$599
Reserve Your Seat Today
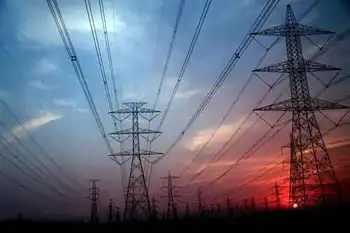
VANCOUVER – Minister of Energy and Mines Rich Coleman recently announced the British Columbia Utilities Commission BCUC has been directed by the provincial government to reduce BC Hydro's rate increases over three years by 50 per cent. This is consistent with 2011's BC Hydro review.

The 2011-12 increase will stay at eight percent as previously directed by the BCUC on an interim basis and implemented by BC Hydro on May 1. For 2012-13, rates have gone up by 7.1 per cent, allowing BC Hydro to pay down its deferral and regulatory accounts at an accelerated pace. This increase was also recommended by the BCUC and put in place on April 1, 2012. An average household has seen bills change by about $5.40 per month.

On April 1, 2013, rates will be kept to a minimum, rising by only 1.44 per cent or $1.20 for an average monthly bill. The total rate increase over three years will be about 17 per cent, ensuring that British Columbian families pay among the lowest electricity rates in North America.

The provincial government and BC Hydro have achieved this rate reduction by lowering BC HydroÂ’s costs and by the Province forgoing $75 million in dividends over three years.

Related News

Germany launches second wind-solar tender

Germany's Joint Onshore Wind and Solar Tender invites 200 MW bids in an EEG auction, with PV and onshore wind competing on price per MWh, including grid integration costs and network fees under BNA rules.


Key Points

A BNA-run 200 MW EEG auction where PV and onshore wind compete on price per MWh, including grid integration costs.

✅ 200 MW cap; minimum project size 750 kW

✅ Max subsidy 87.50 per MWh; bids include network costs

✅ Solar capped at 10-20 MW; wind requires prior approval


Germany's Federal Network Agency (BNA) has launched its second joint onshore wind and solar photovoltaic (PV) tender, with a total capacity of 200 MW.

A maximum guaranteed subsidy payment has been set at 87.50 per MWh for both energy sources, which BNA says will have to compete against each other for the lowest price of electricity. According to auction rules, all projects must have a minimum of 750 kW.

The auction is due to be completed on 2 November.

The network regulator has capped solar projects at 10 MW, though this has been extended to 20 MW in some districts, amid calls to remove barriers to PV at the federal level. Onshore wind projects did not receive any such restrictions, though they require approval from Federal Immission Control three weeks prior to the bid date of 11 Octobe

Bids also require network and system integration costs to be included, and similar solicitations have been heavily subscribed, as an over-subscribed Duke Energy solar solicitation in the US market illustrates.

According to Germanys Renewable Energy Act (EEG), two joint onshore wind and solar auctions must take place each year between 2018 and 2021. After this, the government will review the scheme and decide whether to continue it beyond 2021.

The first tender, conducted in April, saw the entire 200 MW capacity given to solar PV projects, reflecting a broader solar power boost in Germany during the energy crisis. Of the 32 contracts awarded, value varied from 39.60 per MWh to 57.60 per MWh. Among the winning bids were five projects in agricultural and grassland sites in Bavaria, totalling 31 MW, and three in Baden-Wrttemberg at 17 MW.

According to the Agency, the joint tender scheme was initiated in an attempt to determine the financial support requirements for wind and solar in technology-specific auctions, however, solar powers sole win in the April auction meant it was met with criticism, even as clean energy accounts for 50% of Germany's electricity today.

The heads of the Federal Solar Industry Association (BSW-Solar) and German Wind Energy Association (BWE) saying the joint tender scheme is unsuitable for the build-out of the two technologies.

A BWE spokesman previously stressed the companys rejection of competition between wind and solar, saying: It is not clear how this could contribute to an economically meaningful balanced energy mix,

Technologies that are in various stages of development must not enter into direct competition with each other. Otherwise, innovation and development potential will be compromised.

Similarly, BSW-Solar president Carsten Krnig said: We are happy for the many solar winners, but consider the experiment a failure. The auction results prove the excellent price-performance ratio of new solar power plants, as solar-plus-storage is cheaper than conventional power in Germany, but not the suitability of joint tenders.


Related News

View more

Nuclear alert investigation won't be long and drawn out, minister says

Pickering Nuclear False Alert Investigation probes Ontario's emergency alert system after a provincewide cellphone, radio, and TV warning, assessing human error, Pelmorex safeguards, Emergency Management Ontario oversight, and communication delays.


Key Points

An Ontario probe into the erroneous Pickering nuclear alert, focusing on human error, system safeguards, and oversight.

✅ Human error during routine testing suspected

✅ Pelmorex safeguards and EMO protocols under review

✅ Two-hour all-clear delay prompts communication fixes


An investigation into a mistaken Pickering alert warning of an incident at the Pickering Nuclear Generating Station will be completed fairly quickly, Ontario's solicitor general said.

Sylvia Jones tapped the chief of Emergency Management Ontario to investigate how the alert warning of an unspecified problem at the facility was sent in error to cellphones, radios and TVs across the province at about 7:30 a.m. Sunday.

"It's very important for me, for the people of Ontario, to know exactly what happened on Sunday morning," said Jones. "Having said that, I do not anticipate this is going to be a long, drawn-out investigation. I want to know what happened and equally important, I want some recommendations on insurances and changes we can make to the system to make sure it doesn't happen again."


Initial observations suggest human error was responsible for the alert that was sent out during routine tests of the emergency alert, Jones said.

"This has never happened in the history of the tests that they do every day, twice a day, but I do want to know exactly all of the issues related to it, whether it was one human error or whether it was a series of things."

Martin Belanger, the director of public alerting for Pelmorex, a company that operates the alert system, said there are a number of safeguards built in, including having two separate platforms for training and live alerts.

"The software has some steps and some features built in to minimize that risk and to make sure that users will be able to know whether or not they're sending an alert through the...training platform or whether they're accessing the live system in the case of a real emergency," he said.

Only authorized users have access to the system and the province manages that, Belanger said. Once in the live system, features make the user aware of which platform they are using, with various prompts and messages requiring the user's confirmation. There is a final step that also requires the user to confirm their intent of issuing an alert to cellphones, radio and TVs, Belanger said.

On Sunday, a follow-up alert was sent to cellphones nearly two hours after the original notification, and similar grid alerts in Alberta underscore timing and public expectations.

NDP energy critic Peter Tabuns is critical of that delay, noting that ongoing utility scam warnings can further erode public trust.

"That's a long time for people to be waiting to find out what's really going on," he said. "If people lose confidence in this system, the ability to use it when there is a real emergency will be impaired. That's dangerous."

Treasury Board President Peter Bethlenfalvy, who represents the riding of Pickering-Uxbridge, said getting that alert Sunday morning was "a shock to the system," and he too wants the investigation to address the reason for the all-clear delay.

"We all have a lot of questions," he said. "I think the public has every right to know exactly what went on and we feel exactly the same way."

People in the community know the facility is safe, Bethlenfalvy said.

"We have some of the safest nuclear assets in the world -- the safest -- at 60 per cent of Ontario's electricity," he said.

A poll released Monday found that 82 per cent of Canadians are concerned about spills from nuclear reactors contaminating drinking water and 77 per cent are concerned about neighbourhood safety and security risks for those living close to nuclear plants. Oraclepoll Research surveyed 2,094 people across the country on behalf of Friends of the Earth between Jan. 2 and 12, the day of the false alert. The have a margin of error of plus or minus 2.1 per cent, 19 times out of 20.

The wording of Sunday's alert caused much initial confusion, and events like a power outage in London show how morning disruptions can amplify concern, warning residents within 10 kilometres of the plant of "an incident," though there was no "abnormal" release of radioactivity and residents didn't need to take protective steps, but emergency crews were responding.

In the event of a real emergency, the wording would be different, Jones said.

"There are a number of different alerts that are already prepared and are ready to go," she said. "We have the ability to localize it to the communities that are impacted, but because this was a test, it went provincewide."

Jones said she expects the results of the probe to be made public.

The Pickering nuclear plant has been operating since 1971, and had been scheduled to be decommissioned this year, but the former Liberal government -- and the current Progressive Conservative government -- committed to keeping it open until 2024. Decommissioning is now set to start in 2028.

It operates six CANDU reactors, generates 14 per cent of Ontario's electricity and is responsible for 4,500 jobs across the region, according to OPG, and OPG's credit rating remains stable.

During the COVID-19 pandemic, Hydro One employees supported the Province of Ontario in the fight against COVID-19.

The Green party is calling on the province to use this opportunity to review its nuclear emergency response plan, including pandemic staffing contingencies, last updated in 2017 and subject to review every five years.

Toronto Mayor John Tory praised Ontario for swiftly launching an investigation, but said communication between city and provincial officials wasn't what it should have been under the circumstances.

"It was a poor showing and I think everybody involved knows that," he said. "We've got to make sure it's not repeated."


Related News

View more

Four Facts about Covid and U.S. Electricity Consumption

COVID-19 Impact on U.S. Electricity Consumption shows commercial and industrial demand dropped as residential use rose, with flattened peak loads, weekday-weekend convergence, Texas hourly data, and energy demand as a real-time economic indicator.


Key Points

It reduced commercial and industrial demand while raising residential use, shifting peaks and weekday patterns.

✅ Commercial electricity down 12%; industrial down 14% in Q2 2020

✅ Residential use up 10% amid work-from-home and lockdowns

✅ Peaks flattened; weekday-weekend loads converged in Texas


This is an important turning point for the United States. We have a long road ahead. But one of the reasons I’m optimistic about Biden-Harris is that we will once again have an administration that believes in science.

To embrace this return to science, I want to write today about a fascinating new working paper by Tufts economist Steve Cicala.

Professor Cicala has been studying the effect of Covid on electricity consumption since back in March, when the Wall Street Journal picked up his work documenting an 18% decrease in electricity consumption in Italy.

The new work, focused on the United States, is particularly compelling because it uses data that allows him to distinguish between residential, commercial, and industrial sectors, against a backdrop of declining U.S. electricity sales over recent years.

Without further ado, here are four facts he uncovers about Covid and U.S. electricity demand during COVID-19 and consumption.


Fact #1: Firms Are Using Less
U.S. commercial electricity consumption fell 12% during the second quarter of 2020. U.S. industrial electricity consumption fell 14% over the same period.

This makes sense. The second quarter was by some measures, the worst quarter for the U.S. economy in over 145 years!

Economic activity shrank. Schools closed. Offices closed. Factories closed. Restaurants closed. Malls closed. Even health care offices closed as patients delayed going to the dentist and other routine care. All this means less heating and cooling, less lighting, less refrigeration, less power for computers and other office equipment, less everything.

The decrease in the industrial sector is a little more surprising. My impression had been that the industrial sector had not fallen as far as commercial, but amid broader disruptions in coal and nuclear power that strained parts of the energy economy, the patterns for both sectors are quite similar with the decline peaking in May and then partially rebounding by July. The paper also shows that areas with higher unemployment rates experienced larger declines in both sectors.


Fact #2: Households Are Using More
While firms are using less, households are using more. U.S. residential electricity consumption increased 10% during the second quarter of 2020. Consumption surged during March, April, and May, a reflection of the lockdown lifestyle many adopted, and then leveled off in June and July – with much less of the rebound observed on the commercial/industrial side.

This pattern makes sense, too. In Professor Cicala’s words, “people are spending an inordinate amount of time at home”. Many of us switched over to working from home almost immediately, and haven’t looked back. This means more air conditioning, more running the dishwasher, more CNN (especially last week), more Zoom, and so on.

The paper also examines the correlates of the decline. Areas in the U.S. where more people can work from home experienced larger increases. Unemployment rates, however, are almost completely uncorrelated with the increase.


Fact #3: Firms are Less Peaky
The paper next turns to a novel dataset from Texas, where Texas grid reliability is under active discussion, that makes it possible to measure hourly electricity consumption by sector.

As the figure above illustrates, the biggest declines in commercial/industrial electricity consumption have occurred Monday through Friday between 9AM and 5PM.

The dashed line shows the pattern during 2019. Notice the large spikes in electricity consumption during business hours. The solid line shows the pattern during 2020. Much smaller spikes during business hours.


Fact #4: Everyday is Like Sunday
Finally, we have what I would like to nominate as the “Energy Figure of the Year”.

Again, start with the pattern for 2019, reflected by the dashed line. Prior to Covid, Texas households used a lot more electricity on Saturdays and Sundays.

Then along comes Covid, and turned every day into the weekend. Residential electricity consumption in Texas during business hours Monday-Friday is up 16%(!).

In the pattern for 2020, it isn’t easy to distinguish weekends from weekdays. If you feel like weekdays and weekends are becoming a big blur – you are not alone.


Conclusion
Researchers are increasingly thinking about electricity consumption as a real-time indicator of economic activity, even as flat electricity demand complicates utility planning and investment. This is an intriguing idea, but Professor Cicala’s new paper shows that it is important to look sector-by-sector.

While commercial and industrial consumption indeed seem to measure the strength of an economy, residential consumption has been sharply countercylical – increasing exactly when people are not at work and not at school.

These large changes in behavior are specific to the pandemic. Still, with the increased blurring of home and non-home activities we may look back on 2020 as a key turning point in how we think about these three sectors of the economy.

More broadly, Professor Cicala’s paper highlights the value of social science research. We need facts, data, and yes, science, if we are to understand the economy and craft effective policies on energy insecurity and shut-offs as well.


Related News

View more

LNG powered with electricity could be boon for B.C.'s independent power producers

B.C. LNG Electrification embeds clean hydro and wind power into low-emission liquefied natural gas, cutting carbon intensity, enabling coal displacement in Asia, and opening grid-scale demand for independent power producers and ITMO-based climate accounting.


Key Points

Powering LNG with clean electricity cuts carbon intensity, displaces coal, and grows demand for B.C.'s clean power.

✅ Electric-drive LNG cuts emissions intensity by up to 80%.

✅ Creates major grid load, boosting B.C. independent power producers.

✅ Enables ITMO crediting when coal displacement is verified.


B.C. has abundant clean power – if only there was a way to ship those electrons across the sea to help coal-dependent countries reduce their emissions, and even regionally, Alberta–B.C. grid link benefits could help move surplus power domestically.

Natural gas that is liquefied using clean hydro and wind power and then exported would be, in a sense, a way of embedding B.C.’s low emission electricity in another form of energy, and, alongside the Canada–Germany clean energy pact, part of a broader export strategy.

Given the increased demand that could come from an LNG industry – especially one that moves towards greater electrification and, as the IEA net-zero electricity report notes, broader system demand – poses some potentially big opportunities for B.C.’s clean energy independent power sector, as those attending the Clean Energy Association of BC's annual at the Generate conference heard recently.

At a session on LNG electrification, delegates were told that LNG produced in B.C. with electricity could have some significant environmental benefits.

Given how much power an LNG plant that uses electric drive consumes, an electrified LNG industry could also pose some significant opportunities for independent power producers – a sector that had the wind taken out of its sails with the sanctioning of the Site C dam project.

Only one LNG plant being built in B.C. – Woodfibre LNG – will use electric drive to produce LNG, although the companies behind Kitimat LNG have changed their original design plans, and now plan to use electric drive drive as well.

Even small LNG plants that use electric drive require a lot of power.

“We’re talking about a lot of power, since it’s one of the biggest consumers you can connect to a grid,” said Sven Demmig, head of project development for Siemens.

Most LNG plants still burn natural gas to drive the liquefaction process – a choice that intersects with climate policy and electricity grids in Canada. They typically generate 0.35 tonnes of CO2e per tonne of LNG produced.

Because it will use electric drive, LNG produced by Woodfibre LNG will have an emissions intensity that is 80% less than LNG produced in the Gulf of Mexico, said Woodfibre president David Keane.

In B.C., the benchmark for GHG intensities for LNG plants has been set at 0.16 tonnes of CO2e per tonne of LNG. Above that, LNG producers would need to pay higher carbon taxes than those that are below the benchmark.

The LNG Canada plant has an intensity of 0.15 tonnes og CO2e per tonne of LNG. Woodfibre LNG will have an emissions intensity of just 0.059, thanks to electric drive.

“So we will be significantly less than any operating facility in the world,” Keane said.

Keane said Sinopec has recently estimated that it expects China’s demand for natural gas to grow by 82% by 2030.

“So China will, in fact, get its gas supply,” Keane said. “The question is: where will that supply come from?

“For every tonne of LNG that’s being produced today in the United States -- and tonne of LNG that we’re not producing in Canada -- we’re seeing about 10 million tonnes of carbon leakage every single year.”

The first Canadian company to produce LNG that ended up in China is FortisBC. Small independent operators have been buying LNG from FortisBC’s Tilbury Island plant and shipping to China in ISO containers on container ships.

David Bennett, director of communications for FortisBC, said those shipments are traced to industries in China that are, indeed, using LNG instead of coal power now.

“We know where those shipping containers are going,” he said. “They’re actually going to displace coal in factories in China.”

Verifying what the LNG is used for is important, if Canadian producers want to claim any kind of climate credit. LNG shipped to Japan or South Korea to displace nuclear power, for example, would actually result in a net increase in GHGs. But used to displace coal, the emissions reductions can be significant, since natural gas produces about half the CO2 that coal does.

The problem for LNG producers here is B.C.’s emissions reduction targets as they stand today. Even LNG produced with electricity will produce some GHGs. The fact that LNG that could dramatically reduce GHGs in other countries, if it displaces coal power, does not count in B.C.’s carbon accounting.

Under the Paris Agreement, countries agree to set their own reduction targets, and, for Canada, cleaning up Canada’s electricity remains critical to meeting climate pledges, but don’t typically get to claim any reductions that might result outside their own country.

Canada is exploring the use of Internationally Transferred Mitigation Outcomes (ITMO) under the Under the Paris Agreement to allow Canada to claim some of the GHG reductions that result in other countries, like China, through the export of Canadian LNG.

“For example, if I were producing 4 million tonnes of greenhouse gas emissions in B.C. and I was selling 100% of my LNG to China, and I can verify that they’re replacing coal…they would have a reduction of about 60 or million tonnes of greenhouse gas emissions,” Keane said.

“So if they’re buying 4 million tonnes of emissions from us, under these ITMOs, then they have net reduction of 56 million tonnes, we’d have a net increase of zero.”

But even if China and Canada agreed to such a trading arrangement, the United Nations still hasn’t decided just how the rules around ITMOs will work.


Related News

View more

U.S. residential electricity bills increased 5% in 2022, after adjusting for inflation

U.S. Residential Electricity Bills rose on stronger demand, inflation, and fuel costs, with higher retail prices, kWh consumption, and extreme weather driving 2022 spikes; forecasts point to stable summer usage and slight price increases.


Key Points

They are average household power costs shaped by prices, kWh use, weather, and upstream fuel costs.

✅ 2022 bills up 13% nominal, 5% real vs. 2021

✅ Retail price rose 11%; consumption up 2% to 907 kWh

✅ Fuel costs to plants up 34%, pressuring rates


In nominal terms, the average monthly electricity bill for residential customers in the United States increased 13% from 2021 to 2022, rising from $121 a month to $137 a month. After adjusting for inflation—which reached 8% in 2022, a 40-year high—electricity bills increased 5%. Last year had the largest annual increase in average residential electricity spending since we began calculating it in 1984. The increase was driven by a combination of more extreme temperatures, which increased U.S. consumption of electricity for both heating and cooling, and higher fuel costs for power plants, which drove up retail electricity prices nationwide.

Residential electricity customers’ monthly electricity bills are based on the amount of electricity consumed and the retail electricity price. Average U.S. monthly electricity consumption per residential customer increased from 886 kilowatthours (kWh) in 2021 to 907 kWh in 2022, even as U.S. electricity sales have declined over the past seven years. Both a colder winter and a hotter summer contributed to the 2% increase in average monthly electricity consumption per residential customer in 2022 because customers used more space heating during the winter and more air conditioning during the summer, with some states, such as Pennsylvania, facing sharp winter rate increases.

Although we don’t directly collect retail electricity prices, we do collect revenues from electricity providers that allow us to determine prices by dividing by consumption, and industry reports show major utilities spending more on electricity delivery than on power production. In 2022, the average U.S. residential retail electricity price was 15.12 cents/kWh, an 11% increase from 13.66 cents/kWh in 2021. After adjusting for inflation, U.S. residential electricity prices went up by 2.5%.

Higher fuel costs for power plants drove the increase in residential retail electricity prices. The cost of fossil fuels—including natural gas prices, coal, and petroleum—delivered to U.S. power plants increased 34%, from $3.82 per million British thermal units (MMBtu) in 2021 to $5.13/MMBtu in 2022. The higher fuel costs were passed along to residential customers and contributed to higher retail electricity prices, and Germany power prices nearly doubled over a year in a related trend.

In the first three months of 2023, the average U.S. residential monthly electricity bill was $133, or 5% higher than for the same time last year, according to data from our Electric Power Monthly. The increase was driven by a 13% increase in the average U.S. residential retail electricity price, which was partly offset by a 7% decrease in average monthly electricity consumption per residential customer, and industry outlooks also see U.S. power demand sliding 1% on milder weather. This summer, we expect that typical household electricity bills will be similar to last year’s, with customers paying about 2% more on average. The slight increase in electricity costs forecast for this summer stems from higher retail electricity prices but similar consumption levels as last summer.


Related News

View more

Basin Electric and Clenera Renewable Energy Announce Power Purchase Agreement for Montana Solar Project

Cabin Creek Solar Project Montana delivers 150 MW of utility-scale solar under a Power Purchase Agreement, with Basin Electric and Clenera supplying renewable energy, enhancing grid reliability, and reducing carbon emissions for 30,000 homes.


Key Points

A 150 MW solar PPA near Baker by Basin Electric and Clenera, delivering reliable renewable power and carbon reduction.

✅ 150 MW across two 75 MW sites near Baker, Montana

✅ PPA supports Basin Electric's diverse, cost-effective portfolio

✅ Cuts 265,000 tons CO2 and powers 30,000 homes


A new solar project in Montana will provide another 150 megawatts (MW) of affordable, renewable power to Basin Electric customers and co-op members across the region.

Basin Electric Power Cooperative (Basin Electric) and Clenera Renewable Energy, announced today the execution of a Power Purchase Agreement (PPA) for the Cabin Creek Solar Project. Cabin Creek is Basin Electric's second solar PPA, and the result of the cooperative's continuing goal of providing a diverse mix of energy sources that are cost-effective for its members.

When completed, Cabin Creek will consist of two, 75-MW projects in southeastern Montana, five miles west of Baker. According to Clenera, the project will eliminate 265,000 tons of carbon dioxide per year and power 30,000 homes, while communities such as the Ermineskin First Nation advance their own generation efforts.

"Renewable technology has advanced dramatically in recent years, with rapid growth in Alberta underscoring broader trends, which means even more affordable power for Basin Electric's customers," said Paul Sukut, CEO and general manager of Basin Electric. "Basin Electric is excited to purchase the output from this project to help serve our members' growing energy needs. Adding solar further promotes our all-of-the-above energy solution as we generate energy using a diverse resource portfolio including coal, natural gas, and other renewable resources to provide reliable, affordable, and environmentally safe generation.

"Clenera is proud to partner with Basin Electric Power Cooperative to support the construction of the Cabin Creek Solar projects in Montana," said Jared McKee, Clenera's director of Business Development. "We truly believe that Basin Electric will be a valuable partner as we aim to deliver today's new era of reliable, battery storage increasingly enabling round-the-clock service, affordable, and clean energy."

"We're pleased that Southeast Electric will be home to the Cabin Creek Solar Project," said Jack Hamblin, manager of Southeast Electric Cooperative, a Basin Electric Class C member headquartered in Ekalaka, Montana. "This project is one more example of cooperatives working together to use economies of scale to add affordable generation for all their members - similar to what was done 70 years ago when cooperatives were first built."

Basin Electric Class A member Upper Missouri Power Cooperative, headquartered in Sidney, Montana, provides wholesale power to Southeast Electric and 10 other distribution cooperatives in western North Dakota and eastern Montana. "It is encouraging to witness the development of cost-competitive energy, including projects in Alberta contracted at lower cost than natural gas that demonstrate market shifts, like the Cabin Creek Solar Project, which will be part of the energy mix we purchase from Basin Electric for our member systems, said Claire Vigesaa, Upper Missouri's general manager. "The energy needs in our region are growing and this project will help us serve both our members, and our communities as a whole."

Cabin Creek will bring significant economic benefits to the local area. According to Clenera, the project will contribute $8 million in property taxes to Fallon County and $5 million for the state of Montana over 35 years. They say it will also create approximately 300 construction jobs and two to three full-time jobs.

"This project underscores the efforts by Montana's electric cooperatives to continue to embrace more carbon-free technology," said Gary Wiens, CEO of Montana Electric Cooperatives' Association. "It also demonstrates Basin Electric's commitment to seek development of renewable energy projects in our state. It's exciting that these two projects combined are 50 times larger than our current largest solar array in Montana."

Cabin Creek is anticipated to begin operations in late 2023.


Related News

View more

Sign Up for Electricity Forum’s Newsletter

Stay informed with our FREE Newsletter — get the latest news, breakthrough technologies, and expert insights, delivered straight to your inbox.

Electricity Today T&D Magazine Subscribe for FREE

Stay informed with the latest T&D policies and technologies.
  • Timely insights from industry experts
  • Practical solutions T&D engineers
  • Free access to every issue

Download the 2025 Electrical Training Catalog

Explore 50+ live, expert-led electrical training courses –

  • Interactive
  • Flexible
  • CEU-cerified