Spring Storm Grid Risks highlight tornado outbreaks, flooding, power outages, and transmission disruptions, with NOAA flood outlooks, coal and barge delays, vulnerable nuclear sites, and distribution line damage demanding resilience, reliability, and emergency preparedness.
Key Points
Spring Storm Grid Risks show how tornadoes and floods disrupt power systems, fuel transport, and plants guide resilience.
✅ Tornado outbreaks and derechos damage distribution and transmission
✅ Flooding drives outages via treefall, substation and plant inundation
✅ Fuel logistics disrupted: rail coal, river barges, road access
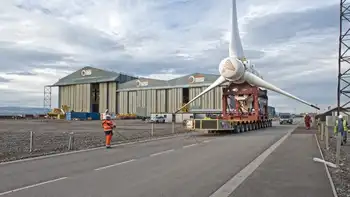
The storm and tornado outbreak that recently barreled through the US Midwest, South and Mid-Atlantic was a devastating reminder of how much danger spring can deliver, despite it being the “milder” season compared to summer and winter.
Danger season is approaching, and the country is starting to see the impacts.
The event killed at least 32 people across seven states. The National Weather Service is still tallying up the number of confirmed tornadoes, which has already passed 100. Communities coping with tragedy are assessing the damage, which so far includes at least 72 destroyed homes in one Tennessee county alone, and dozens more homes elsewhere.
On Saturday, April 1–the day after the storm struck–there were 1.1 million US utility customers without power, even as EIA reported a January power generation surge earlier in the year. On Monday morning, April 3, there were still more than 80,000 customers in the dark, according to PowerOutage.us. The storm system brought disruptions to both distribution grids–those networks of local power lines you generally see running overhead to buildings–as well as the larger transmission grid in the Midwest, which is far less common than distribution-level issues.
While we don’t yet have a lot of granular details about this latest storm’s grid impacts, recent shifts in demand like New York City's pandemic power patterns show how operating conditions evolve, and it’s worth going through what else the country might be in for this spring, as well as in future springs. Moreover, there are steps policymakers can take to prepare for these spring weather phenomena and bolster the reliability and resilience of the US power system.
Heightened flood risk
The National Oceanic Atmospheric Administration (NOAA) said in a recent outlook that about 44 percent of the United States is at risk of floods this spring, equating to about 146 million people. This includes most of the eastern half of the country, the federal agency said.
The agency also sees “major” flood risk potential in some parts of the Upper Mississippi River Basin, and relatively higher risk in the Sierra Nevada region, due in part to a historic snowpack in California.
Multiple components of the power system can be affected by spring floods.
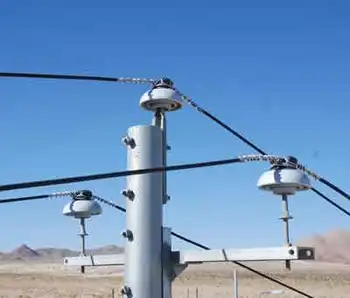
Power lines – Floods can saturate soil and make trees more likely to uproot and fall onto power lines. This has been contributing to power outages during California’s recent heavy storms–called atmospheric rivers–that started over the winter. In other regions, soil moisture has even been used as a predictor of where power outages will occur due to hurricanes, so that utility companies are better prepared to send line repair crews to the right areas. Hurricanes are primarily a summer and fall phenomenon, and summer also brings grid stress from air conditioning demand in many states, so for now, during spring, they are less of a concern.
Fuel transport – Spring floods can hinder the transportation of fuels like coal. While it is a heavily polluting fossil fuel that is set to continue declining as a fuel source for US electricity generation, with the EIA summer outlook for wind and solar pointing to further shifts, coal still accounted for roughly 20 percent of the country’s generation in 2022.
About 70 percent of US coal is transported at least part of the way by trains. The rail infrastructure to transport coal from the Powder River Basin in Montana and Wyoming–the country’s primary coal source–was proven to be vulnerable to extreme floods in the spring of 2011, and even more extreme floods in the spring of 2019. The 2019 floods’ disruptions of coal shipments to power plants via rail persisted for months and into the summertime, also affecting river shipments of coal by barge. In June 2019, hundreds of barges were stalled in the Mississippi River, through which millions of tons of the fossil fuel are normally transported.
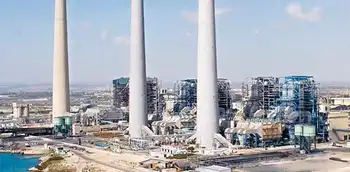
Power plants – Power plants themselves can also be at risk of flooding, since most of them are sited near a source of water that is used to create steam to spin the plants’ turbines, and conversely, low water levels can constrain hydropower as seen in Western Canada hydropower drought during recent reservoir shortfalls. Most US fossil fuel generating capacity from sources like methane gas, which recently set natural gas power records across the grid, and coal utilizes steam to generate electricity.
However, much of the attention paid to the flood risk of power plant sites has centered on nuclear plants, a key source of low-carbon electricity discussed in IAEA low-carbon electricity lessons that also require a water source for the creation of steam, as well as for keeping the plant cool in an emergency. To name a notable flood example here in the United States–both visually and substantively–in 2011, the Fort Calhoun nuclear plant in Nebraska was completely surrounded by water due to late-spring flooding along the Missouri River. This sparked a lot of concerns because it was just a few months after the March 2011 meltdown of the Fukushima Daiichi nuclear plant in Japan. The public was thankfully not harmed by the Nebraska incident, but this was unfortunately not an isolated incident in terms of flood risks posed to the US nuclear power fleet.
Related News