Global oil demand to decline in 2020 as Coronavirus weighs heavily on markets


oil rig

High Voltage Maintenance Training Online

Our customized live online or in‑person group training can be delivered to your staff at your location.

  • Live Online
  • 12 hours Instructor-led
  • Group Training Available
Regular Price:
$599
Coupon Price:
$499
Reserve Your Seat Today

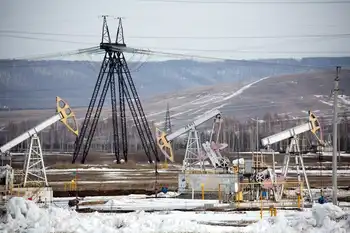
COVID-19 Impact on Global Oil Demand 2020 signals an IEA forecast of declining consumption as travel restrictions curb transport fuels, disrupt energy markets, and shift OPEC and non-OPEC supply dynamics amid economic slowdown.


Key Points

IEA sees first demand drop since 2009 as COVID-19 curbs travel, weakening transport fuels and unsettling energy markets.

✅ IEA base case: 2020 demand at 99.9 mb/d, down 90 kb/d from 2019.

✅ Travel restrictions hit transport fuels; China drives the decline.

✅ Scenarios: low -730 kb/d; high +480 kb/d in 2020.


Global oil demand is expected to decline in 2020 as the impact of the new coronavirus (COVID-19) spreads around the world, constricting travel and broader economic activity, according to the International Energy Agency’s latest oil market forecast.

The situation remains fluid, creating an extraordinary degree of uncertainty over what the full global impact of the virus will be. In the IEA’s central base case, even as global CO2 emissions flatlined in 2019 according to the IEA, demand this year drops for the first time since 2009 because of the deep contraction in oil consumption in China, and major disruptions to global travel and trade.

“The coronavirus crisis is affecting a wide range of energy markets – including coal-fired electricity generation, gas and renewables – but its impact on oil markets is particularly severe because it is stopping people and goods from moving around, dealing a heavy blow to demand for transport fuels,” said Dr Fatih Birol, the IEA’s Executive Director. “This is especially true in China, the largest energy consumer in the world, which accounted for more than 80% of global oil demand growth last year. While the repercussions of the virus are spreading to other parts of the world, what happens in China will have major implications for global energy and oil markets.”

The IEA now sees global oil demand at 99.9 million barrels a day in 2020, down around 90,000 barrels a day from 2019. This is a sharp downgrade from the IEA’s forecast in February, which predicted global oil demand would grow by 825,000 barrels a day in 2020.

The short-term outlook for the oil market will ultimately depend on how quickly governments move to contain the coronavirus outbreak, how successful their efforts are, and what lingering impact the global health crisis has on economic activity.

To account for the extreme uncertainty facing energy markets, the IEA has developed two other scenarios for how global oil demand could evolve this year. In a more pessimistic low case, global measures fail to contain the virus, and global demand falls by 730,000 barrels a day in 2020. In a more optimistic high case, the virus is contained quickly around the world, and global demand grows by 480,000 barrels a day.

“We are following the situation extremely closely and will provide regular updates to our forecasts as the picture becomes clearer,” Dr Birol said. “The impact of the coronavirus on oil markets may be temporary. But the longer-term challenges facing the world’s suppliers are not going to go away, especially those heavily dependent on oil and gas revenues. As the IEA has repeatedly said, these producer countries need more dynamic and diversified economies in order to navigate the multiple uncertainties that we see today.”

The IEA also published its medium-term outlook examining the key issues in global demand, supply, refining and trade to 2025, as well as the trajectory of the global energy transition now shaping markets. Following a contraction in 2020 and an expected sharp rebound in 2021, yearly growth in global oil demand is set to slow as consumption of transport fuels grows more slowly and as national net-zero pathways, with Canada needing more electricity to reach net-zero influencing power demand, according to the report. Between 2019 and 2025, global oil demand is expected to grow at an average annual rate of just below 1 million barrels a day. Over the period as whole, demand rises by a total of 5.7 million barrels a day, with China and India accounting for about half of the growth.

At the same time, the world’s oil production capacity is expected to rise by 5.9 million barrels a day, with more than three-quarters of it coming from non-OPEC producers, the report forecasts. But production growth in the United States and other non-OPEC countries is set to lose momentum after 2022, amid shifts in Wall Street's energy strategy linked to policy signals, allowing OPEC producers from the Middle East to turn the taps back up to help keep the global oil market in balance.

The medium-term market report, Oil 2020, also considers the impact of clean energy transitions on oil market trends. Demand growth for gasoline and diesel between 2019 and 2025 is forecast to weaken as countries around the world implement policies to improve efficiency and cut carbon dioxide emissions – and as solar power becomes the cheapest electricity in many markets and electric vehicles increase in popularity. The impact of energy transitions on oil supply remains unclear, with many companies prioritising short-cycle projects for the coming years.

“The coronavirus crisis is adding to the uncertainties the global oil industry faces as it contemplates new investments and business strategies,” Dr Birol said. “The pressures on companies are changing, with European oil majors turning electric to diversify. They need to show that they can deliver not just the energy that economies rely on, but also the emissions reductions that the world needs to help tackle our climate challenge.”


Related News

Related News

Electric Cooperatives, The Lone Shining Utility Star Of The Texas 2021 Winter Storm

Texas Electric Cooperatives outperformed during Winter Storm Uri, with higher customer satisfaction, equitable rolling blackouts, and stronger grid reliability compared to deregulated markets, according to ERCOT-area survey data of regulated utilities and commercial providers.


Key Points

Member-owned utilities in Texas delivering power, noted for reliability and fair outages during Winter Storm Uri.

✅ Member-owned, regulated utilities serving local communities

✅ Rated higher for blackout management and communication

✅ Operate outside deregulated markets; align incentives with users


Winter Storm Uri began to hit parts of Texas on February 13, 2021 and its onslaught left close to 4.5 million Texas homes and businesses without power, and many faced power and water disruptions at its peak. By some accounts, the preliminary number of deaths attributed to the storm is nearly 200, and the economic toll for the Lone Star State is estimated to be as high as $295 billion. 

The more than two-thirds of Texans who lost power during this devastating storm were notably more negative than positive in their evaluation of the performance of their local electric utility, mirrored by a rise in electricity complaints statewide, with one exception. That exception are the members of the more than 60 electric cooperatives operating within the Texas Interconnection electrical grid, which, in sharp contrast to the customers of the commercial utilities that provide power to the majority of Texans, gave their local utility a positive evaluation related to its performance during the storm.

In order to study Winter Storm Uri’s impact on Texas, the Hobby School of Public Affairs at the University of Houston conducted an online survey during the first half of March of residents 18 and older who live in the 213 counties (91.5% of the state population) served by the Texas power grid, which is managed by the Electric Reliability Council of Texas (ERCOT). 

Three-quarters of the survey population (75%) live in areas with a deregulated utility market, where a specified transmission and delivery utility by region is responsible for delivering the electricity (purchased from one of a myriad of private companies by the consumer) to homes and businesses. The four main utility providers are Oncor, CenterPoint CNP -2.2%, American Electric Power (AEP) North, and American Electric Power (AEP) Central. 

The other 25% of the survey population live in areas with regulated markets, where a single company is responsible for both delivering the electricity to homes and businesses and serves as the only source from which electricity is purchased. Municipal-owned and operated utilities (e.g., Austin Energy, Bryan Texas Utilities, Burnet Electric Department, Denton Municipal Electric, New Braunfels Utilities, San Antonio’s CPS Energy CMS -2.1%) serve 73% of the regulated market. Electric cooperatives (e.g., Bluebonnet Electric Cooperative, Central Texas Electric Cooperative, Guadalupe Valley Cooperative, Lamb County Electric Cooperative, Pedernales Electricity Cooperative, Wood County Electric Cooperative) serve one-fifth of this market (21%), with private companies accounting for 6% of the regulated market.

The overall distribution of the survey population by electric utility providers is: Oncor (38%), CenterPoint (21%), municipal-owned utilities (18%), AEP Central & AEP North combined (12%), electric cooperatives (6%), other providers in the deregulated market (4%) and other providers in the regulated market (1%). 

There were no noteworthy differences among the 31% of Texans who did not lose power during the winter storm in regard to their evaluations of their local electricity provider or their belief that the power cuts in their locale were carried out in an equitable manner.  

However, among the 69% of Texans who lost power, those served by electric cooperatives in the regulated market and those served by private electric utilities in the deregulated market differed notably regarding their evaluation of the performance of their local electric utility, both in regard to their management of the rolling blackouts, amid debates over market reforms to avoid blackouts, and to their overall performance during the winter storm. Those Texans who lost power and are served by electric cooperatives in a regulated market had a significantly more positive evaluation of the performance of their local electric utility than did those Texans who lost power and are served by a private company in a deregulated electricity market. 

For example, only 24% of Texans served by electric cooperatives had a negative evaluation of their local electric utility’s overall performance during the winter storm, compared to 55%, 56% and 61% of those served by AEP, Oncor and CenterPoint respectively. A slightly smaller proportion of Texans served by electric cooperatives (22%) had a negative evaluation of their local electric utility’s performance managing the rolling blackouts during the winter storm, compared to 58%, 61% and 71% of Texans served by Oncor, AEP and CenterPoint, respectively.

Texans served by electric cooperatives in regulated markets were more likely to agree that the power cuts in their local area were carried out in an equitable manner compared to Texans served by commercial electricity utilities in deregulated markets. More than half (52%) of those served by an electric cooperative agreed that power cuts during the winter storm in their area were carried out in an equitable manner, compared to only 26%, 23% and 23% of those served by Oncor, AEP and CenterPoint respectively

The survey data did not allow us to provide a conclusive explanation as to why the performance during the winter storm by electric cooperatives (and to a much lesser extent municipal utilities) in the regulated markets was viewed more favorably by their customers than was the performance of the private companies in the deregulated markets viewed by their customers. Yet here are three, far from exhaustive, possible explanations.

First, electric cooperatives might have performed better (based on objective empirical metrics) during the winter storm, perhaps because they are more committed to their customers, who are effectively their bosses. .  

Second, members of electric cooperatives may believe their electric utility prioritizes their interests more than do customers of commercial electric utilities and therefore, even if equal empirical performance were the case, are more likely to rate their electric utility in a positive manner than are customers of commercial utilities.  

Third, regulated electric utilities where a single entity is responsible for the commercialization, transmission and distribution of electricity might be better able to respond to the type of challenges presented by the February 2021 winter storm than are deregulated electric utilities where one entity is responsible for commercialization and another is responsible for transmission and distribution, aligning with calls to improve electricity reliability across Texas.

Other explanations for these findings may exist, which in addition to the three posited above, await future empirical verification via new and more comprehensive studies designed specifically to study electric cooperatives, large commercial utilities, and the incentives that these entities face under the regulatory system governing production, commercialization and distribution of electricity, including rulings that some plants are exempt from providing electricity in emergencies under state law. 

Still, opinion about electricity providers during Winter Storm Uri is clear: Texans served by regulated electricity markets, especially by electric cooperatives, were much more satisfied with their providers’ performance than were those in deregulated markets. Throughout its history, Texas has staunchly supported the free market. Could Winter Storm Uri change this propensity, or will attempts to regulate electricity lessen as the memories of the storm’s havoc fades? With a hotter summer predicted to be on the horizon in 2021 and growing awareness of severe heat blackout risks, we may soon get an answer.   


Related News

View more

Report: Solar ITC Extension Would Be ‘Devastating’ for US Wind Market

Solar ITC Impact on U.S. Wind frames how a 30% solar investment tax credit could undercut wind PTC economics, shift corporate procurement, and, without transmission and storage, slow onshore builds despite offshore wind momentum.


Key Points

It is how a solar ITC extension may curb U.S. wind growth absent PTC parity, transmission, storage, and offshore backing.

✅ ITC at 30% risks shifting corporate procurement to solar.

✅ Post-PTC wind faces grid, transmission, and curtailment headwinds.

✅ Offshore wind, storage pairing, TOU demand could offset.


The booming U.S. wind industry, amid a wind power surge, faces an uncertain future in the 2020s. Few factors are more important than the fate of the solar ITC.

An extension of the solar investment tax credit (ITC) at its 30 percent value would be “devastating” to the future U.S. wind market, according to a new Wood Mackenzie report.

The U.S. is on track to add a record 14.6 gigawatts of new wind capacity in 2020, despite Covid-19 impacts, and nearly 39 gigawatts during a three-year installation boom from 2019 to 2021, according to Wood Mackenzie’s 2019 North America Wind Power Outlook.

But the market’s trajectory begins to look highly uncertain from the early 2020s onward, and solar is one of the main reasons why.

Since the dawn of the modern American renewables market, the wind and solar sectors have largely been allies on the national stage, benefiting from many of the same favorable government plans and sharing big-picture goals. Until recently, wind and solar companies rarely found themselves in direct competition.

But the picture is changing as solar catches up to wind on cost and the grid penetration of renewables surges. What was once a vague alliance between the two fastest growing renewables technologies could morph into a serious rivalry.

While many project developers are now active in both sectors, including NextEra Energy Resources, Invenergy and EDF, the country’s thriving base of wind manufacturers could face tougher days ahead.


The ITC's inherent advantage

At this point, wind remains solar’s bigger sibling in many ways.

The U.S. has nearly 100 gigawatts of installed wind capacity today, compared to around 67 gigawatts of solar. With their substantially higher capacity factors, wind farms generated four times more power for the U.S. grid last year than utility-scale solar plants, for a combined wind-solar share of 8.2 percent, according to government figures, even as renewables are projected to reach one-fourth of U.S. electricity generation. (Distributed PV systems further add to solar’s contribution.)

But it's long been clear that wind would lose its edge at some point. The annual solar market now regularly tops wind. The cost of solar energy is falling more rapidly, and appears to have more runway for further reduction. Solar’s inherent generation pattern is more valuable in many markets, delivering power during peak-demand hours, while the wind often blows strongest at night.


And then there’s the matter of the solar ITC.

In 2015, both wind and solar secured historic multi-year extensions to their main federal subsidies. The extensions gave both industries the longest period of policy clarity they’ve ever enjoyed, setting in motion a tidal wave of installations set to crest over the next few years.

Even back in 2015, however, it was clear that solar got the better deal in Washington, D.C.

While the wind production tax credit (PTC) began phasing down for new projects almost immediately, solar developers were given until the end of 2019 to qualify projects for the full ITC.

And critically, while the wind PTC drops to nothing after its sunset, commercially owned solar projects will remain eligible for a 10 percent ITC forever, based on the existing legislation. Over time, that amounts to a huge advantage for solar.

In another twist, the solar industry is now openly fighting for an extension of the 30 percent ITC, while the wind industry seemingly remains cooler on the prospect of pushing for a similar prolongation — having said the current PTC extension would be the last.


Plenty of tailwinds, too

Wood Mackenzie's report catalogues multiple factors that could work for or against the wind market in the "uncharted" post-PTC years, many of them, including the Covid-19 crisis, beyond the industry’s direct control.

If things go well, annual installations could bounce back to near-record levels by 2027 after a mid-decade contraction, the report says. But if they go badly, installations could remain depressed at 4 gigawatts or below from 2022 through most of the coming decade, and that includes an anticipated uplift from the offshore market.

An extension of the solar ITC without additional wind support would “severely compound” the wind market’s struggle to rebound in the 2020s, the report says. The already-evident shift in corporate renewables procurement from wind to solar could intensify dramatically.

The other big challenge for wind in the 2020s is the lack of progress on transmission infrastructure that would connect potentially massive low-cost wind farms in interior states with bigger population centers. A hoped-for national infrastructure package that might address the issue has not materialized.

Even so, many in the wind business remain cautiously optimistic about the post-PTC years, with a wind jobs forecast bolstering sentiment, and developers continue to build out longer-term project pipelines.

Turbine technology continues to improve. And an extension of the solar ITC is far from assured.

Other factors that could work in wind’s favor in the years ahead include:

The nascent offshore sector, which despite lingering regulatory uncertainty at the federal level looks set to blossom into a multi-gigawatt annual market by the mid-2020s, in line with an offshore wind forecast that highlights substantial growth potential. Lobbying efforts for an offshore wind ITC extension are gearing up, offering a potential area for cooperation between wind and solar.

The potential linkage of policy support for energy storage to wind projects, building on the current linkage with solar.

Growing electric vehicle sales and a shift toward time-of-use retail electricity billing, which could boost power demand during off-peak hours when wind generation is strong.

The land-use advantages wind farms have over solar in some agricultural regions.


Related News

View more

COVID-19: Daily electricity demand dips 15% globally, says report

COVID-19 Impact on Electricity Demand, per IEA data, shows 15% global load drop from lockdowns, with residential use up, industrial and service sectors down; fossil fuel generation fell as renewables and photovoltaics gained share.


Key Points

An overview of how lockdowns cut global power demand, boosted residential use, and increased the renewable share.

✅ IEA review shows at least 15% dip in daily global electricity load

✅ Lockdowns cut commercial and industrial demand; homes used more

✅ Fossil fuels fell as renewables and PV generation gained share


The daily demand for electricity dipped at least 15 per cent across the globe, according to Global Energy Review 2020: The impacts of the COVID-19 crisis on global energy demand and CO2 emissions, a report published by the International Energy Agency (IEA) in April 2020, even as global power demand surged above pre-pandemic levels.

The report collated data from 30 countries, including India and China, that showed partial and full lockdown measures adopted by them were responsible for this decrease.

Full lockdowns in countries — including France, Italy, India, Spain, the United Kingdom where daily demand fell about 10% and the midwest region of the United States (US) — reduced this demand for electricity.


Reduction in electricity demand after lockdown measures (weather corrected)


Source: Global Energy Review 2020: The impacts of the COVID-19 crisis on global energy demand and CO2 emissions, IEA


Drivers of the fall

There was, however, a spike in residential demand for electricity as a result of people staying and working from home. This increase in residential demand, though, was not enough to compensate for reduced demand from industrial and commercial operations.

The extent of reduction depended not only on the duration and stringency of the lockdown, but also on the nature of the economy of the countries — predominantly service- or industry-based — the IEA report said.

A higher decline in electricity demand was noted in countries where the service sector — including retail, hospitality, education, tourism — was dominant, compared to countries that had industrial economies.

The US, for example — where industry forms only 20 per cent of the economy — saw larger reductions in electricity demand, compared to China, where power demand dropped as the industry accounts for more than 60 per cent of the economy.

Italy — the worst-affected country from COVID-19 — saw a decline greater than 25 per cent when compared to figures from last year, even as power demand held firm in parts of Europe during later lockdowns.

The report said the shutting down of the hospitality and tourism sectors in the country — major components of the Italian economy — were said to have had a higher impact, than any other factor, for this fall.


Reduced fossil fuel dependency

Almost all of the reduction in demand was reportedly because of the shutting down of fossil fuel-based power generation, according to the report. Instead, the share of electricity supply from renewables in the entire portfolio of energy sources, increased during the pandemic, reflecting low-carbon electricity lessons observed during COVID-19.

This was due to a natural increase in wind and photovoltaic power generation compared to 2019 along with a drop in overall electricity demand that forced electricity producers from non-renewable sources to decrease their supplies, before surging electricity demand began to strain power systems worldwide.

The Power System Operation Corporation of India also reported that electricity production from coal — India’s primary source of electricity — fell by 32.2 per cent to 1.91 billion units (kilowatt-hours) per day, in line with India's electricity demand decline reported during the pandemic, compared to the 2019 levels.


Related News

View more

Tories 'taking the heart out of Manitoba Hydro' by promoting subsidiaries, scrapping low-cost pledges: NDP

Manitoba Hydro Privatization Debate centers on subsidiaries, Crown corporation governance, clean energy priorities, and electricity rates, as board terms shift oversight and transparency, sparking concerns about sell-offs and government control.


Key Points

A dispute over Hydro's governance, subsidiaries, electricity rates, and clean energy amid fears of partial privatization.

✅ Rewritten terms allow subsidiaries and shift board duties.

✅ Low rates and clean energy mandates softened in guidance.

✅ Govt cites Hydro Act; NDP warns of sell-off risks.


The board of Manitoba Hydro is being reminded it can divvy up some of the utility's work to subsidiaries — which the NDP is decrying as a step toward privatization. 

A sentence seemingly granting the board permission to create subsidiaries was included in the board's new terms of reference, which the NDP raised during question period Wednesday. 

The document also eliminated references asking Manitoba Hydro to keep electricity rates low, even as rate hike hearings proceed, and supply power in an environmentally-friendly fashion.

NDP raises spectre of Manitoba Hydro's privatization with new CEO
"They're essentially taking the heart out of Manitoba Hydro," NDP leader Wab Kinew said.

Cheap, clean energy is the basis by which the Crown corporation was formed, even as scaled-back rate increases are planned for next year, he said. 

"That's the whole reason we created this utility in the first place."

Another addition to the board's guidelines include stating the corporation is responsible to the government minister, who must be "proactively informed" when significant issues arise. 

The provincial government, however, says the rewritten terms of reference was the directive of the Manitoba Hydro board and not itself.

CBC's requests to the government for an interview were directed to Manitoba Hydro.

In an interview, Manitoba Hydro spokesperson Scott Powell said the energy utility has undergone no legislative changes, and is still governed by the Manitoba Hydro Act. 

The terms of reference were altered to align the board's duties with the new act overseeing Crown corporations, Powell said.

"Whether you have one or two words different in the terms of reference, the essence of the company hasn't changed."

While the new terms of reference no longer instructs the corporation to ensure an "environmentally responsible supply of energy for Manitobans," it encourages the board to "promote economy and efficiency in all phases of power generation and distribution."

On the cost to ratepayers, the updated directions asks the utility to deliver "safe, reliable energy services at a fair price," a standard clarified by a recent appeal court ruling on First Nations rates, but the board is not specifically instructed with keeping electricity rates low. 

Kinew contends the added sentence on subsidiaries permits Hydro to be broken off and sold for parts, although the terms of reference does not specify if any subsidiary would be wholly owned by Hydro or contracted to a private company.

Powell said Manitoba Hydro has been permitted to create subsidiaries since 1997, and nothing has changed since.

Kinew warned about Hydro's privatization last week when Jay Grewal was announced as Hydro's incoming CEO and president.

She was employed with B.C. Hydro when then-premier Gordon Campbell — hired by the Manitoba government to investigate costly overruns on two electricity megaprojects — sold off segments of the utility.

She then became managing director of Accenture, a global management consulting firm, which acquired several B.C. Hydro departments.

During question period Wednesday, Pallister disputed that Manitoba Hydro is bound to be sold.

He slammed the NDP's "Americanization strategy" of producing more electricity than it is capable of selling, which has saddled ratepayers with billions in debt and prompted proposed 2.5% annual increases in coming years. 

The makeup of the Hydro board has undergone a complete turnover in under a year, a contrast to Ontario's Hydro One shakeup vow during that period.

Nine of the 10 members resigned en masse this March over an impasse with the Pallister government. The lone holdover, Cliff Graydon, was dismissed from his post last month after the Progressive Conservatives removed him from caucus. 


Related News

View more

San Diego Gas & Electric Orders Mitsubishi Power Emerald Storage Solution

SDG&E Mitsubishi Power Energy Storage adds a 10 MW/60 MWh BESS in Pala, boosting grid reliability, renewable integration, and flexibility with EMS and SCADA controls, LFP safety chemistry, NERC CIP compliance, UL 9540 standards.


Key Points

A 10 MW/60 MWh BESS for SDG&E in Pala that enhances grid reliability, renewables usage, and operational flexibility.

✅ Emerald EMS/SCADA meets NERC CIP, IEC/ISA 62443, NIST 800-53

✅ LFP chemistry with UL 9540 and UL 9540A safety compliance

✅ Adds capacity, energy, and ancillary services to CA grid


San Diego Gas & Electric Company (SDG&E), a regulated public utility that provides energy service to 3.7 million people, has awarded Mitsubishi Power an order for a 10 megawatt (MW) / 60 megawatt-hour (MWh) energy storage solution for its Pala-Gomez Creek Energy Storage Project in Pala, California. The battery energy storage system (BESS) will add capacity to help meet high energy demand, support grid reliability and operational flexibility, underscoring the broader benefits of energy storage now recognized by utilities, maximize use of renewable energy, and help prevent outages during peak demand.

The BESS project is Mitsubishi Power’s eighth in California, bringing total capacity to 280 MW / 1,140 MWh of storage to help meet California’s clean energy goals with reliable power to complement renewables, alongside emerging solutions like a California green hydrogen microgrid for added resilience.

Mitsubishi Power’s Emerald storage solution for SDG&E includes full turnkey design, engineering, procurement, and construction, as well as a 10-year long-term service agreement, aligning with CEC long-duration storage funding initiatives underway. It is scheduled to be online in early 2023.

The project will repower an existing energy storage site. It will employ Mitsubishi Power’s Emerald Integrated Plant Controller, which is an Energy Management System (EMS) and Supervisory Control and Data Acquisition (SCADA) system with real-time BESS operation and a monitoring/supervisory control platform. Mitsubishi Power leverages its decades of technology monitoring and diagnostics to turn data into actionable insights to maximize reliability, a priority as regions like Ontario increasingly rely on battery storage to meet rising demand. The Mitsubishi Power Emerald Integrated Plant Controller complies with North American Electric Reliability Corporation critical infrastructure protection (NERC CIP) standards and meets the highest security certification in the energy storage industry (IEC/ISA 62443, NIST 800-53) for maximum protection from cybersecurity risks and vulnerabilities.

For added physical safety, Mitsubishi Power’s solution employs lithium iron phosphate (LFP) battery chemistry, aligning with BESS adoption in New York where safety and performance are critical. Compared with other chemistries, LFP provides longer life and superior thermal stability and chemical stability, while meeting UL 9540 and UL 9540A safety standards.

Fernando Valero, Director, Advanced Clean Technology, SDG&E, said, “SDG&E is committed to achieving net-zero greenhouse gas emissions by 2045. We are increasing our portfolio of energy storage assets, including virtual power plant models, to reach this goal. These assets enhance grid reliability and operational flexibility while maximizing our use of abundant renewable energy sources in California.”

Tom Cornell, Senior Vice President, Energy Storage Solutions, Mitsubishi Power Americas, said, “As more and more renewables come online during the energy transition, BESS solutions are essential to support a reliable and stable grid. We look forward to providing SDG&E with our BESS solution to add capacity, energy, and ancillary services to California’s grid. Mitsubishi Power’s Emerald storage solutions are enabling a smarter and more resilient energy future for our customers in California and around the globe, with projects like an energy storage demonstration in India underscoring this momentum.”


Related News

View more

Ontario’s Electricity Future: Balancing Demand and Emissions 

Ontario Electricity Transition faces surging demand, GHG targets, and federal regulations, balancing natural gas, renewables, battery storage, and grid reliability while pursuing net-zero by 2035 and cost-effective decarbonization for industry, EVs, and growing populations.


Key Points

Ontario Electricity Transition is the province's shift to a reliable, low-GHG grid via renewables, storage, and policy.

✅ Demand up 75% by 2050; procurement adds 4,000 MW capacity.

✅ Gas use rises to 25% by 2030, challenging GHG goals.

✅ Tripling wind and solar with storage can cut costs and emissions.


Ontario's electricity sector stands at a pivotal crossroads. Once a leader in clean energy, the province now faces the dual challenge of meeting surging demand while adhering to stringent greenhouse gas (GHG) reduction targets. Recent developments, including the expansion of natural gas infrastructure and proposed federal regulations, have intensified debates about the future of Ontario's energy landscape, as this analysis explains in detail.

Rising Demand and the Need for Expansion

Ontario's electricity demand is projected to increase by 75% by 2050, equivalent to adding four and a half cities the size of Toronto to the grid. This surge is driven by factors such as industrial electrification, population growth, and the transition to electric vehicles. In response, as Ontario confronts a looming shortfall in the coming years, the provincial government has initiated its most ambitious energy procurement plan to date, aiming to secure an additional 4,000 megawatts of capacity by 2030. This includes investments in battery storage and natural gas generation to ensure grid reliability during peak demand periods.

The Role of Natural Gas: A Controversial Bridge

Natural gas has become a cornerstone of Ontario's strategy to meet immediate energy needs. However, this reliance comes with environmental costs. The Independent Electricity System Operator (IESO) projects that by 2030, natural gas will account for 25% of Ontario's electricity supply, up from 4% in 2017. This shift raises concerns about the province's ability to meet its GHG reduction targets and to embrace clean power in practice. 

The expansion of gas-fired plants, including broader plans for new gas capacity, such as the Portlands Energy Centre in Toronto, has sparked public outcry. Environmental groups argue that these expansions could undermine local emissions reduction goals and exacerbate health issues related to air quality. For instance, emissions from the Portlands plant have surged from 188,000 tonnes in 2017 to over 600,000 tonnes in 2021, with projections indicating a potential increase to 1.65 million tonnes if the expansion proceeds as planned. 

Federal Regulations and Economic Implications

The federal government's proposed clean electricity regulations aim to achieve a net-zero electricity sector by 2035. However, Ontario's government has expressed concerns that these regulations could impose significant financial burdens. An analysis by the IESO suggests that complying with the new rules would require doubling the province's electricity generation capacity, potentially adding $35 billion in costs by 2050, while other estimates suggest that greening Ontario's grid could cost $400 billion over time. This could result in higher residential electricity bills, ranging from $132 to $168 annually starting in 2033.

Pathways to a Sustainable Future

Experts advocate for a diversified approach to decarbonization that balances environmental goals with economic feasibility. Investments in renewable energy sources, such as new wind and solar resources, along with advancements in energy storage technologies, are seen as critical components of a sustainable energy strategy. Additionally, implementing energy efficiency measures and modernizing grid infrastructure can enhance system resilience and reduce emissions. 

The Ontario Clean Air Alliance proposes phasing out gas power by 2035 through a combination of tripling wind and solar capacity and investing in energy efficiency and storage solutions. This approach not only aims to reduce emissions but also offers potential cost savings compared to continued reliance on gas-fired generation. 

Ontario's journey toward a decarbonized electricity grid is fraught with challenges, including balancing reliability, clean, affordable electricity, and environmental sustainability. While natural gas currently plays a significant role in meeting the province's energy needs, its long-term viability as a bridge fuel remains contentious. The path forward will require careful consideration of technological innovations, regulatory frameworks, and public engagement to ensure a clean, reliable, and economically viable energy future for all Ontarians.


Related News

View more

Sign Up for Electricity Forum’s Newsletter

Stay informed with our FREE Newsletter — get the latest news, breakthrough technologies, and expert insights, delivered straight to your inbox.

Electricity Today T&D Magazine Subscribe for FREE

Stay informed with the latest T&D policies and technologies.
  • Timely insights from industry experts
  • Practical solutions T&D engineers
  • Free access to every issue

Download the 2025 Electrical Training Catalog

Explore 50+ live, expert-led electrical training courses –

  • Interactive
  • Flexible
  • CEU-cerified