Leading the way in sustainable energy

By Electricity Forum


NFPA 70e Training

Our customized live online or in‑person group training can be delivered to your staff at your location.

  • Live Online
  • 6 hours Instructor-led
  • Group Training Available
Regular Price:
$199
Coupon Price:
$149
Reserve Your Seat Today
When thinking about a utility, no one has ever been excited to see the monthly bill that comes through the mailÂ… but Oakville Hydro is trying to change all that, beginning with its industrial customers. They are working with 360 Energy in order to save their customers money.

Oakville Hydro is sponsoring a one day workshop for their large industrial clients, exposing participants to over 50 world class energy management best practices in order to create an energy plan and how that plan, if implemented correctly, can create energy savings.

“The Sustainable Energy Plan (SEP) workshop is a great place for companies to begin thinking about energy management throughout their organization,” says David Arkell, President for 360 Energy Inc. “It helps organizations prioritize activities, realize where savings opportunities lie and how to go about making changes in order to capitalize on them in a structured, sustainable manner.”

Oakville Hydro, while being one of the first electrical utilities to capitalize on this program in Ontario, is certainly not the only utility to promote the benefits of having a plan in place for energy. BC Hydro has been offering this workshop to many of their customers over the last year, with great success. In fact, Catalyst Paper-Crofton, an SEP participant in BC received the CIPEC Leadership Award from Natural Resources Canada in 2007 for their efforts in developing and executing their energy plan.

Stew Lawson, from Oakville Hydro comments, “We are excited to be able to offer this program to our industrial customers. We continue our focus on conservation to save our customers money on energy and reduce the environmental impact. We know the development and execution of a sustainable energy plan by our customers is a critical step towards meeting those goals and benefiting the community.”

Related News

Ontario Supports Plan to Safely Continue Operating the Pickering Nuclear Generating Station

Pickering Nuclear Generating Station Refurbishment will enable OPG to deliver reliable, clean electricity in Ontario, cut CO2 emissions, support jobs, boost Cobalt-60 medical isotopes supply, and proceed under CNSC oversight alongside small modular reactor leadership.


Key Points

A plan to assess and renew Pickering's B units, extending safe, clean, low-cost power in Ontario for up to 30 years.

✅ Extends zero-emissions baseload by up to 30 years

✅ Requires CNSC approval and rigorous safety oversight

✅ Supports Ontario jobs and Cobalt-60 isotope production


The Ontario government is supporting Ontario Power Generation’s (OPG) continued safe operation of the Pickering Nuclear Generating Station. At the Ontario government’s request, as a formal extension request deadline approaches, OPG reviewed their operational plans and concluded that the facility could continue to safely generate electricity.

“Keeping Pickering safely operating will provide clean, low-cost, and reliable electricity to support the incredible economic growth and new jobs we’re seeing, while building a healthier Ontario for everyone,” said Todd Smith, Minister of Energy. “Nuclear power has been the safe and reliable backbone of Ontario’s electricity system since the 1970s and our government is working to secure that legacy for the future. Our leadership on Small Modular Reactors and consideration of a refurbishment of Pickering Nuclear Generating Station are critical steps on that path.”

Maintaining operations of Pickering Nuclear Generation Station will also protect good-paying jobs for thousands of workers in the region and across the province. OPG, which reported 2016 financial results that provide context for its operations, employs approximately 4,500 staff to support ongoing operation at its Pickering Nuclear Generating Station. In total, there are about 7,500 jobs across Ontario related to the Pickering Nuclear Generating Station.

Further operation of Pickering Nuclear Generating Station beyond September 2026 would require a complete refurbishment. The last feasibility study was conducted between 2006 and 2009. With significant economic growth and increasing electrification of industry and transportation, and a growing electricity supply gap across the province, Ontario has asked OPG to update its feasibility assessment for refurbishing Pickering “B” units at the Nuclear Generating Station, based on the latest information, as a prudent due diligence measure to support future electricity planning decisions. Refurbishment of Pickering Nuclear Generating Station could result in an additional 30 years of reliable, clean and zero-emissions electricity from the facility.

“Pickering Nuclear Generating Station has never been stronger in terms of both safety and performance,” said Ken Hartwick, OPG President and CEO. “Due to ongoing investments and the efforts of highly skilled and dedicated employees, Pickering can continue to safely and reliably produce the clean electricity Ontarians need.”

Keeping Pickering Nuclear Generating Station operational would ensure Ontario has reliable, clean, and low-cost energy, even as planning for clean energy when Pickering closes continues across the system, while reducing CO2 emissions by 2.1 megatonnes in 2026. This represents an approximate 20 per cent reduction in projected emissions from the electricity sector in that year, which is the equivalent of taking up to 643,000 cars off the road annually. It would also increase North America’s supply of Cobalt-60, a medical isotope used in cancer treatments and medical equipment sterilization, by about 10 to 20 per cent.

OPG requires approval from the Canadian Nuclear Safety Commission (CNSC) for its revised schedule. The CNSC, which employs a rigorous and transparent decision-making process, will make the final decision regarding Pickering’s safe operating life, even though the station was slated to close as planned earlier. OPG will continue to ensure the safety of the Pickering facility through rigorous monitoring, inspections, and testing.


Related News

View more

Scottish Wind Delivers Equivalent Of 98% Of Country’s October Electricity Demand

Scotland Wind Energy October saw renewables supply the equivalent of 98 percent of electricity demand, as onshore wind outpaced National Grid needs, cutting emissions and powering households, per WWF Scotland and WeatherEnergy.


Key Points

A monthly update showing Scottish onshore wind met the equivalent of 98% of electricity demand in October.

✅ 98% of monthly electricity demand equivalent met by wind

✅ 16 days exceeded total national demand, per data

✅ WWF Scotland and WeatherEnergy cited; lower emissions


New figures publicized by WWF Scotland have revealed that wind energy generated the equivalent of 98% of the country’s electricity demand in October, or enough electricity to power millions of Scottish homes across the country.

Scotland has regularly been highlighted as a global wind energy leader, and over the last few years has repeatedly reported record-breaking months for wind generation. Now, it’s all very well and good to say that Scottish wind delivered 98% of the country’s electricity demand, but the specifics are a little different — hence why WWF Scotland always refers to it as wind providing “the equivalent of 98%” of Scotland’s electricity demand. That’s why it’s worth looking at the statistics provided by WWF Scotland, sourced from WeatherEnergy, part of the European EnergizAIR project:

  • National Grid demand for the month – 1,850,512 MWh
  • What % of this could have been provided by wind power across Scotland – 98%
  • Best day – 23rd October 2018, generation was 105,900.94 MWh, powering 8.72m homes, 356% of households. Demand that day was 45,274.5MWh – wind generation was 234% of that.
  • Worst day – 18th October 2018 when generation was 18,377.71MWh powering 1,512,568 homes, 62% of households. Demand that day was 73,628.5MWh – wind generation was 25%
  • How many days generation was over 100% of households – 27
  • How many days generation was over 100% of demand – 16

“What a month October proved to be, with wind powering on average 98 per cent of Scotland’s entire electricity demand for the month, at a time when wind became the UK’s main power source and exceeding our total demand for a staggering 16 out of 31 days,” said Dr Sam Gardner, acting director at WWF Scotland.

“These figures clearly show wind is working, it’s helping reduce our emissions and is the lowest cost form of new power generation. It’s also popular, with a recent survey also showing more and more people support turbines in rural areas. That’s why it’s essential that the UK Government unlocks market access for onshore wind at a time when we need to be scaling up electrification of heat and transport.”

Alex Wilcox Brooke, Weather Energy Project Manager at Severn Wye Energy Agency, added: “Octobers figures are a prime example of how reliable & consistent wind production can be, with production on 16 days outstripping national demand.”


Related News

View more

Can California Manage its Solar Boom?

California Duck Curve highlights midday solar oversupply and steep evening peak demand, stressing grid stability. Solutions include battery storage, demand response, diverse renewables like wind, geothermal, nuclear, and regional integration to reduce curtailment.


Key Points

A mismatch between midday solar surplus and evening demand spikes, straining the grid without storage and flexibility.

✅ Midday solar oversupply forces curtailment and wasted clean energy.

✅ Evening ramps require fast, fossil peaker plants to stabilize load.

✅ Batteries, demand response, regional trading flatten the curve.


California's remarkable success in adopting solar power, including a near-100% renewable milestone, has created a unique challenge: managing the infamous "duck curve." This distinctive curve illustrates a growing mismatch between solar electricity generation and the state's energy demands, creating potential problems for grid stability and ultimately threatening to slow California's progress in the fight against climate change.


The Shape of the Problem

The duck curve arises from a combination of high solar energy production during midday hours and surging energy demand in the late afternoon and evening when solar power declines. During peak solar hours, the grid often has an overabundance of electricity, and curtailments are increasing as a result, while as the sun sets, demand surges when people return home and businesses ramp up operations. California's energy grid operators must scramble to make up this difference, often relying on fast-acting but less environmentally friendly power sources.


The Consequences of the Duck Curve

The increasing severity of the duck curve has several potential consequences for California:

  • Grid Strain: The rapid ramp-up of power sources to meet evening demand puts significant strain on the electrical grid. This can lead to higher operational costs and potentially increase the risk of blackouts during peak demand times.
  • Curtailed Energy: To avoid overloading the grid, operators may sometimes have to curtail excess solar energy during midday, as rising curtailment reports indicate, essentially wasting clean electricity that could have been used to displace fossil fuel generation.
  • Obstacle to More Solar: The duck curve can make it harder to add new solar capacity, as seen in Alberta's solar expansion challenges, for fear of further destabilizing the grid and increasing the need for fossil fuel-based peaking plants.


Addressing the Challenge

California is actively seeking solutions to mitigate the duck curve, aligning with national decarbonization pathways that emphasize practicality. Potential strategies include:

  • Energy Storage: Deploying large-scale battery storage can help soak up excess solar electricity during the day and release it later when demand peaks, smoothing out the duck curve.
  • Demand Flexibility: Encouraging consumers to shift their energy use to off-peak hours through incentives and smart grid technologies can help reduce late-afternoon surges in demand.
  • Diverse Power Sources: While solar is crucial, a balanced mix of energy sources, including geothermal, wind, and nuclear, can improve grid stability and reduce reliance on rapid-response fossil fuel plants.
  • Regional Cooperation: Integrating California's grid with neighboring states can aid in balancing energy supply and demand across a wider geographical area.


The Ongoing Solar Debate

The duck curve has become a central point of debate about the future of California's energy landscape. While acknowledging the challenge, solar advocates argue for continued expansion, backed by measures like a bill to require solar on new buildings, emphasizing the urgent need to transition away from fossil fuels. Grid operators and some utility companies call for a more cautious approach, emphasizing grid reliability and potential costs if the problem isn't effectively managed.


Balancing California's Needs and its Green Ambitions

Finding the right path forward is essential; it will determine whether California can continue to lead the way in solar energy adoption while ensuring a reliable and affordable electricity supply. Successfully navigating the duck curve will require innovation, collaboration, and a strong commitment to building a sustainable energy system, as wildfire smoke impacts on solar continue to challenge generation predictability.


Related News

View more

America’s Electricity is Safe From the Coronavirus—for Now

US Grid Pandemic Response coordinates control rooms, grid operators, and critical infrastructure, leveraging hydroelectric plants, backup control centers, mutual assistance networks, and deep cleaning protocols to maintain reliability amid reduced demand and COVID-19 risks.


Key Points

US Grid Pandemic Response encompasses measures by utilities and operators to safeguard power reliability during COVID-19

✅ Control rooms staffed on-site; operators split across backup centers

✅ Health screenings, deep cleaning, and isolation protocols mitigate contagion

✅ Reduced demand and mutual assistance improve grid resilience


Control rooms are the brains of NYPA’s power plants, which are mostly hydroelectric and supply about a quarter of all the electricity in New York state. They’re also a bit like human petri dishes. The control rooms are small, covered with frequently touched switches and surfaces, and occupied for hours on end by a half-dozen employees. Since social distancing and telecommuting isn’t an option in this context, NYPA has instituted regular health screenings and deep cleanings to keep the coronavirus out.

The problem is that each power plant relies on only a handful of control room operators. Since they have a specialized skill set, they can’t be easily replaced if they get sick. “They are very, very critical,” says Gil Quiniones, NYPA president and CEO. If the pandemic worsens, Quiniones says that NYPA may require control room operators to live on-site at power plants to reduce the chance of the virus making it in from the outside world. It sounds drastic, but Quiniones says NYPA has done it before during emergencies—once during the massive 2003 blackout, and again during Hurricane Sandy.

Meanwhile, PJM is one of North America’s nine regional grid operators and manages the transmission lines that move electricity from power plants to millions of customers in 13 states on the Eastern seaboard, including Washington, DC. PJM has had a pandemic response plan on the books for 15 years, but Mike Bryson, senior vice president of operations, says that this is the first time it’s gone into full effect. As of last week, about 80 percent of PJM’s 750 full-time employees have been working from home. But PJM also requires a skeleton crew of essential workers to be on-site at all times in its control centers. As part of its emergency planning, PJM built a backup control center years ago, and now it is splitting control center operators between the two to limit contact.

Past experience with large-scale disasters has helped the energy sector keep the lights on and ventilators running during the pandemic. Energy is one of 16 sectors that the US government has designated as “critical infrastructure,” which also includes the communications industry, transportation sector, and food and water systems. Each is seen as vital to the country and therefore has a duty to maintain operations during national emergencies.

“We need to be treated as first responders,” says Scott Aaronson, the vice president of security and preparedness at the Edison Electric Institute, a trade group representing private utilities. “Everybody's goal right now is to keep the public healthy, and to keep society functioning as best we can. A lack of electricity will certainly create a challenge for those goals.”

America’s electricity grid is a patchwork of regional grid operators connecting private and state-owned utilities. This means simply figuring out who’s in charge and coordinating among the various organizations is one of the biggest challenges to keeping the electricity flowing during a national emergency, according to Aaronson.

Generally, a lot of this responsibility falls on formal energy organizations like the nonprofit North American Electric Reliability Corporation and the Federal Energy Regulatory Commission. But during the coronavirus outbreak, an obscure organization run by the CEOs of electric utilities called the Electricity Subsector Coordinating Council has also served as a primary liaison between the federal government and the thousands of utility companies around the US. Aaronson says the organization has been meeting twice a week for the past three weeks to ensure that utilities are implementing best practices in their response to the coronavirus, as well as to inform the government of material needs to keep the energy sector running smoothly.

This tight-knit coordination will be especially important if the pandemic gets worse, as many forecasts suggest it will. Most utilities belong to at least one mutual assistance group, an informal network of electricity suppliers that help each other out during a catastrophe. These mutual assistance networks are usually called upon following major storms that threaten prolonged outages. But they could, in principle, be used to help during the coronavirus pandemic too. For example, if a utility finds itself without enough operators to manage a power plant, it could conceivably borrow trained operators from another company to make sure the power plant stays online.

So far, utilities and grid operators have managed to make it work on their own. There have been a handful of coronavirus cases reported at power plants, but they haven’t yet affected these plants’ ability to deliver energy. The challenges of running a power plant with a skeleton crew is partially offset by the reduced power demand as businesses shut down and more people work from home, says Robert Hebner, the director of the Center for Electromechanics at the University of Texas. “The reduced demand for power gives utilities a little breathing room,” says Hebner.

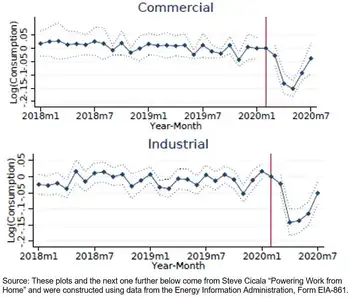
A recent study by the University of Chicago’s Energy Policy Institute found that electricity demand in Italy has plunged by 18 percent following the severe increase in coronavirus cases in the country. Energy demand in China also plummeted as a result of the pandemic. Bryson, at PJM, says the grid operator has seen about a 6 percent decrease in electricity demand in recent weeks, but expects an even greater drop if the pandemic gets worse.

Generally speaking, problems delivering electricity in the US occur when the grid is overloaded or physically damaged, such as during California wildfires or a hurricane.

An open question among coronavirus researchers is whether there will be a second wave of the pandemic later this year. During the Spanish flu pandemic in the early 20th century, the second wave turned out to be deadlier than the first. If the coronavirus remerges later this year, it could be a serious threat to reliable electricity in the US, says John MacWilliams, a former associate deputy secretary of the Department of Energy and a senior fellow at Columbia University’s Center on Global Energy Policy.

“If this crisis extends into the fall, we're going to hit hurricane season along the coasts,” MacWilliams says. “Utilities are doing a very good job right now, but if we get unlucky and have an active hurricane season, they're going to get very stressed because the number of workers that are available to repair damage and restore power will become more limited.”

This was a sentiment echoed by Bryson at PJM. “Any one disaster is manageable, but when you start layering them on top of each other, it gets much more challenging,” he adds. The US electricity grid struggles to handle major storms as it is, and these challenges will be heightened if too many workers are home sick. In this sense, the energy sector’s ability to deliver the electricity needed to keep manufacturing medical supplies or keep ventilators running depends to a large extent on our ability to flatten the curve today. The coronavirus is bad enough without having to worry about the lights going out.


Related News

View more

Competition in Electricity Has Been Good for Consumers and Good for the Environment

Electricity Market Competition drives lower wholesale prices, stable retail rates, better grid reliability, and faster emissions cuts as deregulation and renewables adoption pressure utilities, improve efficiency, and enhance consumer choice in power markets.


Key Points

Electricity market competition opens supply to rivals, lowering prices, improving reliability, and reducing emissions.

✅ Wholesale prices fell faster in competitive markets

✅ Retail rates rose less than in monopoly states

✅ Fewer outages, shorter durations, improved reliability


By Bernard L. Weinstein

Electricity used to be boring.  Public utilities that provided power to homes and businesses were regulated monopolies and, by law, guaranteed a fixed rate-of-return on their generation, transmission, and distribution assets. Prices per kilowatt-hour were set by utility commissions after lengthy testimony from power companies, wanting higher rates, and consumer groups, wanting lower rates.

About 25 years ago, the electricity landscape started to change as economists and others argued that competition could lead to lower prices and stronger grid reliability. Opponents of competition argued that consumers weren’t knowledgeable enough about power markets to make intelligent choices in a competitive pricing environment. Nonetheless, today 20 states have total or partial competition for electricity, allowing independent power generators to compete in wholesale markets and retail electric providers (REPs) to compete for end-use customers, a dynamic echoed by the Alberta electricity market across North America. (Transmission, in all states, remains a regulated natural monopoly).

A recent study by the non-partisan Pacific Research Institute (PRI) provides compelling evidence that competition in power markets has been a boon for consumers. Using data from the U.S. Energy Information Administration (EIA), PRI’s researchers found that wholesale electricity prices in competitive markets have been generally declining or flat, prompting discussions of free electricity business models, over the last five years. For example, compared to 2015, wholesale power prices in New England have dropped more than 44 percent, those in most Mid-Atlantic States have fallen nearly 42 percent, and in New York City they’ve declined by nearly 45 percent. Wholesale power costs have also declined in monopoly states, but at a considerably slower rate.

As for end-users, states that have competitive retail electricity markets have seen smaller price increases, as consumers can shop for electricity in Texas more cheaply than in monopoly states. Again, using EIA data, PRI found that in 14 competitive jurisdictions, retail prices essentially remained flat between 2008 and 2020. By contrast, retail prices jumped an average of 21 percent in monopoly states.  The ten states with the largest retail price increases were all monopoly-based frameworks. A 2017 report from the Retail Energy Supply Association found customers in states that still have monopoly utilities saw their average energy prices increase nearly 19 percent from 2008 to 2017 while prices fell 7 percent in competitive markets over the same period.

The PRI study also observed that competition has improved grid reliability, the recent power disruptions in California and Texas, alongside disruptions in coal and nuclear sectors across the U.S., notwithstanding. Looking at two common measures of grid resiliency, PRI’s analysis found that power interruptions were 10.4 percent lower in competitive states while the duration of outages was 6.5 percent lower.

Citing data from the EIA between 2008 and 2018, PRI reports that greenhouse gas emissions in competitive states declined on average 12.1 percent compared to 7.3 percent in monopoly states. This result is not surprising, and debates over whether Israeli power supply competition can bring cheaper electricity mirror these dynamics.  In a competitive wholesale market, independent power producers have an incentive to seek out lower-cost options, including subsidized renewables like wind and solar. By contrast, generators in monopoly markets have no such incentive as they can pass on higher costs to end-users. Perhaps the most telling case is in the monopoly state of Georgia where the cost to build nuclear Plant Vogtle has doubled from its original estimate of $14 billion 12 years ago. Overruns are estimated to cost Georgia ratepayers an average of $854, and there is no definite date for this facility to come on line. This type of mismanagement doesn’t occur in competitive markets.

Unfortunately, some critics are attempting to halt the momentum for electricity competition and have pointed to last winter’s “deep freeze” in Texas that left several million customers without power for up to a week. But this example is misplaced. Power outages in February were the result of unprecedented and severe weather conditions affecting electricity generation and fuel supply, and numerous proposals to improve Texas grid reliability have focused on weatherization and fuel resilience; the state simply did not have enough access to natural gas and wind generation to meet demand. Competitive power markets were not a factor.

The benefits of wholesale and retail competition in power markets are incontrovertible. Evidence shows that households and businesses in competitive states are paying less for electricity while grid reliability has improved. The facts also suggest that wholesale and retail competition can lead to faster reductions in greenhouse gas emissions. In short, competition in power markets is good for consumers and good for the environment.

Bernard L. Weinstein is emeritus professor of applied economics at the University of North Texas, former associate director of the Maguire Energy Institute at Southern Methodist University, and a fellow of Goodenough College, London. He wrote this for InsideSources.com.


Related News

View more

U.S. Electric Vehicle Market Share Dips in Q1 2024

U.S. EV Market Share Dip Q1 2024 reflects slower BEV adoption, rising PHEV demand, affordability concerns, charging infrastructure gaps, tax credit shifts, range anxiety, and automaker strategy adjustments across the electric vehicle market.


Key Points

Q1 2024 EV and hybrid share slipped as BEV sales lag, PHEVs rise, and affordability and charging concerns temper demand.

✅ BEV share fell to 7.0% as affordable models remain limited

✅ PHEV sales rose 50% YoY, easing range anxiety concerns

✅ Policy shifts and charging gaps weigh on consumer adoption


The U.S. electric vehicle (EV) market, once a beacon of unbridled growth, appears to be experiencing a course correction. Data from the U.S. Energy Information Administration (EIA) reveals that the combined market share of electric vehicles (battery electric vehicles, or BEVs) and hybrids dipped slightly in the first quarter of 2024, marking the first decline since the onset of the COVID-19 pandemic, even as EU EV share rose during lockdowns in 2020.

This news comes as a surprise to many analysts who predicted continued exponential growth for the EV market. While overall sales of electric vehicles surged into 2024 and did increase by 7% compared to Q1 2023, this growth wasn't enough to keep pace with the overall rise in vehicle sales. The result: a decline in market share from 18.8% in Q4 2023 to 18.0% in Q1 2024.

Several factors may be contributing to this shift. One potential culprit is a slowdown in battery electric vehicle sales. BEVs saw their share of the market dip from 8.1% to 7.0% in the same period. This could be attributed to a lack of readily available affordable options, with many popular EV models still commanding premium prices and concerns that EV supply may miss demand in the near term.

Another factor could be the rising interest in plug-in hybrid electric vehicles (PHEVs). PHEV sales witnessed a significant jump of 50% year-over-year, reflecting how gas-electric hybrids are getting a boost from major automakers, potentially indicating a consumer preference for vehicles that offer both electric and gasoline powertrain options, addressing concerns about range anxiety often associated with BEVs.

Industry experts offer mixed interpretations of this data. Some downplay the significance of the dip, attributing it to a temporary blip, even though EVs remain behind gas cars in total sales. They point to the ongoing commitment from major automakers to invest in EV production and the potential for new, more affordable models to hit the market soon.

Others express more concern, citing Europe's recent EV slump and suggesting this might be a sign of maturing consumer preferences. They argue that simply increasing the number of EVs on the market might not be enough. Automakers need to address issues like affordability, charging infrastructure, and range anxiety to maintain momentum.

The role of government incentives also remains a question mark. The federal tax credit for electric vehicles is currently set to phase out gradually, potentially impacting consumer purchasing decisions in the future. Continued government support, through incentives or infrastructure development, could be crucial in maintaining consumer interest.

The coming quarters will be crucial in determining the long-term trajectory of the U.S. EV market, especially after the global electric car market's rapid expansion in recent years. Whether this is a temporary setback or a more lasting trend remains to be seen. Addressing consumer concerns, ensuring a diverse range of affordable EV options, and continued government support will all be essential in ensuring the continued growth of this critical sector.

This development also presents an opportunity for traditional automakers. By capitalizing on the growing PHEV market and addressing consumer concerns about affordability and range anxiety, they can carve out a strong position in the evolving automotive landscape.


Related News

View more

Sign Up for Electricity Forum’s Newsletter

Stay informed with our FREE Newsletter — get the latest news, breakthrough technologies, and expert insights, delivered straight to your inbox.

Electricity Today T&D Magazine Subscribe for FREE

Stay informed with the latest T&D policies and technologies.
  • Timely insights from industry experts
  • Practical solutions T&D engineers
  • Free access to every issue

Download the 2025 Electrical Training Catalog

Explore 50+ live, expert-led electrical training courses –

  • Interactive
  • Flexible
  • CEU-cerified