New Brunswick Small Modular Reactors promise clean energy, jobs, and economic growth, say NB Power, ARC Nuclear, and Moltex Energy; critics cite cost overruns, nuclear waste risks, market viability, and reliance on government funding.
Key Points
Compact reactors proposed in NB to deliver low-carbon power and jobs; critics warn of costs, waste, and market risks.
✅ Promised jobs, exports, and net-zero support via NB Power partnerships
✅ Critics cite cost overruns, nuclear waste, and weak market demand
✅ Government funding pivotal; ARC and Moltex advance licensing
When Mike Holland talks about small modular nuclear reactors, he sees dollar signs.
When the Green Party hears about them, they see danger signs.
The loquacious Progressive Conservative minister of energy development recently quoted NB Power's eye-popping estimates of the potential economic impact of the reactors: thousands of jobs and a $1 billion boost to the provincial economy.
"New Brunswick is positioned to not only participate in this opportunity, but to be a world leader in the SMR field," Holland said in the legislature last month.
'Huge risk' nuclear deal could let Ontario push N.B. aside, says consultant
'Many issues' with modular nuclear reactors says environmental lawyer
Green MLAs David Coon and Kevin Arseneau responded cheekily by ticking off the Financial and Consumer Services Commission's checklist on how to spot a scam.
Is the sales pitch from a credible source? Is the windfall being promised by a reputable institution? Is the risk reasonable?
For small nuclear reactors, they said, the answer to all those questions is no.
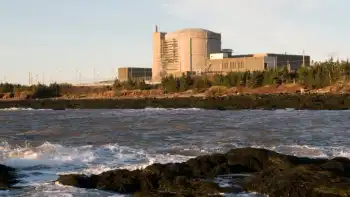
"The last thing we need to do is pour more public money down the nuclear-power drain," Coon said, reminding MLAs of the Point Lepreau refurbishment project that went $1 billion over budget.
The Greens aside, New Brunswick politicians have embraced small modular reactors as part of a broader premiers' nuclear initiative to develop SMR technology, which they say can both create jobs and help solve the climate crisis.
Smaller and cheaper, supporters say
They're "small" because, depending on the design, they would generate from three to 300 megawatts of electricity, less than, for example, Point Lepreau's 660 megawatts.
It's the modular design that is supposed to make them more affordable, as explained in next-gen nuclear guides, with components manufactured elsewhere, sometimes in existing factories, then shipped and assembled.
Under Brian Gallant, the Liberals handed $10 million to two Saint John companies working on SMRs, ARC Nuclear and Moltex Energy.
Greens point to previous fiascoes
The Greens and other opponents of nuclear power fear SMRS are the latest in a long line of silver-bullet fiascoes, from the $23 million spent on the Bricklin in 1975 to $63.4 million in loans and loan guarantees to the Atcon Group a decade ago.
"It seems that [ARC and Moltex] have been targeting New Brunswick for another big handout ... because it's going to take billions of dollars to build these things, if they ever get off the drawing board," said Susan O'Donnell, a University of New Brunswick researcher.
O'Donnell, who studies technology adoption in communities, is part of a small new group called the Coalition for Responsible Energy Development formed this year to oppose SMRs.
"What we really need here is a reasonable discussion about the pros and cons of it," she said.
Government touts economic spinoffs
According to the Higgs government's throne speech last month, if New Brunswick companies can secure just one per cent of the Canadian market for small reactors, the province would see $190 million in revenue.
The figures come from a study conducted for NB Power by University of Moncton economist Pierre-Marcel Desjardins.
But a four-page public summary does not include any sales projections and NB Power did not provide them to CBC News.
"What we didn't see was a market analysis," O'Donnell said. "How viable is the market? … They're all based on a hypothetical market that probably doesn't exist."
O'Donnell said her group asked for the full report but was told it's confidential because it contains sensitive commercial information.
Holland said he's confident there will be buyers.
"It won't be hard to find communities that will be looking for a cost effective, affordable, safe alternative to generate their electricity and do it in a way that emits zero emissions," he said.
SMRs come in different sizes and while some proponents talk about using "micro" reactors to provide electricity to remote northern First Nations communities, ARC and Moltex plan larger models to sell to power utilities looking to shift away from coal and gas.
"We have utilities and customers across Canada, where Ontario's first SMR groundbreaking has occurred already, across the United States, across Asia and Europe saying they desperately want a technology like this," said Moltex's Saint John-based CEO for North America Rory O'Sullivan.
"The market is screaming for this product," he said, adding "all of the utilities" in Canada are interested in Moltex's reactors
ARC's CEO Norm Sawyer is more specific, guessing 30 per cent of his SMR sales will be in Atlantic Canada, 30 per cent in Ontario, where Darlington SMR plans are advancing, and 40 per cent in Alberta and Saskatchewan — all provincial power grids.
O'Donnell said it's an important question because without a large number of guaranteed sales, the high cost of manufacturing SMRs would make the initiative a money-loser.
The cost of building the world's only functioning SMR, in Russia, was four times what was expected.
An Australian government agency said initial cost estimates for such major projects "are often initially too low" and can "overrun."
Up-front costs can be huge
University of British Columbia physicist M.V. Ramana, who has authored studies on the economics of nuclear power, said SMRs face the same financial reality as any large-scale manufacturing.
"You're going to spend a huge amount of money on the basic fixed costs" at the outset, he said, with costs per unit becoming more viable only after more units are built and sold.
He estimates a company would have to build and sell more than 700 SMRs to break even, and said there are not enough buyers for that to happen.
But Sawyer said those estimates don't take into account technological advances.
"A lot of what's being said ... is really based on old technology," he said, estimating ARC would be viable even if it sold an amount of reactors in the low double digits.
O'Sullivan agrees.
"In fact, just the first one alone looks like it will still be economical," he said. "In reality, you probably need a few … but you're talking about one or two, maximum three [to make a profit] because you don't need these big factories."
'Paper designs' prove nothing, says expert
Ramana doesn't buy it.
"These are all companies that have been started by somebody who's been in the nuclear industry for some years, has a bright idea, finds an angel investor who's given them a few million dollars," he said.
"They have a paper design, or a Power Point design. They have not built anything. They have not tested anything. To go from that point … to a design that can actually be constructed on the field is an enormous amount of work."
Both CEOs acknowledge the skepticism about SMRs.
'The market is screaming for this product,' said Moltex’s Saint John-based CEO for North America, Rory O’Sullivan. (Brian Chisholm, CBC)
"I understand New Brunswick has had its share of good investments and its share of what we consider questionable investments," said Sawyer, who grew up in Rexton.
But he said ARC's SMR is based on a long-proven technology and is far past the on-paper design stage "so you reduce the risk."
Moltex is now completing the first phase of the Canadian Nuclear Safety Commission's review of its design, a major hurdle. ARC completed that phase last year.
But, Ramana said there are problems with both designs. Moltex's molten salt model has had "huge technical challenges" elsewhere while ARC's sodium-cooled system has encountered "operational difficulties."
Ottawa says nuclear is needed for climate goals
The most compelling argument for looking at SMRs may be Ottawa's climate change goals, and international moves like the U.K.'s green industrial revolution plan point to broader momentum.
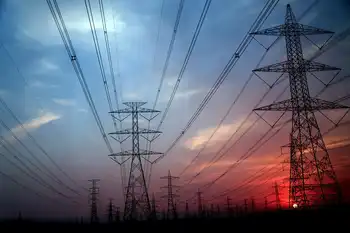
The national climate plan requires NB Power to phase out burning coal at its Belledune generating station by 2030. It's scrambling to find a replacement source of electricity.
The Trudeau government's throne speech in October promised to "support investments in renewable energy and next-generation clean energy and technology solutions."
And federal Natural Resources Minister Seamus O'Regan told CBC earlier this year that he's "very excited" about SMRs and has called nuclear key to climate goals in Canada as well.
"We have not seen a model where we can get to net-zero emissions by 2050 without nuclear," he said.
O'Donnell said while nuclear power doesn't emit greenhouse gases, it's hardly a clean technology because of the spent nuclear fuel waste.
Government support is key
She also wonders why, if SMRs make so much sense, ARC and Moltex are relying so much on government money rather than private capital.
Holland said "the vast majority" of funding for the two companies "has to come from private sector investments, who will be very careful to make sure they get a return on that investment."
Sawyer said ARC has three dollars for every dollar it has received from the province, and General Electric has a minority ownership stake in its U.S.-based parent company.
O'Sullivan said Moltex has attracted $5 million from a European engineering firm and $6 million from "the first-ever nuclear crowdfunding campaign."
But he said for new technologies, including nuclear power, "you need government to show policy support.
"Nuclear technology has always been developed by governments around the world. This is a very new change to have an industry come in and lead this, so private investors can't take the risk to do that on their own," he said.
So far, Ottawa hasn't put up any funding for ARC or Moltex. During the provincial election campaign, Higgs implied federal money was imminent, but there's been no announcement in the almost three months since then.
Last month the federal government announced $20 million for Terrestrial Energy, an Ontario company working on SMRs, alongside OPG's commitment to SMRs in the province, underscoring momentum.
"We know we have the best technology pitch," O'Sullivan said. "There's others that are slightly more advanced than us, but we have the best overall proposition and we think that's going to win out at the end of the day."
But O'Donnell said her group plans to continue asking questions about SMRs.
"I think what we really need is to have an honest conversation about what these are so that New Brunswickers can have all the facts on the table," she said.
Related News