Crosbie Hydro Energy Action Plan outlines rate mitigation for Muskrat Falls, leveraging Nalcor oil revenues, export sales, Holyrood savings, and potential Hydro-Quebec taxation to keep Newfoundland and Labrador electricity rates near 14.67 cents/kWh.
Key Points
PC plan to cap post-Muskrat rates by using Nalcor revenues, exports, and savings, with optional Accord funds.
✅ $575.4M yearly to hold rates near 14.67 cents/kWh
✅ Sources: Nalcor oil $231M, Holyrood $150M, rates/dividends $123.4M
✅ Options: export sales, restructuring, Atlantic Accord, HQ tax
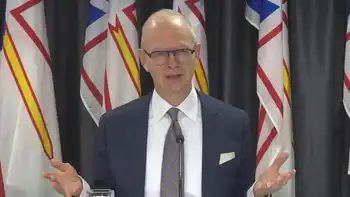
Newfoundland and Labrador PC Leader Ches Crosbie says Muskrat Falls won't drive up electricity rates, a goal consistent with an agreement to shield ratepayers from cost overruns, if he's elected premier.
According to Crosbie, who presented the party's Crosbie Hydro Energy Action Plan — acronym CHEAP — at a press conference Monday, $575.4 million is needed per year in order to keep rates from ballooning past 14.67 cents per kilowatt hour.
Here's where he thinks the money could come from:
- Hydro rates and dividends — $123.4 million
- Export sales — $40.1 million
- Nalcor restructuring — $30 million
- Holyrood savings — $150 million
- Nalcor oil revenue — $231 million
The oil money, Crosbie said, isn't going into government coffers but being invested into the offshore which, he said, is a good place for it.
"But the plan from the beginning around Muskrat Falls was that if there was need for it — for mitigation for rates — that those revenues and operating cash flows from Nalcor oil and gas would be available to be recycled into rate mitigation, as reflected in a recent financial update on the pandemic's impact. and that's what we're going to have to do," he said.
According to Crosbie, his numbers come from the preliminary stage of the Public Utilities Board process, even as rate mitigation talks have lacked public details.
This is a recent aerial view of the Muskrat Falls project in central Labrador. The project is more than 90 per cent complete, with first power forecast for late 2019, alongside Ottawa's $5.2B support for the project. (Nalcor)
"I'm telling you this is the best information available to anyone outside of government," he said. "We're working on what we can."
The PUB estimated Nalcor restructuring could save between $10 million and $15 million, according to Crosbie, but he figures there's "enough duplication and overpayment involved in the way things are now set up that we can find $30 million there."
Currently, provincial ratepayers pay about 12 cents per kilowatt hour as electricity users have started paying for Muskrat Falls costs.
Crosbie's $575.4-million figure would put rates at 14.67 cents per kilowatt-hour in 2021, where his plan pledges to keep them.
A recent Public Utilities Board Report says there's a potential $10 million to $15 million in savings from Nalcor, but Crosbie says he can find $30 million. (CBC)
"The promise is that Muskrat Falls, when it comes online — comes in service — will not increase your rates. Between now and when that happens there are rate increases already in the pipeline up to that level of [14.67 cents per kilowatt-hour] … so that is the baseline target rate at which rates will be kept.
"In other words, Muskrat will not drive up prices for electricity to consumers beyond that point."
In addition to those savings, Crosbie's plan outlined two further steps.
"We think it could be done out of the resources that I've just identified now, but if there's a problem with that, and as a temporary measure, we can use a modest amount of the Atlantic Accord review, fiscal review, revenues," he said.
Plan 'nothing new'
Premier Dwight Ball slammed the plan at the House of Assembly on Monday, saying it lacked insight.
"It was a copy and paste exercise," he told reporters. "There's nothing new in that plan. Not at all."
"We're not leaving any stone unturned of where the opportunity would be to actually generate revenue," he said. "We are genuinely concerned about rate mitigation and we've got to get a plan in place."
Potential to tax Hydro-Québec
Crosbie also said there's potential to tax Hydro-Québec.
According to Crosbie, tax exemptions that expired in 2016 allow the province to tax exports from the Upper Churchill, which, he said, could result in "hundreds of millions or billions" in revenue.
"It's not my philosophy to immediately go and do that because that would generate litigation — who needs more of that? — but we do need to let Quebec know that we're very aware of that, and aware of that opportunity, and invite them to come talk about a whole host of issues," Crosbie said.
Crosbie said the tax would also have to be applied to domestic consumption.
"But so massive is the potential revenue from the Upper Churchill export that there would be ways to mitigate that and negate the effect of that on consumers in the province."
Crosbie said with the Atlantic Accord revenue, he could still present a balanced budget by 2022.
Related News