Demise of nuclear plant plans ‘devastating’ to Welsh economy, MP claims


Wylfa project

CSA Z462 Arc Flash Training - Electrical Safety Essentials

Our customized live online or in‑person group training can be delivered to your staff at your location.

  • Live Online
  • 6 hours Instructor-led
  • Group Training Available
Regular Price:
$249
Coupon Price:
$199
Reserve Your Seat Today

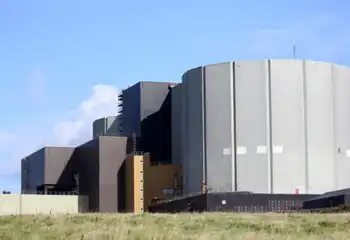
Wylfa Nuclear Project Cancellation reflects Hitachi's withdrawal, pulling £16bn from North Wales, risking jobs, reshaping UK nuclear power plans as renewables grow and Chinese involvement rises amid shifting energy market policies.


Key Points

An indefinite halt to Hitachi's Wylfa Newydd nuclear plant, removing about £16bn investment and jobs from North Wales.

✅ Hitachi withdraws funding amid changing energy market costs

✅ Puts 400 local roles and up to 10,000 construction jobs at risk

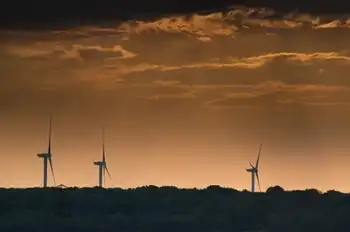
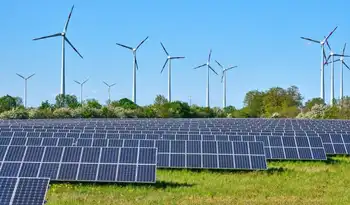
✅ UK shifts toward renewables as nuclear project support stalls


Chris Ruane said Japanese firm Hitachi’s announcement this morning about the Wylfa project would take £16 billion of investment out of the region.

He said it was the latest in a list of energy projects which had been scrapped as he responded to a statement from business secretary Greg Clark.

Mr Ruane, the Labour member for the Vale of Clywd, said: “In his statement he said the Government are relying now more on renewables, can I put the North Wales picture to him; 1,500 wind turbines were planned off the coast of North Wales. They were removed, those plans were cancelled by the private sector.

“The tidal lagoons for Wales were key to the development of the Welsh economy – the Government itself pulled the support for the Swansea Bay tidal lagoon. That had a knock-on effect for the huge lagoon planned off the coast of North Wales.

“And now today we hear of the cancellation of a £16 billion investment in the North Wales economy. This will devastate the North Wales economy. The people of North Wales need to know that the Prime Minister is batting for them and batting for the UK.”

Mr Clark blamed the changing landscape of the energy market for today’s announcement, and said Wales has been a “substantial and proud leader” in renewable energy during the UK’s green industrial revolution over recent years.

But another Labour MP from North Wales, Albert Owen, of Ynys Mon, said the Wylfa plant’s cancellation in his constituency is putting 400 jobs at risk, as well as the “potential of 8-10,000 construction jobs”, as well as hundreds of operational jobs and 33 apprenticeships.

He asked Mr Clark: “Can I say straightly can we work together to keep this project alive, to ensure that we create the momentum so it can be ready for a future developer or this developer with the right mechanism?”

The minister replied that he and his officials would “work together in a completely open-book way on the options” to try and salvage the project.

But in the Lords, Labour former security minister Lord West of Spithead said the UK’s nuclear industry was in crisis, noting that Europe is losing nuclear power as well.

“In the 1950s our nation led the world in nuclear power generation and decisions by successive governments, of all hues, have got us in the position today where we cannot even construct a large civil nuclear reaction,” he told peers at question time.

Lord West asked: “Are we content that now the only player seems to be Chinese and that by 2035… we are happy for the Chinese to control one third of the energy supply of our nation?”

Business, Energy and Industrial Strategy minister Lord Henley said the Government had hoped for a better announcement from Hitachi but that was not the case.

He said costs in the nuclear sector were rising, amid setbacks at Hinkley Point C, while costs for many renewables were coming down and this was one of the reasons for the problem.

Tory former energy secretary Lord Howell of Guildford said the Chinese were in “pole position” for the rebuilding and replacement “of our nuclear fleet” and this would have a major impact on UK energy policy and plans to meet net zero targets in the 2030s.

Plaid Cymru’s Lord Wigley warned that putting the Wylfa Newydd on indefinite hold would cause economic planning blight in north-west Wales and urged the Government to raise the level of support allocated to the region.

Lord Henley acknowledged the announcement was not welcome but added: “We remain committed to nuclear power. We will look to see what we can do. We still have a great deal of expertise in this country and we can work on that.”


Related News

Related News

Hydro One crews restore power to more than 277,000 customers following damaging storms in Ontario

Hydro One Power Restoration showcases outage recovery after a severe windstorm, with crews repairing downed power lines, broken poles and crossarms, partnering with utilities and contractors to boost grid resilience and promote emergency kit preparedness.


Key Points

A coordinated response by Hydro One and partners to repair storm damage, restore outages, strengthen grid resilience.

✅ Crews repaired downed lines, broken poles, and crossarms

✅ Partners and contractors aided rapid outage restoration

✅ Investments improve grid resilience and emergency readiness


Hydro One crews have restored power to more than 277,000 customers following back-to-back storms, with impacts felt in communities like Sudbury where local crews worked to reconnect service, including a damaging windstorm on that caused 57 broken poles, 27 broken crossarms, as well as downed power lines and fallen trees on lines. Hydro One crews restored power to more than 140,000 customers within 24 hours of Friday's windstorm, even as Toronto outages persisted for some customers elsewhere.

'We understand power outages bring life to a halt, which is why we are continuously improving our storm response, as employee COVID-19 support demonstrated, while making smart investments in a resilient, reliable and sustainable electricity system to energize life for families, businesses and communities for years to come,' said David Lebeter, Chief Operating Officer, Hydro One. 'We thank our customers for their patience as our crews worked tirelessly, alongside our utility partners and contractors, including Ontario crews in Florida, to restore power as quickly and as safely as possible.'

Hydro One thanks all of its utility partners and contractors who assisted with restoration efforts following the windstorm (alongside similar Quebec outages that highlighted the broader impact), including Durham High Voltage, EPCOR, ERTH Power, K-Line Construction Ltd., Lakeland Power Distribution Ltd., North Bay Hydro, Sproule Powerline Construction Ltd. and Valard Construction.

Hydro One encourages customers to restock their emergency kits following these storms, which utilities such as BC Hydro have also characterized as atypical, and to be aware of support programs like our pandemic relief fund that can help during difficult periods, to ensure they're prepared for an emergency or extended power outage.


Related News

View more

China boosts wind energy, photovoltaic and concentrated solar power

China Renewable Energy Law drives growth in wind power, solar thermal, and photovoltaic capacity, supporting grid integration and five-year plans, even as China leads CO2 emissions, with policy incentives, compliance inspections, and national resource assessments.


Key Points

A legal framework that speeds wind, solar thermal, and PV growth in China via mandates, incentives, and grid rules.

✅ 2018 renewables: 1.87T kWh, 26.7% of national power

✅ Over 100 State Council policies enabling deployment

✅ Law inspections and regional oversight across six provinces


China leads renewable energies, installing more wind power, solar thermal and photovoltaic than any other country, as seen in the China solar PV growth reported in 2016, but also leads CO2 emissions, and much remains to be done.

The effective application of Chinas renewable energy law has boosted the use of renewable energy in the country and facilitated the rapid development of the sector, as solar parity across Chinese cities indicates, a report said.

The report on compliance with renewable energy law was presented today at the current bimonthly session of the Standing Committee of the National Peoples Assembly (APN).

Electricity generated by renewable energy amounted to about 1.87 trillion kilowatts per hour in 2018, representing 26.7 percent of Chinas total energy production in the year, aligning with trends where wind and solar doubling globally over five years, the report said.

Ding Zhongli, vice president of the NPC Standing Committee, presented the report to the legislators at the second plenary meeting of the session.

An inspection of the law enforcement was carried out from August to November, as U.S. renewables hit 28% record showed momentum elsewhere. A total of 21 members of the NPC Standing Committee and the NPC Environmental Protection and Resource Conservation Committee, as well as national legislators, traveled to six regions at the provincial level on inspection visits. Twelve legislative bodies at the provincial level inspected the law enforcement efforts in their jurisdictions.

The relevant State Council agencies have implemented more than 100 regulations and policies to foster a good policy environment for the development of renewable energy, as seen in markets where U.S. renewable electricity surpassed coal in 2022. Local regulations have also been formulated based on local conditions, according to the report.

In accordance with the law, a thorough investigation of the national conditions of renewable energy resources was undertaken.

In 2008 and 2014 atlas of solar energy resources and wind energy evaluation of China were issued. The relevant agencies of the State Council have also implemented five-year plans for the development of renewable energy, which have provided guidance to the sector, while countries like Ireland's one-third green power target remain in focus within four years.

The main provisions of the law have been met, the law has been effectively applied and the purpose of the legislation has been met, and this momentum is echoed abroad, with U.S. renewables near one-fourth according to projections, Ding said.


Related News

View more

Over 30% of Global Electricity from Renewables

Global Renewable Electricity Milestone signals solar, wind, hydro, and geothermal surpass 30% of power generation, driven by falling costs, battery storage, smart grids, and ambitious policy targets that strengthen energy security and decarbonization.


Key Points

It marks renewables exceeding 30% of global power, enabled by cheaper tech, storage, and strong policy.

✅ Costs of solar and wind fall, boosting competitiveness

✅ Storage and smart grids improve reliability and flexibility

✅ Policies target decarbonization while ensuring just transition


A recent report by the energy think tank Ember marks a significant milestone in the global energy transition. For the first time ever, according to their analysis, renewable energy sources like solar, wind, hydro, and geothermal now account for more than 30% of the world's electricity generation, a milestone echoed by wind and solar growth globally. This achievement signifies a pivotal shift towards a cleaner and more sustainable energy future.

The report attributes this growth to several key factors. Firstly, the cost of renewable energy technologies like solar panels and wind turbines has plummeted in recent years, making them increasingly competitive with traditional fossil fuels. Secondly, advancements in battery storage technology are facilitating the integration of variable renewable sources like solar and wind into the grid, addressing concerns about reliability. Thirdly, a growing number of countries are implementing ambitious renewable energy targets and policies, driven by environmental concerns and the desire for energy security.

The rise of renewables is not uniform across the globe. Europe leads the pack, with the European Union generating a staggering 44% of its electricity from renewable sources in 2023. Countries like Denmark, Germany, and Spain are at the forefront of this clean energy revolution. Developing nations are also starting to embrace renewables, driven by factors like falling technology costs and the need for affordable electricity access.

However, challenges remain. Fossil fuels still dominate the global energy mix, accounting for roughly two-thirds of electricity generation. Integrating a higher proportion of variable renewables into the grid necessitates robust storage solutions and smart grid technologies. Additionally, the transition away from fossil fuels needs to be managed carefully to ensure a just and equitable outcome for workers in the coal, oil, and gas sectors.

Despite these challenges, the report by Ember paints an optimistic picture. The rapid growth of renewables demonstrates their increasing viability and underscores the global commitment to a cleaner energy future, and in the United States, for example, renewables are projected to reach one-fourth of U.S. electricity generation, reinforcing this trajectory. The report also highlights the economic benefits of renewables, with new jobs created in the clean energy sector and reduced reliance on volatile fossil fuel prices.

Looking ahead, continued technological advancements, supportive government policies, and increased investment in renewable energy infrastructure are all crucial for further growth, with scenarios such as BNEF's 2050 outlook suggesting wind and solar could provide half of electricity, underscoring the importance of sustained effort. Furthermore, international cooperation is essential to ensure a smooth and equitable global energy transition. Developed nations can play a vital role by sharing technology and expertise with developing countries.

The 30% milestone is a significant step forward, but it's just the beginning. As the world strives to combat climate change and ensure energy security for future generations, renewables are poised to play a central role in powering a sustainable future, with wind and solar surpassing coal in the U.S. offering a clear signal of the shift. The report by Ember serves as a powerful reminder that a clean energy future is not just a dream, but a rapidly unfolding reality.


Related News

View more

Which of the cleaner states imports dirty electricity?

Hourly Electricity Emissions Tracking maps grid balancing areas, embodied emissions, and imports/exports, revealing carbon intensity shifts across PJM, ERCOT, and California ISO, and clarifying renewable energy versus coal impacts on health and climate.


Key Points

An hourly method tracing generation, flows, and embodied emissions to quantify carbon intensity across US balancing areas.

✅ Hourly traces of imports/exports and generation mix

✅ Consumption-based carbon intensity by balancing area

✅ Policy insights for renewables, coal, health costs


In the United States, electricity generation accounts for nearly 30% of our carbon emissions. Some states have responded to that by setting aggressive renewable energy standards; others are hoping to see coal propped up even as its economics get worse. Complicating matters further is the fact that many regional grids are integrated, and as America goes electric the stakes grow, meaning power generated in one location may be exported and used in a different state entirely.

Tracking these electricity exports is critical for understanding how to lower our national carbon emissions. In addition, power from a dirty source like coal has health and environment impacts where it's produced, and the costs of these aren't always paid by the parties using the electricity. Unfortunately, getting reliable figures on how electricity is produced and where it's used is challenging, even for consumers trying to find where their electricity comes from in the first place, leaving some of the best estimates with a time resolution of only a month.

Now, three Stanford researchers—Jacques A. de Chalendar, John Taggart, and Sally M. Benson—have greatly improved on that standard, and they have managed to track power generation and use on an hourly basis. The researchers found that, of the 66 grid balancing areas within the United States, only three have carbon emissions equivalent to our national average, and they have found that imports and exports of electricity have both seasonal and daily changes. de Chalendar et al. discovered that the net results can be substantial, with imported electricity increasing California's emissions/power by 20%.

Hour by hour
To figure out the US energy trading landscape, the researchers obtained 2016 data for grid features called balancing areas. The continental US has 66 of these, providing much better spatial resolution on the data than the larger grid subdivisions. This doesn't cover everything—several balancing areas in Canada and Mexico are tied in to the US grid—and some of these balancing areas are much larger than others. The PJM grid, serving Pennsylvania, New Jersey, and Maryland, for example, is more than twice as large as Texas' ERCOT, in a state that produces and consumes the most electricity in the US.

Despite these limitations, it's possible to get hourly figures on how much electricity was generated, what was used to produce it, and whether it was used locally or exported to another balancing area. Information on the generating sources allowed the researchers to attach an emissions figure to each unit of electricity produced. Coal, for example, produces double the emissions of natural gas, which in turn produces more than an order of magnitude more carbon dioxide than the manufacturing of solar, wind, or hydro facilities. These figures were turned into what the authors call "embodied emissions" that can be traced to where they're eventually used.

Similar figures were also generated for sulfur dioxide and nitrogen oxides. Released by the burning of fossil fuels, these can both influence the global climate and produce local health problems.

Huge variation
The results were striking. "The consumption-based carbon intensity of electricity varies by almost an order of magnitude across the different regions in the US electricity system," the authors conclude. The low is the Bonneville Power grid region, which is largely supplied by hydropower; it has typical emissions below 100kg of carbon dioxide per megawatt-hour. The highest emissions come in the Ohio Valley Electric region, where emissions clear 900kg/MW-hr. Only three regional grids match the overall grid emissions intensity, although that includes the very large PJM (where capacity auction payouts recently fell), ERCOT, and Southern Co balancing areas.

Most of the low-emissions power that's exported comes from the Pacific Northwest's abundant hydropower, while the Rocky Mountains area exports electricity with the highest associated emissions. That leads to some striking asymmetries. Local generation in the hydro-rich Idaho Power Company has embodied emissions of only 71kg/MW-hr, while its imports, coming primarily from Rocky Mountain states, have a carbon content of 625kg/MW-hr.

The reliance on hydropower also makes the asymmetry seasonal. Local generation is highest in the spring as snow melts, but imports become a larger source outside this time of year. As solar and wind can also have pronounced seasonal shifts, similar changes will likely be seen as these become larger contributors to many of these regional grids. Similar things occur daily, as both demand and solar production (and, to a lesser extent, wind) have distinct daily profiles.

The Golden State
California's CISO provides another instructive case. Imports represent less than 30% of its total electric use in 2016, yet California electricity imports provided 40% of its embodied emissions. Some of these, however, come internally from California, provided by the Los Angeles Department of Water and Power. The state itself, however, has only had limited tracking of imported emissions, lumping many of its sources as "other," and has been exporting its energy policies to Western states in ways that shape regional markets.

Overall, the 2016 inventory provides a narrow picture of the US grid, as plenty of trends are rapidly changing our country's emissions profile, including the rise of renewables and the widespread adoption of efficiency measures and other utility trends in 2017 that continue to evolve. The method developed here can, however, allow for annual updates, providing us with a much better picture of trends. That could be quite valuable to track things like how the rapid rise in solar power is altering the daily production of clean power.

More significantly, it provides a basis for more informed policymaking. States that wish to promote low-emissions power can use the information here to either alter the source of their imports or to encourage the sites where they're produced to adopt more renewable power. And those states that are exporting electricity produced primarily through fossil fuels could ensure that the locations where the power is used pay a price that includes the health costs of its production.


Related News

View more

US Grid Gets an Overhaul for Renewables

FERC Transmission Planning Overhaul streamlines interregional grid buildouts, enabling high-voltage lines, renewable integration, and grid reliability to scale, cutting fossil reliance while boosting decarbonization, climate resilience, and affordability across regions facing demand and extreme weather.


Key Points

Federal rule updating interregional grid planning to integrate renewables, share costs, and improve reliability.

✅ Accelerates high-voltage, interregional lines for renewable transfer

✅ Optimizes transmission planning and cost allocation frameworks

✅ Boosts grid reliability, resilience, and emissions reductions


The US took a significant step towards a cleaner energy future on May 13th, 2024. The Federal Energy Regulatory Commission (FERC) approved the first major update to the country's electric transmission policy in over a decade, while congressional Democrats continue to push for action on aggregated DERs within FERC's remit today. This overhaul aims to streamline the process of building new power lines, specifically those that connect different regions. This improved connectivity is crucial for integrating more renewable energy sources like wind and solar into the national grid.

The current system faces challenges in handling the influx of renewables, and the aging U.S. grid amplifies those hurdles today. Renewable energy sources are variable by nature – the sun doesn't always shine, and the wind doesn't always blow. Traditionally, power grids have relied on constantly running power plants, like coal or natural gas, to meet electricity demands. These plants can be easily adjusted to produce more or less power as needed. However, renewable energy sources require a different approach.

The new FERC policy focuses on building more interregional transmission lines. These high-voltage power lines would allow electricity generated in regions with abundant solar or wind power, and even enable imports of green power from Canada in certain corridors, to be transmitted to areas with lower renewable energy resources. For example, solar energy produced in sunny states like California could be delivered to meet peak demand on the East Coast during hot summer days.

This improved connectivity offers several advantages. Firstly, it allows for a more efficient use of renewable resources. Secondly, it reduces the need for fossil fuel-based power plants, leading to cleaner air and lower greenhouse gas emissions. Finally, a more robust grid is better equipped to handle extreme weather events, which are becoming increasingly common due to climate change, and while Biden's climate law shows mixed results on decarbonization, stronger transmission supports resilience.

The need for an upgrade is undeniable. The Biden administration has set ambitious goals for decarbonizing the power sector by 2035, including proposals for a clean electricity standard as a pathway to those targets. A study by the US Department of Energy estimates that achieving this target will require more than doubling the country's regional transmission capacity and increasing interregional capacity by more than fivefold. The aging US grid is already struggling to keep up with current demands, and without significant improvements, it could face reliability issues in the future.

The FERC's decision has been met with praise from environmental groups and renewable energy companies. They see it as a critical step towards achieving a clean energy future. However, some stakeholders, including investor-owned utilities, have expressed concerns about the potential costs associated with building new transmission lines, citing persistent barriers to development identified in recent Senate testimony. Finding the right balance between efficiency, affordability, and environmental responsibility will be key to the success of this initiative.

The road ahead won't be easy. Building new power lines is a complex process that can face opposition from local communities, and broader disputes over electricity pricing changes often complicate planning and approvals. However, the potential benefits of a modernized grid are significant. By investing in this overhaul, the US is taking a crucial step towards a more reliable, sustainable, and cleaner energy future.


Related News

View more

U.S. Residents Averaged Fewer Power Outages in 2022

2022 U.S. Power Outage Statistics show lower SAIDI as fewer major events hit, with SAIFI trends, electric reliability, outage duration and frequency shaped by hurricanes, winter storms, vegetation, and utility practices across states.


Key Points

They report SAIDI and SAIFI for 2022, showing outage duration, frequency, and impacts of major weather events.

✅ 2022 SAIDI averaged 5.6 hours; SAIFI averaged 1.4 interruptions.

✅ Fewer major events lowered outage duration versus 2021.

✅ Hurricanes and winter storms drove long outages in several states.


In 2022, U.S. electricity consumers on average experienced about 5.5 hours of power disruptions, a decrease from nearly two hours compared to 2021. This information comes from the latest Annual Electric Power Industry Report. The reduction in yearly power interruptions primarily resulted from fewer significant events in 2022 compared to the previous year, and utility disaster planning continues to support grid resilience as severe weather persists.

Since 2013, excluding major events, the annual average duration of power interruptions has consistently hovered around two hours. Factors contributing to major power disruptions include weather-related incidents, vegetation interference near power lines, and specific utility practices, while pandemic-related grid operations influenced workforce planning more than outage frequency. To assess the reliability of U.S. electric utilities, two key indexes are utilized:

  • The System Average Interruption Duration Index (SAIDI) calculates the total length (in hours) an average customer endures non-brief power interruptions over a year.
  • The System Average Interruption Frequency Index (SAIFI) tracks the number of times interruptions occur.

The influence of major events on electrical reliability is gauged by comparing affected states' SAIDI and SAIFI values against the U.S. average, which was 5.6 hours of outages and 1.4 outages per customer in 2022. The year witnessed 18 weather-related disasters in the U.S., each resulting in over $1 billion in damages, and COVID-19 grid assessments indicated the electricity system was largely safe from pandemic impacts. Noteworthy major events include:

  • Hurricane Ian in September 2022, leaving over 2.6 million Floridian customers without electricity, with restoration in some areas taking weeks rather than days.
  • Hurricane Nicole in November 2022, causing over 300,000 Florida customers to lose power.
  • Winter Storm Elliott in December 2022, affecting over 1.5 million customers in multiple states including Texas where utilities struggled after Hurricane Harvey to restore service, and Florida, and bringing up to four feet of snow in parts of New York.

In 2022, states like Florida, West Virginia, Maine, Vermont, and New Hampshire experienced the most prolonged power interruptions, with New Hampshire averaging 10.3 hours and Florida 19.1 hours, and FPL's Irma storm response illustrates how restoration can take days or weeks in severe cases. Conversely, the District of Columbia, Delaware, Rhode Island, Nebraska, and Iowa had the shortest total interruptions, with the District of Columbia averaging just 34 minutes and Iowa 85 minutes.

The frequency of outages, unlike their duration, is more often linked to non-major events. Across the nation, Alaska recorded the highest number of power disruptions per customer (averaging 3.5), followed by several heavily forested states like Tennessee and Maine. Power outages due to falling tree branches are common, particularly during winter storms that burden tree limbs and power lines, as seen in a North Seattle outage affecting 13,000 customers. The District of Columbia stood out with the shortest and fewest outages per customer.


Related News

View more

Sign Up for Electricity Forum’s Newsletter

Stay informed with our FREE Newsletter — get the latest news, breakthrough technologies, and expert insights, delivered straight to your inbox.

Electricity Today T&D Magazine Subscribe for FREE

Stay informed with the latest T&D policies and technologies.
  • Timely insights from industry experts
  • Practical solutions T&D engineers
  • Free access to every issue

Live Online & In-person Group Training

Advantages To Instructor-Led Training – Instructor-Led Course, Customized Training, Multiple Locations, Economical, CEU Credits, Course Discounts.

Request For Quotation

Whether you would prefer Live Online or In-Person instruction, our electrical training courses can be tailored to meet your company's specific requirements and delivered to your employees in one location or at various locations.