China Power Rationing disrupts the solar supply chain as coal shortages, price controls, and dual-control emissions policy curb electricity, squeezing polysilicon, aluminum, and module production and raising equipment costs amid surging post-Covid industrial demand.
Key Points
China's electricity curbs from coal shortages, price caps, and emissions targets disrupt solar output and materials.
✅ Polysilicon and aluminum output cut by power rationing
✅ Coal price spikes and power price caps squeeze generators
✅ Dual-control emissions policy triggers provincial curbs
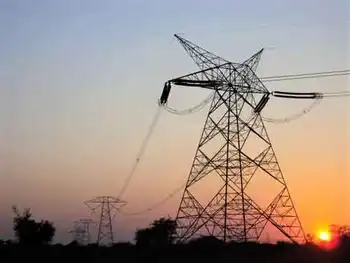
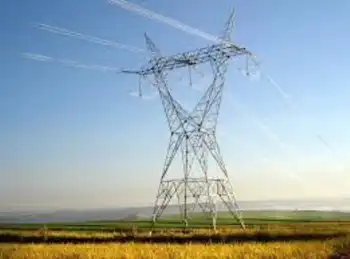
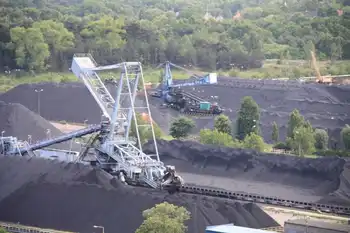
The solar manufacturing supply chain is among the industries being affected by a combination of soaring power demand, coal shortages, and carbon emission reduction measures which have seen widespread power cuts in China.
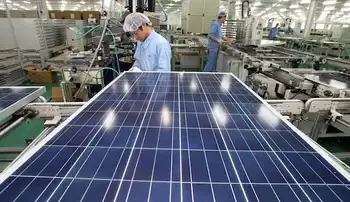
In Yunnan province, in southwest China, producers of the silicon metal which feeds polysilicon have been operating at 10% of the output they achieved in August. They are expected to continue to do so for the rest of the year as provincial authorities try to control electricity demand with a measure that is also affecting the phosphorus industry.
Fellow solar supply chain members from the aluminum industry in Guangxi province, in the south, have been forced to operate just two days per week, alongside peers in the concrete, steel, lime, and ceramics segments. Manufacturers in neighboring Guangdong have access to normal power supplies only on Fridays and Saturdays with electricity rationed to a 15% grid security load for the rest of the time.
pv magazine USA reported that a Tier 1 solar module manufacturer warned customers in an email that energy shortages in China have forced it to reduce or stop production at its Chinese manufacturing sites. The company warned the event will also affect output from its downstream cell and module production facilities in Southeast Asia.
The memo said that in order to recover from the effects of the “potential Force Majeure event,” it may delay or stop equipment delivery or seek to renegotiate contracts to pass through higher prices.
Raw material sourcing
With reports of drastic power shortages emerging from China in recent days, the country has actually been experiencing problems since late June, and similar pressures have seen India ration coal supplies this year, but rationing is not unusual during the peak summer hours.
What has changed this time is that the outages have continued and prompted rationing measures across 19 of the nation’s provinces for the rest of the year. The problems have been caused by a combination of rising post-Covid electricity demand at a time when the politically-motivated ban on imports of Australian coal has tightened supply; and the manner in which Beijing controls power prices, with the situation further exacerbated by carbon emissions reduction policy.
Demand
Electricity demand from industry, underscoring China’s electricity appetite, was 13.5 percentage points higher in the first eight months of the year than in the same period of 2020, at 3,585 TWh. That reflected a 13.8% year-on-year rise in total consumption, following earlier power demand drops when coronavirus shuttered plants, to 5.47 PWh, according to data from state energy industry trade body the China Electricity Council.
Figures produced by the China General Administration of Customs tell the same story: a rebound driven by the global recovery from the pandemic, as global power demand surges above pre-pandemic levels, with China recording import and export trade worth RMB2.48 trillion ($385 billion) in January-to-August. That was up 23.7% on the same period of last year and 22.8% higher than in the first eight months of 2019.
With Beijing having enforced an unofficial ban on imports of Australian coal for the last year or so – as the result of an ongoing diplomatic spat with Australia – rising demand for coal (which provided around 73% of Chinese electricity in the first half of the year) has further raised prices for the fossil fuel.
The problem for Chinese coal-fired power generators is that Beijing maintains strict controls on the price of electricity. As a result, input costs cannot be passed on to consumers. The mismatch between a liberalized coal market and centrally controlled end-user prices is illustrated by the current situation in Guangdong. There, a coal price of RMB1,560 per ton ($242) has pushed the cost of coal-fired electricity up to RMB0.472 per kilowatt-hour ($0.073). With coal power companies facing an electricity price ceiling of around RMB0.463/kWh ($0.071), generators are losing around RMB0.12 for every kilowatt-hour they generate. In that situation, rationing electricity supplies is an obvious remedy.
The crisis has been worsened by the introduction of China’s “dual control” energy policy, which aims to help meet President Xi Jinping’s climate change pledge of hitting peak carbon emissions this decade and a net zero economy by 2060, and to reduce coal power production over time. Dual control refers to attempts to wind down greenhouse gas emissions at both a national level and in more local areas, such as provinces and cities.
Red status
With the finer details of the carbon reduction policy yet to be ironed out, government departments and provincial and city authorities have started to set their own emission-reduction targets. In mid-August, state planning body the China National Development and Reform Commission (NDRC) published a table of the energy control situation across the nation. With nine provinces marked red for their energy consumption, and a further 10 highlighted as yellow, officials received another motivation to introduce power rationing.
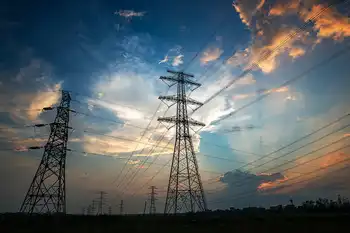
China’s solar industry is being impacted by coal shortages for electric power generation. In this 2014 photo, a thermal generating plant’s cooling towers loom over a street in Henan Province.
Image: flickr/V.T. Polywoda
The current approach of rolling blackouts seems unlikely to be a sustainable solution, as surging electricity demand strains power systems worldwide, given the damage it could inflict on industry and the resentment it would cause in parts of the nation already preparing for winter.
The choice facing China’s policymakers is whether to ramp up coal supplies to force prices down by using decommissioned domestic supplies and halting the ban on Australian imports, or to raise electricity prices to prompt generators to get the lights back on. While the drawbacks of raising household electricity bills seem obvious, the first approach of using more coal could endanger the nation’s climate change commitments on the even of the COP26 meeting in Glasgow, Scotland, in November. Sources close to the NDRC have suggested the electricity price may be set to rise soon.
GDP
What is clear is the effect the energy crisis is having on the Chinese economy and on the solar supply chain. Leading up to a national day holiday in China, the coal price in northern China rose to around RMB2,000 per ton ($310), three times higher than at the beginning of the year.
Investment bank China International Capital Corp. blamed the dual control emission reduction policy for the electricity shortages. It predicted a 0.1-0.15 percentage point impact on economic growth in the last quarter of 2021. Morgan Stanley has put that figure at 1% in the current quarter, if industrial output restrictions continue. And Japan’s Nomura Securities revised down its annual forecast on Chinese growth from 8.2% to 7.7%. It now expects GDP gains in the third and fourth quarters to cool from 5.1% to 4.7%, and from 4.4% to 3%, respectively.
Related News