Ontario First Nations urge government to intervene in 'urgently needed' electricity line


Chief Peter Collins, Fort William First Nation

Protective Relay Training - Basic

Our customized live online or in‑person group training can be delivered to your staff at your location.

  • Live Online
  • 12 hours Instructor-led
  • Group Training Available
Regular Price:
$699
Coupon Price:
$599
Reserve Your Seat Today

East-West Transmission Project Ontario connects Thunder Bay to Wawa, facing OEB bidding, Hydro One vs NextBridge, First Nations consultation, environmental assessment, Pukaskwa National Park route, and reliability needs for Northwestern Ontario industry and communities.


Key Points

A 450 km Thunder Bay-Wawa power line proposal facing OEB bidding, Hydro One competition, and First Nations consultation.

✅ Competing bids: Hydro One vs NextBridge under OEB rules

✅ First Nations cite duty to consult and environmental review gaps

✅ Route debate: Pukaskwa Park vs bypass; jobs and reliability at stake


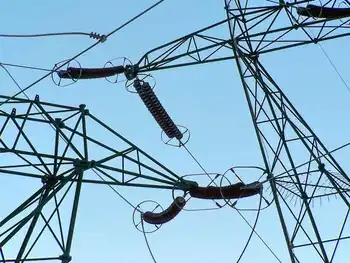
Leaders of six First Nations are urging the Ontario government to "clean up" the bureaucratic process that determines who will build an "urgently needed" high-capacity power transmission line to service northern Ontario.

The proposed 450 kilometre East-West Transmission Project is set to stretch from Thunder Bay to Wawa, providing much-needed electricity to northern Ontario. NextBridge Infrastructure, in partnership with Bamkushwada Limited Partnership (BLP) — an entity the First Nations created in order to become co-owners and active participants in the economic development of the line — have been the main proponents of the project since 2012 and were awarded the right to construct.

In 2018, Hydro One appealed to the previous Liberal government with a proposal to build the transmission line with lower maintenance costs. On Dec. 20, the Ontario Energy Board (OEB) issued a decision that said it will issue the contract to construct the project to the company with the lowest bid, even as a Manitoba Hydro line delay followed a board recommendation in a comparable case.

The transmission regime in Ontario allows competing bids at the beginning of a project to designate a transmitter, and then again at the end of the project to award leave to construct.

As a result, the Hydro One was permitted to submit a competing bid, five years after it was first proposed. The chiefs of the six First Nations say that will delay the project by two years, impede their land and violate their rights. The former Liberal government under which the project was initiated "left the door open" for competition to enter this late in the construction, according to the community leaders.

"The former government created this mess and Hydro One has taken advantage of this loophole," Fort William First Nation Chief Peter Collins said in a Queen's Park news conference on Thursday. "Hydro One is an interloper coming in at the last minute, trying taking over the project and all the hard work that has been done, without doing the work it needs to do."


Mess will explode, says chief

According to Collins, the Ontario Energy Board is likely to choose Hydro One's late submission in February, "causing this mess to explode." The electricity and distribution utility has not completed any of the legal requirements demanded by a project of this magnitude, Collins said, including extensive consultations with First Nations, such as oral traditional evidence hearings that inform regulators, and thorough environment assessments. He speculated that by ignoring these two things, even though in B.C. Ottawa did not oppose a Site C work halt pending a treaty rights challenge, Hydro One's bid will be the lowest cost.

"Hydro One's interference is a big problem," said Collins. He was flanked by the leaders of the Pic Mobert First Nation, Opwaaganasiniing (also known as the Red Rock Indian Band), Michipicoten, Biigtigong Nishnaabeg — or Pic River First Nation — and Pays Plat First Nation.

Collins also highlighted that Hydro One's proposed route for the transmission line will go through Pukaskwa National Park on which there are Aboriginal title claims, and noted that an opponent of the Site C dam has been sharing concerns with northerners, underscoring the need for meaningful engagement. NextBridge's proposal, Collins said, will go around the park.

If Hydro One is awarded the construction project, at risk, too, are as many as 1,000 job opportunities in northern Ontario (including the Ring of Fire) that are expected from NextBridge's proposal, as well as the "many millions" in contracting opportunities for the communities, Collins said.

"That companies such as Hydro One can do this and dissolve all that has been developed by NextBridge and our [partnership] and all the opportunities we have created will signal to ... everyone in Ontario that Ontario's not open for business, at least fair business," Collins said.


Ontario Energy Minister 'disappointed' by OEB's decision

In an email statement to National Observer, Energy Minister Greg Rickford's press secretary said the government acknowledged the concerns of the First Nations leaders, and is "disappointed that the OEB continues to stall on this important project."

"The East-West Tie project is a priority for Ontario because it is needed to provide a reliable and adequate supply of electricity to northwestern Ontario to support economic growth," she wrote.

In October, Rickford wrote to the OEB outlining his expectation that a prompt decision would be made through an efficient and fair process.

Despite the minister’s request, the OEB delayed a decision on this project in December — as in B.C., a utilities watchdog has pressed for answers on Site C dam stability — pushing the service date back to at least 2021. In 2017, NextBridge said that, pending OEB approval, it would start construction in 2018, with completion scheduled for 2020.

Without the transmission line, the community faces a higher likelihood of power outages and less reliable electricity overall.

"Our government takes the duty to consult seriously and it is committed to ensuring that all Indigenous communities are properly consulted and kept informed regardless of the result of the OEB process," Rickford's office's statement said.

In a letter sent to Premier Doug Ford, Rickford and to Environment Minister Rod Phillips, all members of the Bamkushwada Limited Partnership said they will be compelled to appeal the OEB's decision if the right to construct is given to Hydro One.

The entire situation, they wrote in their letter, is "an undeniable mess" that requires government intervention.

"If the Ontario government can correct this looming outcome, it is incumbent on the Ontario government to do so," they wrote, urging the government to "take all legal means to prevent the OEB from rendering an unconstitutional and unjust decision."

"Our First Nations and the north have waited five long years for this transmission project," Collins said. "Enough is enough."


Related News

Related News

Ontario rolls out ultra-low electricity rates

Ontario Ultra-Low Overnight Electricity Rate lets eligible customers opt in to 2.4 cents per kWh time-of-use pricing, set by the Ontario Energy Board, as utilities roll out the plan between May 1 and Nov. 1.


Key Points

An OEB-set overnight TOU price of 2.4 cents per kWh for eligible Ontarians, rolling out in phases via local utilities.

✅ 8 of 61 utilities offering rate at May 1 launch

✅ About 20% of 5M customers eligible at rollout

✅ Enova Power delays amid merger integration work


A million households can opt into a new ultra-low overnight electricity rate offered by the Ministry of Energy, as province-wide rate changes begin, but that's just a fraction of customers in Ontario.

Only eight of the 61 provincial power utilities will offer the new rate on the May 1 launch date, following the earlier fixed COVID-19 hydro rate period. The rest have up to six months to get on board.

That means it will be available to 20 percent of the province's five million electricity consumers, the Ministry of Energy confirmed to CBC News.

The Ford government's new overnight pricing was pitched as a money saver for Ontarians, amid the earlier COVID-19 recovery rate that could raise bills, undercutting its existing overnight rate from 7.4 to 2.4 cents per kilowatt hour. Both rates are set by the Ontario Energy Board (OEB).

"We wanted to roll it out to as many people as possible," Kitchener-Conestoga PC MPP Mike Harris Jr. told CBC News. "These companies were ready to go, and we're going to continue to work with our local providers to make sure that everybody can meet that Nov. 1 deadline."

Enova Power — which serves Kitchener, Waterloo, Woolwich, Wellesley and Wilmot — won't offer the reduced overnight rate until the fall, after typical bills rose when fixed pricing ended province-wide.

Enova merger stalls adoption

The power company is the product of the recently merged Kitchener-Wilmot Hydro and Waterloo North Hydro.

The Sept. 1 merger is a major reason Enova Power isn't offering the ultra-low rate alongside the first wave of power companies, said Jeff Quint, innovation and communications manager.

"With mergers, a lot of work goes into them. We have to evaluate, merge and integrate several systems and processes," said Quint.

"We believe that we probably would have been able to make the May 1 timeline otherwise."

The ministry said retroactive pricing wouldn't be available, unlike the off-peak price freeze earlier in the pandemic, and Harris said he doesn't expect the province will issue any rebates to customers of companies that introduce the rates later than May 1.

"These organizations were able to look at rolling things out sooner. But, obviously — if you look at Toronto Hydro, London, Centre Wellington, Hearst, Renfrew — there's a dynamic range of large and smaller-scale providers there. I'm very hopeful the Region of Waterloo folks will be able to work to try and get this done as soon as we can," Harris said.


Related News

View more

BC Hydro: 2021 was a record-breaking year for electricity demand

BC Hydro 2021 Peak Load Records highlight record-breaking electricity demand, peak load spikes, heat dome impacts, extreme cold, and shifting work-from-home patterns managed by a flexible hydroelectric system and climate-driven load trends.


Key Points

Record-breaking electricity demand peaks from extreme heat and cold that reshaped daily load patterns across BC in 2021.

✅ Heat dome and deep freeze drove sustained peak electricity demand

✅ Peak load built gradually, reflecting work-from-home behavior

✅ Flexible hydroelectric system adapts quickly to demand spikes


From June’s heat dome to December’s extreme cold, 2021 was a record-setting year, according to BC Hydro, and similar spikes were noted as Calgary's electricity use surged in frigid weather.

On Friday, the energy company released a new report on electricity demand, and how extreme temperatures over extended periods of time, along with growing scrutiny of crypto mining electricity use, led to record peak loads.

“We use peak loads to describe the electricity demand in the province during the highest load hour of each day,” Kyle Donaldson, BC Hydro spokesperson, said in a media release.

“With the heat dome in the summer and the sustained cold temperatures in December, we saw more record-breaking hours on more days last year than any other single year.”

According to BC Hydro, during summer, the Crown corporation recorded 19 of its top 25 all-time summer daily peak records — including breaking its all-time summer peak hourly demand record.

In December, which saw extremely cold temperatures and heavy snowfall, BC Hydro said its system experienced the highest and longest sustained load levels ever, as it activated its winter payment plan to assist customers.

Overall, BC Hydro says it has experienced 11 of its top 25 all-time daily peak records this winter, adding that Dec. 27 broke its all-time high peak hourly demand record.

“BC Hydro’s hydroelectric system is directly impacted by variations in weather, including drought conditions that require adaptation, and in 2021 more electricity demand records were broken than any other year prior, largely because of the back-to-back extreme temperatures lasting for days and weeks on end,” reads the report.

The energy company expects this trend to continue, noting that it has broken the peak record five times in the past five years, and other jurisdictions such as Quebec consumption record have also shattered consumption records.

It also noted that peak demand patterns have also changed since the first year of the COVID-19 pandemic, with trends seen during Earth Hour usage offering context.

“When the previous peak hourly load record was broken in January 2020, load displayed sharper increases and decreases throughout the day, suggesting more typical weather and behaviour,” said the report.

“In contrast, the 2021 peak load built up more gradually throughout the day, suggesting more British Columbians were likely working from home, or home for the holidays – waking up later and home earlier in the evening – as well as colder weather than average.”

BC Hydro also said “current climate models suggest a warming trend continuing in years to come which could increase demand year-round,” but noted that its flexible hydroelectric system can meet changes in demand quickly.


Related News

View more

During this Pandemic, Save Money - How To Better Understand Your Electricity Bill

Commercial Electric Tariffs explain utility rate structures, peak demand charges, kWh vs kW pricing, time-of-use periods, voltage, delivery, capacity ratchets, and riders, guiding facility managers in tariff analysis for accurate energy savings.


Key Points

Commercial electric tariffs define utility pricing for energy, demand, delivery, time-of-use periods, riders, and ratchet charges.

✅ Separate kWh charges from kW peak demand fees.

✅ Verify time-of-use windows and demand interval length.

✅ Review riders, capacity ratchets, and minimum demand clauses.


Especially during these tough economic times, as major changes to electric bills are debated in some states, facility executives who don’t understand how their power is priced have been disappointed when their energy projects failed to produce expected dollar savings. Here’s how not to be one of them.

Your electric rate is spelled out in a document called a “tariff” that can be downloaded from your utility’s web page. A tariff should clearly spell out the costs for each component that is part of your rate, reflecting cost allocation practices in your region. Don’t be surprised to learn that it contains a bunch of them. Unlike residential electric rates, commercial electric bills are not based solely on the quantity of kilowatt-hours (kWh) consumed in a billing period (in the United States, that’s a month). Instead, different rates may apply to how your power is supplied, how it is delivered via electricity delivery charges, when it was consumed, its voltage, how fast it was used (in kW), and other factors.

If a tariff’s lingo and word structure are too opaque, spend some time with a utility account rep to translate it. Many state utility commissions also have customer advocates that may assist as they explore new utility rate designs that affect customers. Alternatively, for a fee, facility managers can privately chat with an energy consultant.

Common mistakes

Many facility managers try to estimate savings based on an averaged electric rate, i.e., annual electric spend divided by annual kWh. However, in markets where electricity demand is flat, such a number may obscure the fastest rising cost component: monthly peak demand charges, measured in dollars per kW (or kilo-volt-amperes, kVA).

This charge is like a monthly speeding ticket, based solely on the highest speed you drove during that time. In some areas, peak demand charges now account for 30 to 60 percent of a facility’s annual electric spend. When projecting energy cost savings, failing to separately account for kW peak demand and kWh consumption may result in erroneous results, and a lot of questions from the C-suite.

How peak demand charges are calculated varies among utilities. Some base it on the highest average speed of use across one hour in a month, while others may use the highest average speed during a 15- or 30-minute period. Others may average several of the highest speeds within a defined time period (for example, 8 a.m. to 6 p.m. on weekdays). It is whatever your tariff says it is.

Because some power-consuming (or producing) devices, including those tied to smart home electricity networks, vary in their operation or abilities, they may save money on a few — but not all — of those rate components. If an equipment vendor calculates savings from its product by using an average electric rate, take pause. Tell the vendor to return after the proposal has been redone using tariff-based numbers.

When a vendor is the only person calculating potential savings from using a product, there’s also a built-in conflict of interest: The person profiting from an equipment sale should not also be the one calculating its expected financial return. Before signing any energy project contracts, it’s essential that someone independent of the deal reviews projected savings. That person (typically an energy or engineering consultant) should be quite familiar with your facility’s electric tariff, including any special provisions, riders, discounts, etc., that may pertain. When this doesn’t happen, savings often don’t occur as planned. 

For example, some utilities add another form of demand charge, based on the highest kW in a year. It has various names: capacity, contract demand, or the generic term “ratchet charge.” Some utilities also have a minimum ratchet charge which may be based on a percent of a facility’s annual kW peak. It ensures collection of sufficient utility revenue to cover the cost of installed transmission and distribution even when a customer significantly cuts its peak demand.


Related News

View more

UK low-carbon electricity generation stalls in 2019

UK low-carbon electricity 2019 saw stalled growth as renewables rose slightly, wind expanded, nuclear output fell, coal hit record lows, and net-zero targets demand faster deployment to cut CO2 intensity below 100gCO2/kWh.


Key Points

Low-carbon sources supplied 54% of UK power in 2019, up just 1TWh; wind grew, nuclear fell, and coal dropped to 2%.

✅ Wind up 8TWh; nuclear down 9TWh amid outages

✅ Fossil fuels 43% of generation; coal at 2%

✅ Net-zero needs 15TWh per year added to 2030


The amount of electricity generated by low-carbon sources in the UK stalled in 2019, Carbon Brief analysis shows.

Low-carbon electricity output from wind, solar, nuclear, hydro and biomass rose by just 1 terawatt hour (TWh, less than 1%) in 2019. It represents the smallest annual increase in a decade, where annual growth averaged 9TWh. This growth will need to double in the 2020s to meet UK climate targets while replacing old nuclear plants as they retire.

Some 54% of UK electricity generation in 2019 came from low-carbon sources, including 37% from renewables and 20% from wind alone, underscoring wind's leading role in the power mix during key periods. A record-low 43% was from fossil fuels, with 41% from gas and just 2% from coal, also a record low. In 2010, fossil fuels generated 75% of the total.

Carbon Brief’s analysis of UK electricity generation in 2019 is based on figures from BM Reports and the Department for Business, Energy and Industrial Strategy (BEIS). See the methodology at the end for more on how the analysis was conducted.

The numbers differ from those published earlier in January by National Grid, which were for electricity supplied in Great Britain only (England, Wales and Scotland, but excluding Northern Ireland), including via imports from other countries.

Low-carbon low
In 2019, the UK became the first major economy to target net-zero greenhouse gas emissions by 2050, increasing the ambition of its legally binding Climate Change Act.

To date, the country has cut its emissions by around two-fifths since 1990, with almost all of its recent progress coming from the electricity sector.

Emissions from electricity generation have fallen rapidly in the decade since 2010 as coal power has been almost phased out and even gas output has declined. Fossil fuels have been displaced by falling demand and by renewables, such as wind, solar and biomass.

But Carbon Brief’s annual analysis of UK electricity generation shows progress stalled in 2019, with the output from low-carbon sources barely increasing compared to a year earlier.

The chart below shows low-carbon generation in each year since 2010 (grey bars) and the estimated level in 2019 (red). The pale grey bars show the estimated future output of existing low-carbon sources after old nuclear plants retire and the pale red bars show the amount of new generation needed to keep electricity sector emissions to less than 100 grammes of CO2 per kilowatt hour (gCO2/kWh), the UK’s nominal target for the sector.

 Annual electricity generation in the UK by fuel, terawatt hours, 2010-2019. Top panel: fuel by fuel. Bottom panel: cumulative total generation from all sources. Source: BEIS energy trends, BM Reports and Carbon Brief analysis. Chart by Carbon Brief using Highcharts.
As the chart shows, the UK will require significantly more low-carbon electricity over the next decade as part of meeting its legally binding climate goals.

The nominal 100gCO2/kWh target for 2030 was set in the context of the UK’s less ambitious goal of cutting emissions to 80% below 1990 levels by 2050. Now that the country is aiming to cut emissions to net-zero by 2050, that 100gCO2/kWh indicator is likely to be the bare minimum.

Even so, it would require a rapid step up in the pace of low-carbon expansion, compared to the increases seen over the past decade. On average, low-carbon generation has risen by 9TWh each year in the decade since 2010 – including a rise of just 1TWh in 2019.

Given scheduled nuclear retirements and rising demand expected by the Committee on Climate Change (CCC) – with some electrification of transport and heating – low-carbon generation would need to increase by 15TWh each year until 2030, just to meet the benchmark of 100gCO2/kWh.

For context, the 3.2 gigawatt (GW) Hinkley C new nuclear plant being built in Somerset will generate around 25TWh once completed around 2026. The world’s largest offshore windfarm, the 1.2GW Hornsea One scheme off the Yorkshire coast, will generate around 5TWh each year.

The new Conservative government is targeting 40GW of offshore wind by 2030, up from today’s figure of around 8GW. If policies are put in place to meet this goal, then it could keep power sector emissions below 100gCO2/kWh, depending on the actual performance of the windfarms built.

However, new onshore wind and solar, further new nuclear or other low-carbon generation, such as gas with carbon capture and storage (CCS), is likely to be needed if demand is higher than expected, or if the 100gCO2/kWh benchmark is too weak in the context of net-zero by 2050.

The CCC says it is “likely” to “reflect the need for more rapid deployment” of low-carbon towards net-zero emissions in its advice on the sixth UK carbon budget for 2033-2037, due in September.

Trading places
Looking more closely at UK electricity generation in 2019, Carbon Brief’s analysis shows why there was so little growth for low-carbon sources compared to the previous year.

There was another increase for wind power in 2019 (up 8TWh, 14%), with record wind generation as several large new windfarms were completed including the 1.2GW Hornsea One project in October and the 0.6GW Beatrice offshore windfarm in Q2 of 2019. But this was offset by a decline for nuclear (down 9TWh, 14%), due to ongoing outages for reactors at Hunterston in Scotland and Dungeness in Kent.

(Analysis of data held by trade organisation RenewableUK suggests some 0.6GW of onshore wind capacity also started operating in 2019, including the 0.2GW Dorenell scheme in Moray, Scotland.)

As a result of these movements, the UK’s windfarms overtook nuclear for the first time ever in 2019, becoming the country’s second-largest source of electricity generation, and earlier, wind and solar together surpassed nuclear in the UK as momentum built. This is shown in the figure below, with wind (green line, top panel) trading places with nuclear (purple) and gas (dark blue) down around 25% since 2010 but remaining the single-largest source.

 Annual electricity generation in the UK by fuel, terawatt hours, 2010-2019. Top panel: fuel by fuel. Bottom panel: cumulative total generation from all sources. Source: BEIS energy trends, BM Reports and Carbon Brief analysis. Chart by Carbon Brief using Highcharts.
The UK’s currently suspended nuclear plants are due to return to service in January and March, according to operator EDF, the French state-backed utility firm. However, as noted above, most of the UK’s nuclear fleet is set to retire during the 2020s, with only Sizewell B in Suffolk due to still be operating by 2030. Hunterston is scheduled to retire by 2023 and Dungeness by 2028.

Set against these losses, the UK has a pipeline of offshore windfarms, secured via “contracts for difference” with the government, at a series of auctions. The most recent auction, in September 2019, saw prices below £40 per megawatt hour – similar to current wholesale electricity prices.

However, the capacity contracted so far is not sufficient to meet the government’s target of 40GW by 2030, meaning further auctions – or some other policy mechanism – will be required.

Coal zero
As well as the switch between wind and nuclear, 2019 also saw coal fall below solar for the first time across a full year, echoing the 2016 moment when wind outgenerated coal across the UK, after it suffered another 60% reduction in electricity output. Just six coal plants remain in the UK, with Aberthaw B in Wales and Fiddlers Ferry in Cheshire closing in March.

Coal accounted for just 2% of UK generation in 2019, a record-low coal share since centralised electricity supplies started to operate in 1882. The fuel met 40% of UK needs as recently as 2012, but has plummeted thanks to falling demand, rising renewables, cheaper gas and higher CO2 prices.

The reduction in average coal generation hides the fact that the fuel is now often not required at all to meet the UK’s electricity needs. The chart below shows the number of days each year when coal output was zero in 2019 (red line) and the two previous years (blue).

 Cumulative number of days when UK electricity generation from renewable sources has been higher than that from fossil fuels. Source: BEIS energy trends, BM Reports and Carbon Brief analysis. Chart by Carbon Brief using Highcharts.
The 83 days in 2019 with zero coal generation amount to nearly a quarter of the year and include the record-breaking 18-day stretch without the fuel.

Great Britain has been running for a record TWO WEEKS without using coal to generate electricity – the first time this has happened since 1882.

The country’s grid has been coal-free for 45% of hours in 2019 so far.https://www.carbonbrief.org/countdown-to-2025-tracking-the-uk-coal-phase-out …

Coal generation was set for significant reductions around the world in 2019 – including a 20% reduction for the EU as a whole – according to analysis published by Carbon Brief in November.

Notably, overall UK electricity generation fell by another 9TWh in 2019 (3%), bringing the total decline to 58TWh since 2010. This is equivalent to more than twice the output from the Hinkley C scheme being built in Somerset. As Carbon Brief explained last year, falling demand has had a similar impact on electricity-sector CO2 emissions as the increase in output from renewables.

This is illustrated by the fact that the 9TWh reduction in overall generation translated into a 9TWh (6%) cut in fossil-fuel generation during 2019, with coal falling by 10TWh and gas rising marginally.

Increasingly renewable
As fossil-fuel output and overall generation have declined, the UK’s renewable sources of electricity have continued to increase. Their output has risen nearly five-fold in the past decade and their share of the UK total has increased from 7% in 2010 to 37% in 2019.

As a result, the UK’s increasingly renewable grid is seeing more minutes, hours and days during which the likes of wind, solar and biomass collectively outpace all fossil fuels put together, and on some days wind is the main source as well.

The chart below shows the number of days during each year when renewables generated more electricity than fossil fuels in 2019 (red line) and each of the previous four years (blue lines). In total, nearly two-fifths of days in 2019 crossed this threshold.

 Cumulative number of days when the UK has not generated any electricity from coal. Source: BEIS energy trends, BM Reports and Carbon Brief analysis. Chart by Carbon Brief using Highcharts.
There were also four months in 2019 when renewables generated more of the UK’s electricity than fossil fuels: March, August, September and December. The first ever such month came in September 2018 and more are certain to follow.

National Grid, which manages Great Britain’s high-voltage electricity transmission network, is aiming to be able to run the system without fossil fuels by 2025, at least for short periods. At present, it sometimes has to ask windfarm operators to switch off and gas plants to start running in order to keep the electricity grid stable.

Note that biomass accounted for 11% of UK electricity generation in 2019, nearly a third of the total from all renewables. Some two-thirds of the biomass output is from “plant biomass”, primarily wood pellets burnt at Lynemouth in Northumberland and the Drax plant in Yorkshire. The remainder was from an array of smaller sites based on landfill gas, sewage gas or anaerobic digestion.

The CCC says the UK should “move away” from large-scale biomass power plants, once existing subsidy contracts for Drax and Lynemouth expire in 2027.

Using biomass to generate electricity is not zero-carbon and in some circumstances could lead to higher emissions than from fossil fuels. Moreover, there are more valuable uses for the world’s limited supply of biomass feedstock, the CCC says, including carbon sequestration and hard-to-abate sectors with few alternatives.

Methodology
The figures in the article are from Carbon Brief analysis of data from BEIS Energy Trends chapter 5 and chapter 6, as well as from BM Reports. The figures from BM Reports are for electricity supplied to the grid in Great Britain only and are adjusted to include Northern Ireland.

In Carbon Brief’s analysis, the BM Reports numbers are also adjusted to account for electricity used by power plants on site and for generation by plants not connected to the high-voltage national grid. This includes many onshore windfarms, as well as industrial gas combined heat and power plants and those burning landfill gas, waste or sewage gas.

By design, the Carbon Brief analysis is intended to align as closely as possible to the official government figures on electricity generated in the UK, reported in BEIS Energy Trends table 5.1.

Briefly, the raw data for each fuel is in most cases adjusted with a multiplier, derived from the ratio between the reported BEIS numbers and unadjusted figures for previous quarters.

Carbon Brief’s method of analysis has been verified against published BEIS figures using “hindcasting”. This shows the estimates for total electricity generation from fossil fuels or renewables to have been within ±3% of the BEIS number in each quarter since Q4 2017. (Data before then is not sufficient to carry out the Carbon Brief analysis.)

For example, in the second quarter of 2019, a Carbon Brief hindcast estimates gas generation at 33.1TWh, whereas the published BEIS figure was 34.0TWh. Similarly, it produces an estimate of 27.4TWh for renewables, against a BEIS figure of 27.1TWh.

National Grid recently shared its own analysis for electricity in Great Britain during 2019 via its energy dashboard, which differs from Carbon Brief’s figures.


Related News

View more

Sustainable Marine now delivering electricity to Nova Scotia grid from tidal energy

Sustainable Marine tidal energy delivers in-stream power to Nova Scotia's grid from Grand Passage, proving low-impact, renewable generation and advancing a floating tidal array at FORCE and Minas Passage in the Bay of Fundy.


Key Points

The first in-stream tidal project supplying clean power to Nova Scotia's grid, proven at Grand Passage.

✅ First to deliver in-stream tidal power to Canada's grid

✅ Demonstration at Grand Passage informs FORCE deployments

✅ Low-impact design and environmental monitoring validated


Sustainable Marine has officially powered up its tidal energy operation in Canada and is delivering clean electricity to the power system in Nova Scotia, on the country’s Atlantic coast, as the province moves to increase wind and solar projects in the years ahead. The company’s system in Grand Passage is the first to deliver in-stream tidal power to the grid in Canada, following provincial approval to harness Bay of Fundy tides that is spurring further development.

The system start-up is the culmination of more than a decade of research, development and testing, including lessons from Scottish tidal projects in recent years and a powerful tidal turbine feeding onshore grids, managing the technical challenges associated with operating in highly energetic environments and proving the ultra-low environmental impact of the tidal technology.

Sustainable Marine is striving to deliver the world’s first floating tidal array at FORCE (Fundy Ocean Research Centre for Energy). This project will be delivered in phases, drawing upon the knowledge gained and lessons learned in Grand Passage, and insights from offshore wind pilots like France’s first offshore wind turbine in Europe. In the coming months the company will continue to operate the platform at its demonstration site at Grand Passage, gradually building up power production, while New York and New England clean energy demand continues to rise, to further prove the technology and environmental monitoring systems, before commencing deployments in the Minas Passage – renowned as the Everest of tidal energy.

The Bay of Fundy’s huge tidal energy resource contains more than four times the combined flow of every freshwater river in the world, with the potential to generate approximately 2,500 MW of green energy, underscoring why independent electricity planning will be important for integrating marine renewables.


Related News

View more

Electric vehicles to transform the aftermarket … eventually

Heavy-Duty Truck Electrification is disrupting the aftermarket as diesel declines: fewer parts, regenerative braking, emissions rules, e-drives, gearboxes, and software engineering needs reshape service demand, while ICE fleets persist for years.


Key Points

Transition of heavy trucks to EV systems, reducing parts and emissions while reshaping aftermarket service and skills.

✅ 33% fewer parts; regenerative braking slashes brake wear

✅ Diesel share declines; EVs and natural gas slowly gain

✅ Aftermarket shifts to e-drives, gearboxes, software and service


Those who sell parts and repair trucks might feel uneasy when reports emerge about a coming generation of electric trucks.

There are reportedly about 33% fewer parts to consider when internal combustion engines and transmissions are replaced by electric motors. Features such as regenerative braking are expected to dramatically reduce brake wear. As for many of the fluids needed to keep components moving? They can remain in their tanks and drums.

Think of them as disruptors. But presenters during the annual Heavy Duty Aftermarket Dialogue are stressing that the changes are not coming overnight. Chris Patterson, a consultant and former Daimler Trucks North America CEO, noted that the Daimler electrification plan underscores the shift as he counts just 50 electrified heavy trucks in North America.

About 88% of today’s trucks run on diesel, with the remaining 12% mostly powered by gasoline, said John Blodgett, MacKay and Company’s vice-president of sales and marketing. Five years out, even amid talk of an EV inflection point, he expects 1% to be electric, 2% to be natural gas, 12% to be gasoline, and 84% on diesel.

But a decade from now, forecasts suggest a split of 76% diesel, 11% gasoline, 7% electric, and 5% natural gas, with a fraction of a percent relying on hydrogen-electric power. Existing internal combustion engines will still be in service, and need to be serviced, but aftermarket suppliers are now preparing for their roles in the mix, especially as Canada’s EV opportunity comes into focus for North American players.

“This is real, for sure,” said Delphi Technologies CEO Rick Dauch.

Aftermarket support is needed
“As programs are launched five to six years from now, what are the parts coming back?” he asked the crowd. “Braking and steering. The fuel injection business will go down, but not for 20-25 years.” The electric vehicles will also require a gear box and motor.

“You still have a business model,” he assured the crowd of aftermarket professionals.

Shifting emissions standards are largely responsible for the transformation that is occurring. In Europe, Volkswagen’s diesel emissions scandal and future emissions rules of Euro 7 will essentially sideline diesel-powered cars, even as electric buses have yet to take over transit systems. Delphi’s light-duty diesel business has dropped 70% in just five years, leading to plant closures in Spain, France and England.

“We’ve got a billion-dollar business in electrification, last year down $200 million because of the downturn in light-duty diesel controllers,” Dauch said. “We think we’re going to double our electrification business in five years.”

That has meant opening five new plants in Eastern European markets like Turkey, Romania and Poland alone.

Deciding when the market will emerge is no small task, however. One new plant in China offered manufacturing capacity in July 2019, but it has yet to make any electric vehicle parts, highlighting mainstream EV challenges tied to policy shifts, because the Chinese government changed the incentive plans for electric vehicles.

‘All in’ on electric vehicles
Dana has also gone “all in” on electrification, said chairman and CEO Jim Kamsickas, referring to Dana’s work on e-drives with Kenworth and Peterbilt. Its gasket business is focusing on the needs of battery cooling systems and enclosures.

But he also puts the demand for new electric vehicle systems in perspective. “The mechanical piece is still going to be there.”

The demand for the new components and systems, however, has both companies challenged to find enough capable software engineers. Delphi has 1,600 of them now, and it needs more.

“Just being a motor supplier, just being an inverter supplier, just being a gearbox supplier itself, yes you’ll get value out of that. But in the longhaul you’re going to need to have engineers,” Kamsickas said of the work to develop systems.

Dauch noted that Delphi will leave the capital-intensive work of producing batteries to other companies in markets like China and Korea. “We’re going to make the systems that are in between – inverters, chargers, battery management systems,” he said.

Difficult change
But people working for European companies that have been built around diesel components are facing difficult days. Dauch refers to one German village with a population of 1,200, about 800 of whom build diesel engine parts. That business is working furiously to shift to producing gasoline parts.

Electrification will face hurdles of its own, of course. Major cities around the world are looking to ban diesel-powered vehicles by 2050, but they still lack the infrastructure needed to charge all the cars and truck fleet charging at scale, he added.

Kamsickas welcomes the disruptive forces.

“This is great,” he said. “It’s making us all think a little differently. It’s just that business models have had to pivot – for you, for us, for everybody.”

They need to be balanced against other business demands, including evolving cross-border EV collaboration dynamics, too.

Said Kamsickas: “Working through the disruption of electrification, it’s how do you financially manage that? Oh, by the way, the last time I checked there are [company] shareholders and stakeholders you need to take care of.”

“It’s going to be tough,” Dauch agreed, referring to the changes for suppliers. “The next three to four years are really going to be game changes. “There’ll be some survivors and some losers, that’s for sure.”


Related News

View more

Sign Up for Electricity Forum’s Newsletter

Stay informed with our FREE Newsletter — get the latest news, breakthrough technologies, and expert insights, delivered straight to your inbox.

Electricity Today T&D Magazine Subscribe for FREE

Stay informed with the latest T&D policies and technologies.
  • Timely insights from industry experts
  • Practical solutions T&D engineers
  • Free access to every issue

Download the 2025 Electrical Training Catalog

Explore 50+ live, expert-led electrical training courses –

  • Interactive
  • Flexible
  • CEU-cerified